Synthesis and structural properties of N -3,4-(dichlorophenyl)-3-oxo-3- phenyl-2-(phenylcarbonyl)propanamide and its Cu(II) complex
Bạn đang xem bản rút gọn của tài liệu. Xem và tải ngay bản đầy đủ của tài liệu tại đây (17.91 MB, 17 trang )
Turk J Chem
(2016) 40: 76 92
ă ITAK
c TUB
Turkish Journal of Chemistry
/>
doi:10.3906/kim-1501-32
Research Article
Synthesis and structural properties of N -3,4-(dichlorophenyl)-3-oxo-3phenyl-2-(phenylcarbonyl)propanamide and its Cu(II) complex
1
˘
Ahmet Oral SARIOGLU
, Tu˘
gba TAS
¸ KIN TOK1,∗, Mehmet AKKURT2 ,
1
3 , Mehmet SONMEZ
ă
Muhammad Nawaz TAHIR
1
Department of Chemistry, Faculty of Arts and Sciences, Gaziantep University,
S
¸ ehitkamil, Gaziantep, Turkey
2
Department of Physics, Faculty of Sciences, Erciyes University, Kayseri, Turkey
3
Department of Physics, University of Sargodha, Sargodha, Pakistan
Received: 13.01.2015
•
Accepted/Published Online: 12.07.2015
•
Final Version: 05.01.2016
Abstract: A new N-carboxamide compound (3) was synthesized by the reaction of dibenzoylaceticacid- N -carboxyethylamide (1) and 3,4-dichloroaniline (2). The N -(3,4-dichlorophenyl)-3-oxo-3-phenyl-2-(phenylcarbonyl) propanamide (3)
subsequently reacted with Cu salt to produce its Cu(II) complex compound (4). The compounds were characterized by
analytical and spectral methods. In addition, X-ray diffraction was performed to characterize and obtain detailed information about the structure of 3. The fully optimized geometries of compounds 3 and 4 were calculated at different basis
sets by using the Gaussian09 (G09) software to investigate their 3D geometries and electronic structures. Comparisons
between the calculated and experimental data including molecular structures, fundamental vibrational modes, and electronic properties were made. The comparisons showed that the theoretical data were compatible with the corresponding
experimental values of compounds 3 and 4.
Key words: Carboxamide, copper complex, X-ray, computational analysis
1. Introduction
Research on carboxamide compounds started with the identification of their chemical properties. Carboxamides
play a key role in significant life processes such as protein formation. 1 When amides are conjugates with other
aliphatic, aromatic, and heterocyclic rings various types of biological activity are produced. Recent reports have
shown the importance of carboxamides in terms of anticonvulsant activity 2 in the search for new antagonists
of excitatory amino acids receptors.
In the meantime, coordination chemistry of metal complexes derived from ligands involving carboxamide
(–CONH–) nitrogen donors has received considerable current attention. 3−6 Moreover, transition metal complexes of carboxamides have a crucial role in a vast number of widely differing biological processes. The ligands
have carboxamide chains and their metal chelates represent very important pharmacological activities. 7,8 There
are several roles exhibited by carboxamide nitrogen in the chemistry of different coordination complexes. The
binding of two carboxamido nitrogen atoms with copper centers was observed in prion protein. 9
Several reports have mentioned that the computational method has become a worthy partner and complement to experimental studies. The computational ab initio method is widely used to simulate UV-Vis, IR, and
∗ Correspondence:
76
˘
SARIOGLU
et al./Turk J Chem
NMR spectra. In the present study, N -(3,4-dichlorophenyl)-3-oxo-3-phenyl-2-(phenylcarbonyl)propanamide
(3) was synthesized with dibenzoylaceticacid-N -carboxyethylamide (1) 10 and 3,4-dichloroaniline (2), for the
reasons mentioned above. Compound 3 was characterized by elemental analysis, IR, UV-Vis, 1 H, APT NMR
and LC-MS/MS spectroscopy. Furthermore, compound 3 was examined using X-ray diffraction to reinforce the
proposed structure. The Cu(II) complex compound 4 was obtained by the reaction of the bidentate ligand 3
and Cu(CH 3 COO) 2 .H 2 O. Moreover, compound 4 was characterized by elemental analysis, IR, UV-Vis spectral
data, and magnetic measurements. Finally, the computational ab initio method was performed as a basis of
comparison with the experimental and X-ray data for compounds 3 and 4. Additionally, molecular electrostatic
potential surface (MEPS) and the highest occupied molecular orbital (HOMO) and lowest unoccupied molecular
orbital (LUMO) gap were calculated to investigate the electron density and predict the biochemical activity of
the new N -carboxamide compound (3).
2. Results and discussion
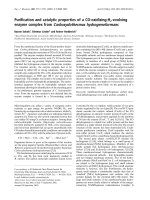
2.1. Synthesis and characterization
Compound 3 was obtained through the reaction of dibenzoylaceticacid-N -carboxyethylamide (1) and 3,4dichloroaniline (2) in toluene. Complex 4 was synthesized by reaction of N -(3,4-dichlorophenyl)-3-oxo-3-phenyl2-(phenylcarbonyl) propanamide (3) with Cu(CH 3 COO) 2 .H 2 O in a chloroform and methanol mixture. The
route for the synthesis of compounds 3 and 4 is shown in the Scheme. The characterization of 3 and 4 was
carried out by elemental analysis, UV-Vis, IR, 1 H, APT NMR, and LS-MS/MS spectroscopy and magnetic
measurements.
The 1 H and APT NMR spectra gave results compatible with the structure of N -(3,4-dichlorophenyl)-3oxo-3-phenyl-2-(phenylcarbonyl) propanamide (3). In the 1 H NMR spectrum of 3 in DMSO-d 6 , the aromatic
protons appeared as a broad band at 6.74–8.20 ppm, –NH proton at 10.73 ppm, and –CH proton among three
carbonyl groups at 3.40 ppm. Furthermore, the APT NMR spectrum easily showed us which types of carbon
were in compound 3. In particular, carbonyl carbon, which was neighbors with nitrogen, was observed at 192.75
ppm, and the other two carbonyl carbons appeared at 164.73 ppm in positive amplitude of the spectrum. The
carbon atoms without hydrogen in benzene rings were observed at 125.74 and 131.64 ppm, and two C–Cl
carbon atoms at 136.00 and 139.10 ppm. In negative amplitude of the APT NMR spectrum, there were two
types of carbon atom including one hydrogen. One carbon atom including one hydrogen in benzene rings was
located at 119.67, 120.78, 127.90, 128.86, 129.34, 129.56, 131.37, and 134.49 and the second one, C–H carbon,
among three carbonyl carbons at 64.88 ppm. In summary, 1 H and APT NMR spectra of compound 3 provided
the characteristic chemical shifts and confirmed the proposed structure. Due to the paramagnetic property of
compound 4, its
1
H and APT NMR spectra were not available. The IR spectral data of compound 3 showed
the formation of the proposed structure by the appearance of new absorption bands at 3254 cm −1 (N–H), 3062
cm −1 (Ar), 1687, 1672, 1537 cm −1 (C=O), 1593–1448 cm −1 (C=C), and 816 cm −1 (Ph–Cl). Furthermore,
the result of LC-MS/MS spectroscopy supported the proposed compound (3). After conversion of compound 3
to the complex compound 4, the peaks of the N–H and C=O of amide vibrations disappeared. The IR spectrum
of compound 4 clearly exhibited the formation of compound 4 by the appearance of new absorption bands at
3028 cm −1 (Ar), 1617 cm −1 (C=O), 1593–1448 cm −1 (C=C), 1513 cm −1 (C=N), and 811 cm −1 (Ph–Cl).
Moreover, the complex compound 4 was paramagnetic, with a magnetic moment (µef f ) value of 1.82 B.M.
The magnetic moment value indicated that the complex had a square planar conformation with the Cu(II)
77
˘
SARIOGLU
et al./Turk J Chem
center. 11,12 Therefore, we can confirm that the complex compound 4 had a square planar geometry with the
Cu(II) center, due to the IR spectrum and magnetic moment value.
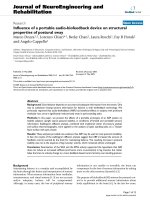
Furthermore, UV-Vis spectra of compounds 3 and 4 in DMF are given in Figure 1. The data of 3 and
4 were very similar to each other because of their structural identity. However, the absorbance intensities of 3
and 4 were different. This indicates the formation of complex 4 from compound 3. Their electronic spectra in
DMF solutions along with bands assigned to π → π * and n → π ∗ transitions also exhibited absorption maxima
at 270 nm and 315 nm.
Figure 1. The UV-Vis spectra of compounds 3 and 4 in DMF.
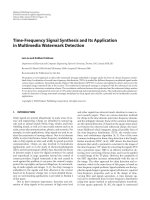
2.2. X-ray crystallography results
As shown in Figure 2, the C17–C22 benzene ring of compound 3 with the two chlorine atoms attached makes
dihedral angles of 71.62(14) ◦ and 84.77(17) ◦ , respectively, with the terminal phenyl rings (C1–C6 and C10–
C15). These phenyl rings formed a dihedral angle of 77.85(18) ◦ with each other.
All bond lengths and angles were within the normal range and were comparable to the corresponding
values observed in similar structures. 13 The O1–C7–C8–C9, O1–C7–C8–C16, O2–C9–C8–C7, O2–C9–C8–C16,
O3–C16–C8–C9, O3–C16–C8–C7, and O3–C16–N1–C17 torsion angles were –13.8(4) ◦ , 105.2(3) ◦ , –107.7(3) ◦ ,
11.3(4) ◦ , –88.0(3) ◦ , 33.1(4) ◦ , and 3.7(5) ◦ , respectively.
A weak intramolecular C–H...O interaction, which formed an S(6) ring, helped to establish the molecular
conformation of compound 3 (Table 1). 14 In the crystal structure, neighboring molecules were linked by N–H...O
and C–H...O hydrogen bonds, forming a three-dimensional network (Table 1; Figure 3). Furthermore, C–H...π
interactions stabilized the crystal packing.
78
˘
SARIOGLU
et al./Turk J Chem
2.3. Computational results
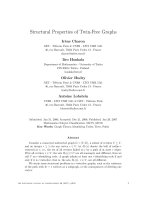
As a first approach, we carried out the geometry optimization of compound 3 and complex compound 4.
The optimized compounds (3 and 4) were obtained representing the numbering scheme of the atoms with
computational ab initio methods by using the G09 program (Figures 4 and 5). Parameters with bond lengths,
bond angles, and dihedral angles of the optimized compounds (3 and 4) are listed in Tables S1–S7. The
calculated data of compound 3 were also compatible with X-ray diffraction results as given in Tables S8–S10.
Figure 2. View of the molecular structure of compound 3 with the atom numbering scheme. Displacement ellipsoids
for non-H atoms are drawn at the 30% probability level.
Figure 3. The packing and hydrogen bonding of compound 3, viewed along the axis. H atoms not involved in hydrogen
bonding are omitted.
79
˘
SARIOGLU
et al./Turk J Chem
Table 1. Hydrogen-bond parameters (˚
A, ◦ ) .
N1–H1. . . O3i
C8–H8. . . O3i
C18–H18. . . O3
C22–H22. . . O2i
C13–H13. . . Cg3ii
D–H
0.86
0.98
0.93
0.93
0.93
H. . . A
2.12
2.52
2.33
2.51
2.83
D. . . A
2.947 (3)
3.213 (3)
2.870 (4)
3.194 (4)
3.629 (5)
D–H. . . A
160
127
117
131
145
Symmetry codes: (i) x, 1/2 – y, 1/2 + z; (ii) 2 – x, –1/2 + y, 3/2 – z. Cg3 is a centroid of the C17–C22 benzene ring.
Figure 4. The geometry optimized compound 3 at DFT/B3LYP/SDD basis set in Gaussian09.
Figure 5. PM6 optimized top and side views of the Cu(II) complex compound 4, respectively.
80
˘
SARIOGLU
et al./Turk J Chem
2.4. Antimicrobial and antifungal activity results
The bioassay analysis of N -(3,4-dichlorophenyl)-3-oxo-3-phenyl-2-(phenyl carbonyl) propanamide (3) against
the selected bacterial and fungal cultures did not exhibit any significant activities as given in Table S11.
In quantum mechanical calculations, the calculation of atomic charges in any molecule plays an important
role in molecular systems. In particular, the charge distributions calculated by the natural bond orbital (NBO)
and Mulliken 15 charges for compound 3 are given in Table S12 at the DFT/B3LYP/SDD basis set in this
study. This distribution also has an important influence on the vibrational spectra. In the compound N (3,4-dichlorophenyl)-3-oxo-3-phenyl-2-(phenylcarbonyl) propanamide (3), the Mulliken atomic charge of the
carbon atoms in the neighborhood of C6, C8, and C11 became more positive. This condition of compound
3 demonstrated the direction of delocalization. The natural atomic charges showed more precision with the
changes in the molecular structure than Mulliken’s net charges. The negative charges mainly located on atoms
O9, N10, and C26 will interact with the positive part of any macromolecule-like receptor. These obtained
results are presented in Figure 6. In order to evaluate the sensitivity of the calculated charges of compound 3
to changes in the choice of the basis set and the quantum mechanical method, we compared Mulliken charges
obtained by different basis sets and this is tabulated in Table S13. In addition, Figure 7 shows the results better
in graphical form. We observed that SDD basis set was the most accurate and logical method.
Figure 6. Mulliken’s and natural bond orbital’s charges plot of compound 3.
As mentioned, the vibrational analysis for compound 3 was performed with the same basis set by using
the G09 program to observe and evaluate the effects of the charge distribution results of compound 3. The
optimized compound 3 belonged to the C1 point group. The vibrational assignments were done on the basis
of relative intensities, line shape and the animation option of Gaussview 5.0. When the wavenumber values
81
˘
SARIOGLU
et al./Turk J Chem
were computed at the Hartree–Fock and DFT levels, the obtained results displayed an overestimate of the
fundamental modes against the experimental vibrational modes. Scaling factor values of 0.8929 and 0.9613
have been used for HF/6-31G* and DFT 16 hybrid B3LYP functional 17,18 and SDD basis sets to obtain a
logical better agreement with experimental data, 19 respectively. The scaled wavenumbers and experimental
infrared spectra are displayed in Figure 8.
Figure 7. Comparison of different methods for obtained atomic charges of compound 3.
Amide group vibrations
The most characteristic bands in the spectra of the amide compound are due to the C=O stretching and
N–H stretching vibrations. In the amide compound the C=O stretching vibration and N–H stretching vibration
are located at 1687, 1672, 1537 cm −1 (strong), and 3254 cm −1 , respectively. For this study, B3LYP/SDD
calculation results indicated that the N–H stretching vibration was at 3254 cm −1 for compound 3. The C=O
stretching vibration of amide and ketone groups and the C–H fingerprint region overlapped each other and were
located at about 1686, 1682, and 1547 cm −1 in the theoretical IR spectrum.
Phenyl ring vibrations
There are three benzene rings, R 1 , R 2 , and R 3 , where R 1 is a part of the amide group and R 2 and
R 3 are attached to the carbonyl group of the ketone groups in compound 3. The calculated wavenumbers
for the C–H stretching modes were at 3065 cm −1 and have been matched with the experimental IR spectrum
(3062 cm −1 ). Vibrations involving C–H in-plane bending were found throughout the region 1600–997 cm −1 .
The computed bands at 1595 and 989 cm −1 were due to semicircle stretching, and were well matched with
experimentally observed bands at 1593 cm −1 and 987 cm −1 in the IR spectrum. The dominant H–C=C inplane bending of the R 1 , R 2 , and R 3 rings was calculated to be at 1612 and 1402 cm −1 and corresponded to
82
˘
SARIOGLU
et al./Turk J Chem
the peaks at 1609 and 1392 cm −1 in the IR spectrum. The C–H wagging mode started appearing from 680
cm −1 , had contributions up to 677 cm −1 , and was well assigned in both of the spectra. For ortho substituted
benzenes, the C–Cl bending vibrations were also assigned 815 cm −1 in the theoretical IR spectrum and 816
cm −1 in the experimental IR spectrum.
Figure 8. The scaled wavenumbers and experimental infrared spectra of compound 3.
C=O group vibrations
The appearance of strong bands in the IR spectrum at around 1650–1800 cm −1 in aromatic compounds
refers to the presence of the carbonyl group and is due to the C=O stretching motion. The wavenumber of the
83
˘
SARIOGLU
et al./Turk J Chem
stretch due to the carbonyl group mainly depends on the bond strength, which in turn depends upon inductive,
conjugative, field, and steric effects. The C=O stretching vibrations appeared as strong bands at 1686, 1682,
and 1547 cm −1 in the theoretical study. The bands in the experimental IR spectrum were located at 1687,
1672, and 1537 cm −1 , respectively.
Furthermore, molecular electrostatic potential surface (MEPS) and HOMO–LUMO gap were computed to
probe the electron density of compound 3, prior to formation of the complex compound 4 in the study. MEPS
provides a visual method to investigate the correlation between molecular structure and the physiochemical
property relationship of molecules such as biomolecules and drugs, 20−26 and to understand sites for electrophilic
and nucleophilic reactions like hydrogen bonding interactions. 27,28
In the present study, the MEPS at the DFT/B3LYP/DD optimized geometry was calculated to predict
reactive sites of electrophilic and nucleophilic attacks for compound 3. The MESP map in the case of compound
3 suggested the potential distribution between carbonyl oxygen atoms (dark red) and nitrogen atoms of amide
(dark blue). In the other words, the negative regions (red and yellow) of the MEPS show electrophilic reactivity
and the positive (blue) regions nucleophilic reactivity (Figure 9). From the MEPS, it was evident that the
negative charge covered the carbonyl oxygen and chloro groups and the positive region was over the nitrogen
atom of the amide group. The more electronegativity in the carbonyl oxygen of amide group made it the most
reactive part in compound 3.
Figure 9. Molecular electrostatic potential map calculated at B3LYP/SDD level for compound 3.
Additionally, the HOMO–LUMO gap helped us to determine the chemical reactivity and kinetic stability
of compound 3. A high chemical reactivity of a molecule is generally mentioned with a small HOMO–LUMO
gap, which is more polarizable and has low kinetic stability. Molecules having these properties are also known
as soft molecules. 29
As stated above, accurate and reliable results can be obtained computationally using several wave function
methods such as the second Møller–Plesset perturbation theory (MP2) to examine the band gap and other
properties of compound 3. The HOMO–LUMO gap was used to characterize the conjugated molecule such as
the compound N -(3,4-dichlorophenyl)-3-oxo-3-phenyl-2- (phenylcarbonyl) propanamide (3) at DFT/B3LYP/
DD and MP2/6-31G* level in G09. The 3D plots of HOMO and LUMO figures for compound 3 are shown
in Figure 10. The HOMO–LUMO gap energy for each method was 4.476 and 10.671 eV, respectively. These
84
˘
SARIOGLU
et al./Turk J Chem
numerical values were also responsible for the bioactive property of compound 3. These values also validated
the antimicrobial and antifungal activity results of this study.
Figure 10. LUMO and HOMO plots of compound 3 at DFT/B3LYP/SDD and MP2/6-31G* level.
After compound 3 was examined, we focused on the complex compound 4 in this part of the study.
The complex compound 4 was computed to be square planar at the carboxamide moiety. However, the
dichloro phenyl and phenoxy substituents were oriented perpendicular to the main plane and had almost parallel
positioning to one another to minimize the steric effects. The phenyl substituents were oriented almost vertical
to the main plane. The most stable ground state structure was obtained (Figure 5).
The geometry optimized structures and the Mulliken charge distributions, which are important parameters for compound 4, are shown in Figures 5 and 11, respectively. Figure 11 indicates a representative charge
distribution in the complex compound 4. The net charge on Cu is 1.256, being lower than the formal charge
+2 in Figure 11. This state shows that compound 3 (ligand) transferred its negative charges to Cu(II) ions
during formation of the complex compound 4. All donor atoms of compound 3 also possessed negative charge
development. Therefore, the results of geometry optimization and atomic charge showed that there was good
agreement between the theoretical and experimental data of the complex compound 4. The Supplementary
Material part also includes detailed information about it in Table S14.
In this part of the study, we explain the biochemical differences among copper, nickel, and zinc complexes.
For this purpose, we tried to reveal the biochemical activities of Cu(II), Zn(II), and Ni(II) complex compounds.
Firstly, geometrically optimized structures of complex compounds 4–6 were obtained at PM6 level of semiempirical basis set in G09 (Figure 12). Additionally, quantum chemical descriptors, 30−33 molecular dipole moment
85
˘
SARIOGLU
et al./Turk J Chem
Figure 11. Mulliken charge distributions for compounds 3 and 4.
Figure 12. Molecular structures of Cu(II), Ni(II), and Zn(II) coordination complex compounds 4–6.
(µ), energies of the HOMO and LUMO (E HOM O , E LU M O ), ionization potential (IP), electron affinity (EA),
chemical hardness ( µ), softness (S), chemical potential (µ), electronegativity ( χ) , and electrophilicity index
(ω) were used to elucidate some unexplained questions in the experimental part of this study. The obtained
structural and electronic information from theoretical calculations at the level of PM6 are shown in Table 2.
Furthermore, previous studies 33−35 confirmed electrophilicity index as a possible descriptor of biological activity for different chemical structures. In this study, we focused on the quantum chemical descriptors of the
investigated complex compounds (4–6), because these descriptors helped us to achieve a deeper understanding
of the structure activity relationship of the complex compounds 4–6, without the absence of their activity val86
˘
SARIOGLU
et al./Turk J Chem
ues. The obtained results indicated that the Cu(II) complex compound has the highest electrophilicity value in
all different metal complex compounds, and the mentioned compound (4) has higher reactivity and biological
activity than the others.
Table 2. Semiempirical theory based descriptors of the metal complex compounds 4–6 in G09.
No.
1
2
3
Comp.
4
5
6
(D)
33.054
3.870
4.147
HOMO (eV)
–0.27732
–0.32315
–0.34883
LUMO (eV)
–0.06864
–0.03879
–0.03527
(IP)
0.27732
0.32315
0.34883
(EA)
0.06864
0.03879
0.03527
(η)
0.10434
0.14218
0.15678
(S)
9.58405
7.03334
6.37836
(χ)
–0.17298
–0.18097
–0.19205
(µ)
0.17298
0.18097
0.19205
(ω)
0.14339*
0.11517
0.11763
*Symbol shows the higher biological activities among all compounds. Comp.: compound; D: Molecular dipole moment;
I: Ionization potential; EA: Electron affinity; η : Chemical hardness; S: Softness; χ : Electronegativity; µ : Chemical
potential; ω : Electrophilicity index; Std: Standard.
Consequently, the new N -carboxamide compound 3 and the complex compound 4 were probed by
using three stages. In the first stage, they were synthesized and characterized with several techniques. The
second stage was used to examine the crystal of the proposed structure 3 not the complex compound 4, which
was in powder state. In the last stage, computational calculations at semiempirical/PM3, HF/6-31G*, and
DFT/B3LYP/SDD levels were applied to obtain the optimized three-dimensional geometry of compound 3.
These calculations showed that the DFT/B3LYP/SDD basis set was the most significant and compatible with
experimental and X-ray data. It was also observed as the most reactive part in compound 3 with the help of
MEPS and HOMO–LUMO energy gap results. At the same time, the complex compound 4 was optimized at
semiempirical/PM6 level. The structure and shape of the copper complex compound 4 were confirmed with the
help of the results of the Mulliken charge distribution, IR spectra, and magnetic moment value of the complex
compound 4. Moreover, these results will be helpful for the design and synthesis of new carboxamide derivatives
and complexes.
3. Experimental
3.1. Chemicals and instrumentation
All chemicals and solvents were purchased from commercial suppliers. The electronic spectrum was recorded
on a UV-PG Instruments T80+ UV/Vis spectrometer. The UV pattern was recorded from a 1 × 10 −3 molar
solution of compounds 3 and 4 dissolved in DMF. The IRν ATR spectrum was obtained by PerkinElmer FTIR/FIR spectrometer between 4000 and 100 cm −1 (Gaziantep GU, Chemistry Laboratory, Turkey). APT
and 1 H NMR spectra for the new N -carboxamide compound 3 were obtained with a 400 NMR-PerkinElmer
spectrometer using DMSO-d 6 (Gaziosmanpa¸sa GOU, Chemistry Laboratory, Turkey). All chemical shift values
were recorded as δ (ppm). Melting point was measured on an electrothermal apparatus. Elemental analysis
results were found to be in good agreement with the calculated data of the mentioned compounds.
3.2. Reactions
3.2.1. Synthesis of compound 3
For the synthesis of N -(3,4-dichlorophenyl)-3-oxo-3-phenyl-2-(phenylcarbonyl) propanamide (3) (Scheme), a
mixture of (1 mmol) dibenzoylaceticacid-N -carboxyethylamide (1) and (1 mmol) 3,4-dichloroaniline (2) was
stirred at 150 ◦ C for 3 h in 20 mL of toluene. The solvent was evaporated to dryness and (50 mL) diethyl
ether was added to the residue. The solid was filtered, and washed with cold ethanol and diethyl ether. The
87
˘
SARIOGLU
et al./Turk J Chem
pure compound was obtained by recrystallization from n-butanol. White solid, yield: 79%; mp: 193–196
UV-Vis (DMF) λmax nm (log ε): 315.00 (1.737), 270.00 (2.100). IR ν ATR (cm
−1
C–H arm); 1687, 1672, 1537 (str, C=O), 1593–1448 (m, C=C), 816 (s, Ph–Cl).
1
◦
C.
) : 3254 (m, N–H); 3062 (m,
H NMR (400 MHz, DMSO):
δ = 3.40 (1H, C–H), 6.74–8.20 (ArH, m, 13H), 10.73 (1H, s, N–H). APT NMR (100 MHz, DMSO): δ = 64.88,
119.67, 120.78, 125.74, 127.90, 128.86, 129.34, 129.56, 131.37, 131.64, 134.49, 136.00, 139.10, 164.73, 192.75.
Chemical formula: C 22 H 15 Cl 2 NO 3; Molecular weight: 411.04; LC-MS/MS (m/z): 413.3 [M + 2H] + ; Anal.
Calc. for C 22 H 15 Cl 2 NO 3 (%): C, 64.09; H, 3.67; N, 3.40. Found (%): C, 64.32; H, 3.69; N, 3.49.
3.2.2. Synthesis of the complex compounds 4–6
The complexes 4–6 were prepared from 206 mg (0.5 mmol) of protonated ligand (3) (C 22 H 15 Cl 2 NO 3 ) dissolved
in CHCl 3 /CH 3 OH (20/10 mL) and 50, 55, and 62 mg (0.25 mmol) of three metal salts [Cu(CH 3 COO) 2 .H 2 O,
Zn(CH 3 COO) 2 .2H 2 O, and Ni(CH 3 COO) 2 .4H 2 O] dissolved in a chloroform and methanol mixture, respectively. Cu(II) complex 4 was only carried out in this condition. This case was explained by means of computational techniques. The complex compound 4 was filtered off, washed with methanol and diethylether, and
dried in vacuo. Green color powder, yield (81%), mp: 233 ◦ C (decomposition began at value greater than
233
◦
C. UV-Vis (DMF) λmax nm (log ε): 315 (1.227), 270 (0.932). IR ν ATR (cm −1 ) : 3028 (br, C–H arm);
1617 (str, C=O); 1593–1448 (m, C=C), 1513 (str, C=N); 811 (s, Ph–Cl); µef f : 1.82 B.M. Chemical formula:
C 44 H 28 Cl 4 CuN 2 O 6; Molecular weight: 886.06; Anal. Calcd. For C 44 H 28 Cl 4 CuN 2 O 6 (%): C, 59.64; H, 3.19;
N, 3.16. Found (%): C, 59.2; H, 3.14; N, 3.22.
O
O
O
O
O
Toluene
Ph
N
H
Ph
OC2H5
Cl
H2 N
+
OH
150 oC, 3h
(-C3H7NO2)
Cl
1
Ph
N
H
Ph
O
Cl
3
2
Methanol
Cu(CH3COOH)2H2O
H
O
O
Ph
N
Ph
O
Cl
Cu
Cl
O
Cl
Ph
Ph
N
Cl
O
O
4
H
Scheme. The route for the synthesis of compounds 3 and 4.
88
Cl
˘
SARIOGLU
et al./Turk J Chem
3.3. X-ray crystallography
X-ray diffraction data were obtained at 296 K on a Bruker Kappa APEXII CCD diffractometer equipped with
˚). The structure was solved by direct methods using
graphite monochromated Mo-Kα radiation (λ = 0.71073 A
SHELXS-97 36 and refined by full matrix least-square on F 2 (SHELXL-97 36 ) using anisotropic displacement
parameters for all nonhydrogen atoms. All H atoms were positioned geometrically and refined by using a riding
model, with N–H = 0.86 ˚
A, C–H = 0.93 and 0.98 ˚
A, and U iso (H) = 1.2U eq (C, N). Figures were drawn using
Table 3. Crystal data and structure refinement for compound 3.
Chemical formula
Mr
Crystal system, space group
Temperature (K)
a, b, c (˚
A)
µ (◦ )
V (˚
A3 )
Z
F (000)
Dx (Mg m−3 )
Radiation type
No. of reflections for cell measurement
θ range (◦ ) for cell measurement
µ (mm−1 )
Crystal shape
Color
Crystal size (mm)
Diffractometer
Radiation source
Monochromator
Scan method
Absorption correction
Tmin , Tmax
No. of measured, independent and observed
[I > 2σ (I)] reflections
Rint
θ values (◦ )
(sin θ/λ)max (˚
A−1 )
Range of h, k, l
Refinement on
R[F 2 > 2σ(F 2 )], wR (F 2 ), S
No. of reflections
No. of parameters
No. of restraints
H-atom treatment
Weighting scheme
(∆/σmax
˚−3 )
∆⟩max , ∆⟩min (e A
C22 H15 Cl2 NO3
412.25
Monoclinic, P 21 /c
296
9.7704 (13), 22.185 (3), 9.4324 (11)
105.685 (5)
1968.4 (4)
4
848
1.391
Mo Kα
266
3.3–21.6
0.35
Prism
Blue
0.35 × 0.25 × 0.22
Bruker Kappa APEXII CCD diffractometer
Fine-focus sealed tube
Graphite
ω scans
Multiscan (SADABS ; Bruker, 2005)
0.900, 0.925
15,278, 3845, 2215
0.047
θmax = 26.0, θmin = 1.8
0.617
h = –8→12, k = –27→27, l = –11→10
F2
0.054, 0.136, 1.02
3845
253
0
H-atom parameters constrained
w = 1/[σ 2 (Fo2 ) + (0.0426P )2 + 1.0932P ] where
P = (Fo2 + 2Fc2 )/3
< 0.001
0.54, –0.59
89
˘
SARIOGLU
et al./Turk J Chem
the programs PLATON 37 and ORTEP-3. 38 Details of the data collection and the refinement process are given
in Table 3.
3.4. Antimicrobial and antifungal activities
Bacillus cereus ATCC 7064, Staphylococcus aureus ATCC 6538, Staphylococcus aureus ATCC 25923, Escherichia coli ATCC 4230, and Micrococcus luteus ATCC 9345 were used as the test microorganisms. In
addition, Candida albicans ATCC 14053, Candida parapsilosis ATCC 22019, and Candida krusei ATCC 6258
were used to test compound 3 against fungal strains. Compound 3 was examined against gram-negative and
gram-positive bacterial and fungal strains as compared to reference compounds, ampicillin and fluconazole,
respectively.
3.5. Computational details
All calculations were performed with the Gaussian09 program 39 using the semiempirical/PM3, HF/6-31G*,
and DFT/B3LYP/SDD basis sets to optimize the structure of the new N -carboxamide compound (3). In
addition, frequency calculations were applied to confirm the structure as minimum points in energy. In order
to do fast and accurate calculations in DFT level, the Stuttgart/Dresden effective core potential basis set
(SDD) 40 was also chosen. 41 Moreover, the geometry optimized structure of the obtained complex compound 4
was calculated at the PM6 basis set of the G09 program. The most accurate results were obtained from highlevel ab initio calculations with extended basis sets. These types of calculations need the highest computational
efforts and are extremely expensive for large molecules containing transition metal elements. On the other hand,
semiempirical calculations are fast but have limited reliability. Actual applications have to balance the required
accuracy against the available computational resources. The semiempirical method PM6 42 has been considered
a practical and effective computational tool, especially for organometallic compounds. The molecular structures
were fully optimized in the gas phase, without symmetry. The harmonic frequencies were also calculated to
ensure that the optimized structures were in a stable ground state.
Furthermore, there are some unexplained questions in the experimental part; for example, what are
the biochemical differences among these complex compounds and so on? Hence molecular modeling of these
mentioned structures was performed at PM6 basis set of semiempirical in G09. All calculations were performed
with the help of a computer equipped with Intel Core 2 Duo E7600 (3.06 GHz) processors and 4 GB of operating
memory.
Acknowledgments
This work was supported by Grant FEF 10.08 financed by Gaziantep Scientific Research Projects. The authors
acknowledged the provision of funds for the purchase of a diffractometer and encouragement by Dr Muhammad
Akram Chaudhary, Vice Chancellor, University of Sargodha, Pakistan.
Supplementary material
CCDC-997477 contains the supplementary crystallographic data for this paper. These data can be obtained
free of charge via or from the Cambridge Crystallographic
Data Centre, 12 Union Road, Cambridge CB2 1EZ, UK; fax: (+44) 1223 - 336 - 033; or e-mail:
90
˘
SARIOGLU
et al./Turk J Chem
References
1. Hranjec, M.; Sovic, I.; Ratkaj, I.; Pavlovic, G.; Ilic, N.; Valjalo, L.; Pavelic, K.; Pavelic, S. K.; Zamola, G. K. Eur.
J. Med. Chem. 2013, 59, 111-119.
2. Strupi, M.; Roatafi, G.; Stables, J. P.; Pruszewski, R. Acta Pol. Pharm. 2009, 66, 155-159.
3. Să
onmez, M. Turk. J. Chem. 2001, 25, 181-185.
4. Panda, C.; Ghosh, M.; Panda, T.; Banerjee, R.; Gupta, S .S. Chem. Commun. 2011, 47, 8016-8018.
5. Singh, A. K.; Balamurugan, V.; Mukherjee, R. Inorg. Chem. 2003, 42, 6497-6502.
6. Noveron,J. C.; Olmstead, M. M.; Mascharak, P. K. Inorg. Chem. 1998, 37, 1138-1139.
7. Raymond, K. N.; Carrano, C. J. Acc. Chem. Res. 1979, 12, 183-190.
8. Bhowan, M. G.; Lanlloo, S. J.; Ramnial, T. Trans. Met. Chem. 2001, 26, 329-332.
9. Millhauser, G. L. Acc. Chem. Res. 2004, 37, 79-85.
10. Fabian, W. F.; Kollenz, G.; Akcamur, Y.; Kă
ok, T. R.; Tezcan, M.; Akkurt, M.; Hiller, W. Monath. Chem. 1992,
123, 265-275.
11. Bhaskare, C.; Hankare, P. P.; J. Indian Chem. Soc. 1995, 72, 585-587.
12. Nishat, N.; Rahis ud-din, Haq, M. M.; Pol. J. Chem. 2003, 77, 1731– 1740.
13. Allen, F. H.; Kennard, O.; Watson, D. G.; Brammer, L.; Orpen, A. G.; Taylor, R. J. Chem Soc. Perkin Trans II:
1987, S1-19.
14. Bernstein, J.; Davis, R. E.; Shimoni, L.; Chang N. L. Angew Chem Int Ed Engl 1995, 34, 1555–1573.
15. Mulliken, R. S. J. Chem. Phys. 1955, 23, 1833–1840.
16. Becke, A. D. J.Chem. Phys. 1993, 98, 5648-5652.
17. Lee, C.; Yang, W.; Parr, R. G. Phys. Rev. B. 1988, 37, 785-789.
18. Hohenberg, P.; Kohn, W. Phys. Rev. B. 1964, 136, 864-871.
19. Foresman, J. B. in: E. Frisch (Ed.), Exploring Chemistry with Electronic Structure Methods: A Guide to Using
Gaussian, Gaussian, Inc., Pittsburg, PA, 1996.
20. Murray, J. S.; Sen, K. Molecular Electrostatic Potentials, Concepts and Applications, Elsevier, Amsterdam, 1996.
21. Alcorta, I.; Perez, J. J. Int. J. Quant. Chem. 1996, 57, 123-135.
22. Scrocco, E.; Tomasi, J. Advances in Quantum Chemistry, ed. P. Lowdin, Academic Press, New York, 1978, 115-143.
23. Luque, F. J.; Orozco, M.; Bhadane, P. K.; Gadre, S. R. J. Phys. Chem. 1993, 97, 9380-9384.
24. Sponer, J.; Hobza, P. Int. J. Quant. Chem. 1996, 57, 959-970.
25. Pathak, R. K.; Gadre, S. R. J. Chem. Phys. 1990, 93, 1770-1773.
26. Gadre, S. R.; Shrivastava, I. H. J. Chem. Phys. 1991, 94, 4384-4390.
27. Scrocco, E.; Tomasi, J. Adv. Quantum. Chem. 1978, 11, 115–193.
28. Luque, F. J.; Lopez, J. M.; Orozco, M. Theor. Chem. Acc. 2000, 103, 343–345.
29. Fleming, I. Frontier Orbitals and Organic Chemical Reactions, John Wiley and Sons, New York, 1976.
30. Parr, R. G.; Szentpaly, L. V.; Liu, S. J. Am. Chem. Soc. 1999, 121, 1922-1924.
31. Maynard, A. T.; Huang, M.; Rice, W. G.; Covell, D. G. Proc. Natl. Acad. Sci. USA, 1998, 95, 11578-11583.
32. Chattaraj, P. K.; Giri, S.; Duley, S. Chem. Rev. 2011, 111, 43-75.
33. Taskin, T.; Sevin, F. J. of Mol. Struc.: Theochem 2007, 803, 61–66.
34. Parthasarathi, R.; Subramanian, V.; Royb, D. R.; Chattaraj, P. K. Bioorg. and Med. Chem. 2004, 12, 5533–5543.
35. Taskin, T.; Sevin, F. Turk. J. Chem. 2011, 35, 481-498.
91
˘
SARIOGLU
et al./Turk J Chem
36. Sheldrick, G. M. Acta. Cryst. 2008, A64, 112–122.
37. Farrugia, L. J. J. Appl .Cryst. 1997, 30, 565-566.
38. Spek, A. L. Acta Cryst. 2009, D65, 148–155.
39. Gaussian 09, Revision C.01, Frisch, M. J.; Trucks, G. W.; Schlegel, H. B.; Scuseria, G. E.; Robb, M. A.; Cheeseman,
J. R.; Scalmani, G.; Barone, V.; Mennucci, B.; Petersson, G. A.; et. al. Gaussian, Inc., Wallingford CT, 2011.
40. Hay, P. J.; Wadt, W. R. J. Chem. Phys. 1985, 82, 270–283.
41. Zhao, J. Y.; Zhang, Y.; Zhu, L. G. J. Mol. Struct. Theochem. 2004, 671, 179–187.
42. Stewart, J. J. P. J. Mol. Model. 2007, 13, 1173-213.
92