Phylostat: a web-based tool to analyze paralogous clade divergence in phylogenetic trees
Bạn đang xem bản rút gọn của tài liệu. Xem và tải ngay bản đầy đủ của tài liệu tại đây (216.83 KB, 7 trang )
Turkish Journal of Biology
/>
Research Article
Turk J Biol
(2021) 45: 667-673
© TÜBİTAK
doi:10.3906/biy-2105-18
Phylostat: a web-based tool to analyze paralogous clade divergence
in phylogenetic trees
Elif ÖZÇELİK, Nurdan KURU, Ogün ADEBALİ*
Molecular Biology, Genetic and Bioengineering, Faculty of Engineering and Natural Sciences,
Sabancı University, İstanbul, Turkey
Received: 11.05.2021
Accepted/Published Online: 29.09.2021
Final Version: 14.12.2021
Abstract: Phylogenetic trees are useful tools to infer evolutionary relationships between genetic entities. Phylogenetics enables not only
evolution-based gene clustering but also the assignment of gene duplication and deletion events to the nodes when coupled with statistical approaches such as bootstrapping. However, extensive gene duplication and deletion events bring along a challenge in interpreting
phylogenetic trees and require manual inference. In particular, there has been no robust method of determining whether one of the
paralog clades systematically shows higher divergence following the gene duplication event as a sign of functional divergence. Here, we
provide Phylostat, a graphical user interface that enables clade divergence analysis, visually and statistically. Phylostat is a web-based
tool built on phylo.io to allow comparative clade divergence analysis, which is available at under an MIT
open-source licence.
Key words: Phylogenetics, paralog, ortholog, divergence, statistics, phylogenetic tree, visualization, vector graphics, web server
1. Introduction
Gene duplication is the primary mechanism in evolution
to innovate new proteins (Long et al., 2003). In his famous
book Evolution by Gene Duplication, Ohno proposed that
after gene duplication, one of the two copies accumulate
mutations, which may lead to the invention of a new gene
(Ohno, 1970). The homologous sequences that are products
of a gene duplication and speciation are known as paralogs
and orthologs, respectively. Gene duplication results in one
of the following scenarios: (i) If both paralogs are selected
and do exist today, it is often that one of the duplicates
conserved the parental function and the other copy
diverged and gained a partial or complete new function
(neofunctionalization); (ii) One of the copies accumulates
mutations and become a functionless pseudogene (nonfunctionalization); (iii) Both duplicates complement each
other’s function and, therefore, are both selected (subfunctionalization) (He and Zhang, 2005). In such a case,
a parental version of the duplicates does not exist. Neofunctionalization and sub-functionalization give rise to an
innovation. Therefore, it is improbable for both paralogs
to conserve the ancestral function. Consequently, two
genes that once shared the same sequence and protein
product are likely to have functionally diverged from each
other due to the nature of evolution where redundancy is
disfavored (Nowak et al., 1997).
Though it is straightforward to establish evolutionary
histories for the gene families with one-to-one relationships,
it is not rare to observe extensive gene duplications for
modular gene families. When the number of duplications
is high, the functional relationships between homologs
become difficult to establish. Despite being widely adopted
terms, orthologs and paralogs might remain insufficient in
distinguishing functionally diverged homologs. Orthology
and paralogy do not necessarily indicate functional
associations; they are yet frequently used as indicators
of functional equivalence and divergence, respectively.
However, further specifications are necessary to uncover
the entire evolutionary relationships between homologous
genes to gain more insight with respect to their function.
Especially between co-orthologs, which are the genes
orthologous to another gene or genes created as a result
of gene duplication after speciation, it might be possible
to further dissect the phylogenetic trees and identify the
common ancestral function between paralogous clades.
Orthologs that are not affected by the accelerated rate
of mutation accumulation are termed primary orthologs
(Lafond et al., 2018). Equivalently, orthologs conserving
the last common ancestral function were termed
isorthologs (Swenson and El-Mabrouk, 2012).
Essential genes are vital for organismal survival and
conserved throughout millions of years of evolution. Loss-
*Correspondence:
This work is licensed under a Creative Commons Attribution 4.0 International License.
667
ÖZÇELİK et al. / Turk J Biol
of-function of those critical genes results in either severe
disease or mortality (Bartha et al., 2018). Gene duplication
and loss events complicate evolutionary history of a
gene. Lineage-specific events result in incomprehensible
functional relationships between co-orthologs (Gabaldon
and Koonin, 2013). However, for genes that are commonly
essential for the organisms under investigation, following
gene duplication, one of the duplicates likely maintains
the ancestral function, whereas the other version is free
to diverge. Purifying selection pressure often acts on only
one of the duplicates because its function is necessary and
sufficient to maintain the fitness. Therefore, it is tempting to
parse lineage specific duplications and reveal the common
function-wise ancestral version of the duplicates, which
potentially conserved the parental function, with the aim
of possibly obtaining functionally equivalent orthologs
across lineages each with independent gene duplications.
Phylogenetic trees are visualized to infer evolutionary
relationships between homologous entities, which can be
genes, proteins, and species. There is a number of tools
for phylogenetic tree visualization. FigTree (http://tree.
bio.ed.ac.uk/software/figtree/) stands out as one of the
popular tools that is locally installed on any operating
system. Dendroscope is another tree visualization tool
that is popular among biologists (Huson and Scornavacca,
2012). Along with command-line tree analysis and
manipulation features, ETE tools (Huerta-Cepas et al.,
2016) also provide a tree visualization platform. This tool
is highly useful especially for aligning the corresponding
features, such as sequences, with the leaves in the tree.
Another visualization tool is embedded in a comprehensive
molecular evolution software MEGA (Kumar et al., 2018).
Phylogenetic visualization feature of MEGA complements
its powerful evolutionary analyses. Finally, there are
installation-free browser-based applications. These tools
are mainly phylogeny.io (Jovanovic and Mikheyev, 2019),
phylo.io (Robinson et al., 2016), icytree.org (Vaughan
2017), iTOL (Letunic and Bork, 2007). Although these
tools provide extensive visualization capabilities, they
do not provide further graphical user interface enabling
further inference capabilities on the trees.
With the current phylogenetic techniques, it is feasible
to infer about the evolutionary process of a gene by
understanding molecular evolution. Here, we developed
Phylostat that allows pairwise comparison of selected
clades and applies phylogenetic tests in the context of
protein sequence comparisons to determine whether
one of the paralogous clades is differentially closer to the
common ancestor.
2. Methods
We have built Phylostat on an existing software, phylo.io
(Robinson et al., 2016). We added functions in javascript
668
to allow multiple node selection, coloring, and tests. The
framework of Phylostat consists of two comparative tests
between two selected clades that are diverged from each
other through gene duplication. The aim of the statistical
test is to estimate whether one of the duplicates potentially
retained the ancestral function or not. If a duplicate
preserves the original function, Phylostat helps the user
to detect which of the duplicate is the one closer to the
ancestor.
2.1. Internal divergence in a clade
After a gene duplication occurs in an extinct organism, one
of the duplicates can diverge throughout generations and
gain a new function. The neofunctionalized paralog might
have gained an essential function, and its absence would
not be favored for survival. In such a case, although the
neofunctionalized version of the two paralogs is diverged
from the “original” one, its divergence can be limited
during speciation. Such phenomena show that although
the paralogs are differentially diverged from the common
ancestor, they did not diverge differentially within the
clade during speciation. To calculate the divergence within
the clade, Phylostat takes the individual branch lengths
and compare the divergence rates within the clade. If inclade divergence between two paralogous clades differs
from each other, one can hypothesize the differential
variation between two paralogs. This criterion differs
from the “pairwise-distance approach”, which is based
on comparing leaf-to-leaf distances within clades that
we previously presented (Adebali et al., 2016). Although
both methods can be used to understand the divergence
during speciation, in case of the existence of outliers
among the branch lengths, our current approach counts
them only once. Phylostat takes all branch lengths in
clades and stores them as a set. It performs t-test to assess
whether two sets of internal distances are different from
each other. Although Student’s t-test provides a powerful
statistic in case the differences are normally distributed
and the variance of two groups is equal, these assumptions
are not always met. Especially, it is reasonable to expect
various type of tree topologies since the tool works on
user-defined trees. By taking this diversity of the trees and
analysis into account, Welch’s t-test and Mann–Whitney U
test are implemented to cover unequal variance and nonnormality of the differences, respectively. The related test
statistic and p value is provided on the webpage. If species
names are defined in the leaves, user can input a regular
expression pattern to identify the unique id (or name)
of the species. When this option is used, the comparison
is made by using the common species between the two
clades, and the branch lengths are updated with respect
to the pruned clades, which only includes the common
species of the two clades in comparison.
ÖZÇELİK et al. / Turk J Biol
2.2. Species sets
If a gene is essential for survival, its loss would result in
a significant cost in fitness. Therefore, species lacking
an essential gene cannot survive. After duplication of an
essential gene which cannot be deleted with no fitness loss,
at least one of the versions of the duplicates must conserve
the original function. After most of the gene duplication
events, a duplicate is pseudofunctionalized and does not
express any protein. For some cases though, the second
non-essential duplicate gains a new function, which
may or may not provide additional evolutionary benefit
to the organism. In such a case, the second gene can be
dispensable for some species. Because of a tolerable absence
of the duplicate, some species lose it with no fitness cost.
Therefore, to test which one of the duplicates is essential
and which is not, the species contents between two clades
should be considered. If a phylogenetic tree contains the
species information, such as taxonomic id, in the name of
the leaves, Phylostat can perform species content analysis.
Users specify a Regex syntax to provide where in the leaf
name the organism information is stored. Phylostat plots
a Venn diagram showing the species content of each clade.
If a clade is superset of the other one, this suggests that
the superset clade is likely be more essential than the other
clade. The differential genome content between two clades
suggests complementarity between two genes; either one
of the duplicates may be sufficient for the species.
When unique identifier of the species is defined by the
user using regular expression patterns, Phylostat applies
the branch divergence tests on the common species only.
When there are multiple genes/proteins belonging the same
species in one clade, Phylostat chooses a representative,
which would be the least diverged leaf based on their
distance to the root. The rationale of this feature is to detect
the least diverged clade and more diverged version in a
single specie lineage might introduce false or undesired
evolutionary signals due to either less or no natural
selection pressure (neo/sub/non-functionalization) or
sequencing errors. This feature is useful for paralogous
sequences in the clade as well as isoforms that are usually
present in the trees generated with sequences obtained
from an online Blast search.
The boxplot was plotted with plotly.js which is licensed
under MIT license. The Venn diagram was drawn with
Highcharts, which can be used for non-commercial
purposes freely. All plots can be downloaded at high
resolution in SVG format. Images can also be downloaded
in noneditable png format for a quick representation.
3. Results
3.1. Gene duplication analysis – test cases
In this section, we exemplified different test cases in order
to illustrate the usage of Phylostat.
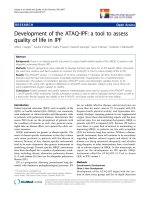
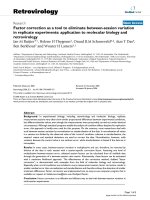
In the first test case, we examined the protein tree of
NPC1 (Figure 1), which is a gene that is associated with
Niemann–Pick disease Type C (Vanier, 2010), a rare
Mendelian disease. Previously we have shown that humans
as well as most other jaw vertebrates have a paralog of this
gene called NPC1L1 (Adebali et al., 2016). Unlike NPC1,
NPC1L1 has no association with any Mendelian disease.
After uploading the tree, we selected two clades with
respect to the two human paralogues they involve, NPC1
and NPC1L1, to evaluate which of the paralogs could be
considered as the function-wise ancestral version. The
test shows that NPC1L1 is internally more diverged than
NPC1 (Figure 1B). Moreover, species sets show that NPC1
clade is a superset of NPC1L1 (Figure 1C) since NPC1
clade has 40 unique species in addition to the 119 common
species in two clades. With the information that Phylostat
provides, it could be inferred that NPC1 is closer to the
function-wise ancestral version of these clades from a
phylogenetic perspective. The p value of the comparative
test is significant, as previously reported (Adebali et al.,
2016).
For further tests on the performance of Phylostat,
some MSAs were simulated using ALF (Dalquen et al.,
2012), which is a tool designed for simulating sequence
evolution by considering various evolutionary forces that
act on genomes such as indels, gene duplication, gene
loss etc. We construct three simulation experiments with
ALF under different mutation, birth, and death rates. To
obtain realistic results, gamma distributed rate variation
among sites is used, and LG is preferred as amino acids
substitution matrix. ALF has more than 60 parameters
to adjust the tree topology, sequence of the root genome,
insertion and deletion rates, duplication rate, etc. We
employed the related parameters depending on our aim
of obtaining duplication node or simulating without any
duplication, but the remaining parameters are taken as 0
(such as genome rearrangement, ratio of translocation and
rate of fission after duplication) or left as default (such as
insertion and deletion rates, gene loss). The resulting trees,
scores, and test statistic values are reported in Figure 2
and Table, respectively. Each of the trees in Figure 2 is a
result of three individual simulations. The first part of the
simulation aims to obtain a gene duplication process. With
the help of increasing the duplication rate to 0.05 from the
default value of 0.0005, we obtain a small tree with a pair
of paralog genes. In these experiments, the number of
proteins that the first organism have is taken as 1, mutation
rate is taken as greater than 1000, birth and death rates are
left as default, which are 0.01, 0.001, respectively. Although
ALF provides alignment, gene and species trees, the gene
tree is ultrametric, which means all leaves are equidistant
from the root, which is not a realistic assumption. By
taking the MSA constructed by ALF, we reproduce a
669
ÖZÇELİK et al. / Turk J Biol
A
B
C
1
NPC1L1
NPC1
intersection
of both
0.5
0
NPC1
NPC1L1
Figure 1. Clade divergence analysis between NPC1 and NPC1L1. (A) Phylogenetic tree of NPC1 (purple) and NPC1L1 (green). Regex
expression, “taxid.[0-9]+” is used to identify unique species. (B) Internal branch length comparison of the clades (see section 2.2).
NPC1L1 clade has higher internal distance values with t value –5.90704 and p value 6.10049e-9. Thus, we can only provide that p value
is smaller than this threshold. (C) Venn diagram shows that NPC1 species set is the superset of NPC1L1 with 40 unique species. There
are 210 leaves in the NPC1 clade and 152 leaves in the NPC1L1 clade.
maximum-likelihood tree by using RAXML-NG (Kozlov
et al., 2019). The second and third scenarios are based on
using the sequence of paralog genes as “root genome” and
modelling the evolution under given ancestral genome.
In these simulations, to produce no duplication node
and paralog-free clades, the duplication rate is taken as 0.
Additionally, the number of resulting species is increased
to 30 to obtain meaningful results for the divergence test.
ALF generates random names for species produced at the
670
end of simulations. Since it is not possible to detect the
common species between two clades, we use the same tree
topology for the second and third simulations. Although
the general topology is the same, the branch lengths are
determined by the mutation rate. By enforcing the tree
topology, we match the species from Clade 1 to Clade 2.
Figure 2 includes some representative results over various
scenarios related to the criteria. The results of superset
criterion are not reported since two clades have the same
ÖZÇELİK et al. / Turk J Biol
A
C
15
10
5
0
Node 1
Node 2
0.5
0
Node 1 Node 2
B
0.5
0
Node 1
Node 2
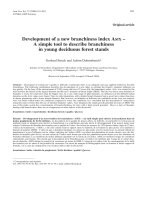
Figure 2. Clade and internal divergence analysis for simulations. The statistical analysis results can be found in Table. (A) The first
scenario covers the case where the first clade is more diverged. (B) The second scenario represents two equally diverged clades. (C) In
the last example, two clades show different trends in terms of divergence rates, like the first one where the second clade is more diverged.
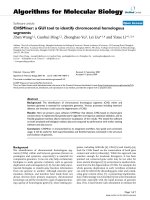
Table. The p values of test statistics for simulated datasets. In
the first simulation, the first clade is internally more diverged
than the second one, and in the third simulation it’s the other
way around. However, as can be seen from the results, the
difference in simulation 1 is more significant than simulation
3, but simulation 3 rejects the null hypothesis. For the second
simulation, the overall divergence of internal distances is not
significantly different for two clades.
DATA
Internal divergence
t-test
Welch’s t-test Mann–Whitney U test
Simulation 1 8.35e-8
8.35e-8
0.0000052
Simulation 2 0.35
0.35
0.40
Simulation 3 0.000071 0.000071
0.00067
number of species and completely overlap for all three
examples.
4. Discussion
Visual interpretation of phylogenetic trees does not yield
the entire evolutionary information regarding the genes,
proteins, or species. In order to lay out the inferred feature
in a statistical context, we presented a web-based tool
allowing manual and automated statistical inference. The
manual part of the software is the choice of the clades
of interest by the user. After users select the clades, the
tool automatically computes the statistical features and
results of the first criteria. The null hypothesis is that
two clades do not diverge differentially from each other.
Phylostat outputs statistical evaluation for rejecting the
null hypothesis.
Each gene has a unique evolutionary history.
Phylogenetic analyses are almost always coupled to
manual inference. The automated approaches limit our
ability to infer protein-specific features. However, we
lack human power to carefully analyze the evolutionary
history of thousands of protein-coding genes. Therefore, it
is important to develop partly automated approaches that
take into account gene-family specific features. If these
features are defined well, it would be possible to develop
automated phylogenetic inference tools. With such tools
in hand, the protein families will be better categorized,
and researchers will be enabled to perform fine-tuned
experiments. With the aim of constructing high-resolution
phylogenetic trees, evolutionary events should be precisely
671
ÖZÇELİK et al. / Turk J Biol
defined. The methods proposed here will be utilized
to test the existence of a function-wise parental copy
of duplicates and, if it exists, to determine which of the
paralogs retained the ancestral function. After thorough
analyses of gene families that are representatives of the
genome in terms of evolutionary history, these methods
can be implemented in a robust pipeline to annotate
evolutionary relationships of homologous sequences. As
of now, Phylostat substantially contributes to the clade
divergence visualization and statistics for a single tree
and single node at once. Users need to be aware of the
gene duplication node and select it for further analysis. It
is not possible to interpret the automated clade-to-clade
comparison for all gene duplication nodes. In the future,
we aim to enhance the tool by adding new features. The
source code of Phylostat is available ( />CompGenomeLab/phylostat), and its repository is open
for contributions. A well-documented repository and
active support unit through GitHub issues are available to
enhance collaborations.
4.1. Suggestions for phylogenetic tree reconstruction
Several approaches to generate phylogenetic trees are as
follows: neighbor joining, maximum parsimony, maximum
likelihood, and Bayesian inference (Horiike, 2016). It has
been shown that the most accurate trees are generated
through maximum likelihood and Bayesian inference
methods (Ogden and Rosenberg, 2006). Although these
two methods are computationally expensive for a precise
analysis such as the ones we illustrated in this study, we
recommend using these accurate methods. We also
recommend users who work on protein sequences to
retrieve one isoform for each gene per taxon. Including
more than one isoform in a phylogenetic tree is irrelevant
and might result in deviating outcomes particularly when
testing the internal divergence with no species name
specified. As the best practice, we recommend including
a unique ID for each genome that gene or protein belongs
to. If species are not defined, tests are performed using
all the leaves, and inclusion of paralogs might result in
redundancy and meaningless comparisons. Taxonomic
ID (NCBI) (Schoch et al., 2020) has been a standard for
these types of comparative genomics studies. Taxonomic
IDs can also be used to label the nodes with intermediate
taxonomic levels, which might give additional insight
into where gene duplication/deletion occurred. Although
bootstrapping requires additional layers of computation
especially for computationally expensive methods such
as maximum likelihood and Bayesian inference, they will
help to assign the duplication nodes confidently.
Acknowledgment/disclaimers/conflict of interest
This work was supported by the EMBO Installation
Grant Award, which is funded by the Scientific and
Technological Research Council of Turkey (TÜBİTAK).
OA is a recipient of the Young Scientist (BAGEP) award
funded by the Science Academy of Turkey. OA is also
supported by TÜBİTAK 2232 Program - International
Fellowship for Outstanding Researchers. We thank Ömer
Karamanlı who implemented our idea in the scope of his
graduation project. We cannot list him as a co-author as
we were unable to reach him to get his approval. We thank
Aylin Bircan for her feedback on the manuscript.
References
Adebali O, Reznik AO, Ory DS, Zhulin IB (2016). Establishing the
precise evolutionary history of a gene improves prediction of
disease-causing missense mutations. Genetics in Medicine 18:
1029-1036.
Bartha I, di Iulio J, Venter JC, Telenti A (2018). Human gene
essentiality. Nature Reviews Genetics 19: 51-62.
Dalquen DA, Anisimova M, Gonnet GH, Dessimoz C (2012). ALF—a
simulation framework for genome evolution. Molecular
Biology and Evolution 29: 1115-1123.
Derrick B, Russ B, Toher D, White P (2017). Test statistics for the
comparison of means for two samples that include both paired
and independent observations. Journal of Modern Applied
Statistical Methods 16: 9.
Gabaldon T, Koonin EV (2013). Functional and evolutionary
implications of gene orthology. Nature Reviews Genetics 14:
360-366.
672
He X, Zhang J (2005). Rapid subfunctionalization accompanied by
prolonged and substantial neofunctionalization in duplicate
gene evolution. Genetics 169: 1157-1164.
Horiike T (2016). An introduction to molecular phylogenetic
analysis. Robotics and Autonomous Systems 4: 36-45.
Huerta-Cepas J, Serra F, Bork P (2016). ETE 3: Reconstruction,
Analysis, and Visualization of Phylogenomic Data. Molecular
Biology and Evolution 33: 1635-1638.
Huson DH, Scornavacca C (2012). Dendroscope 3: An Interactive
Tool for Rooted Phylogenetic Trees and Networks. Systematic
Biology 61: 1061-1067.
Jovanovic N, Mikheyev AS (2019). Interactive web-based visualization
and sharing of phylogenetic trees using phylogeny.IO. Nucleic
Acids Research 47: W266-W269.
Kozlov AM, Darriba D, Flouri T, Morel B, Stamatakis A (2019).
RAxML-NG: a fast, scalable and user-friendly tool for
maximum likelihood phylogenetic inference. Bioinformatics
35: 4453-4455.
ÖZÇELİK et al. / Turk J Biol
Kumar S, Stecher G, Li M, Knyaz C, Tamura K (2018). MEGA X:
Molecular Evolutionary Genetics Analysis across Computing
Platforms. Molecular Biology and Evolution 35: 1547-1549.
Lafond M, Meghdari Miardan M, Sankoff D (2018). Accurate
prediction of orthologs in the presence of divergence after
duplication. Bioinformatics 34: i366-i375.
Letunic I, Bork P (2007). Interactive Tree Of Life (iTOL): an
online tool for phylogenetic tree display and annotation.
Bioinformatics 23: 127-128.
Ohno S (1970). Evolution by gene duplication. Allen & Unwin;
Springer-Verlag, London, New York.
Robinson O, Dylus D, Dessimoz C (2016). Phylo.io: Interactive
Viewing and Comparison of Large Phylogenetic Trees on the
Web. Molecular Biology and Evolution 33: 2163-2166.
Schoch CL, Ciufo S, Domrachev M, Hotton CL, Kannan S et al.
(2020). NCBI Taxonomy: a comprehensive update on curation,
resources and tools. Database (Oxford) 2020: 1-21.
Long M, Betran E, Thornton K, Wang W (2003). The origin of new
genes: glimpses from the young and old. Nature Reviews
Genetics 4: 865-875.
Swenson KM, El-Mabrouk N (2012). Gene trees and species trees:
irreconcilable differences. BMC Bioinformatics 13 Suppl 19:
S15.
Nowak MA, Boerlijst MC, Cooke J, Smith JM (1997). Evolution of
genetic redundancy. Nature 388: 167-171.
Vanier MT (2010). Niemann-Pick disease type C. Orphanet Journal
of Rare Diseases 5: 16.
Ogden TH, Rosenberg MS (2006). Multiple sequence alignment
accuracy and phylogenetic inference. Systematic Biology 55:
314-328.
Vaughan TG (2017). IcyTree: rapid browser-based visualization for
phylogenetic trees and networks. Bioinformatics 33: 23922394.
673