Classification of bladder cancer cell lines according to regulon activity
Bạn đang xem bản rút gọn của tài liệu. Xem và tải ngay bản đầy đủ của tài liệu tại đây (3.19 MB, 17 trang )
Turkish Journal of Biology
Turk J Biol
(2021) 45: 656-666
© TÜBİTAK
doi:10.3906/biy-2107-72
/>
Research Article
Classification of bladder cancer cell lines according to regulon activity
1,2
1
Aleyna ERAY , Serap ERKEK-ÖZHAN
İzmir Biomedicine and Genome Center, İzmir, Turkey
2
Dokuz Eylül University İzmir International Biomedicine and Genome Institute, İzmir, Turkey
1
Received: 26.07.2021
Accepted/Published Online: 18.11.2021
Final Version: 14.12.2021
Abstract: Bladder cancer is one of the most frequent cancers and causes more than 150.000 deaths each year. During the last decade,
several studies provided important aspects about genomic characterization, consensus subgroup definition, and transcriptional
regulation of bladder cancer. Still, much more research needs to be done to characterize molecular signatures of this cancer in depth. At
this point, the use of bladder cancer cell lines is quite useful for the identification and test of new signatures. In this study, we classified
the bladder cancer cell lines according to the activities of regulons implicated in the regulation of primary bladder tumors. Our regulon
gene expression-based classification revealed three groups, neuronal-basal (NB), luminal-papillary (LP), and basal-squamous (BS).
These regulon gene expression-based classifications showed a quite good concordance with the consensus subgroups assigned by the
primary bladder cancer classifier. Importantly, we identified FGFR1 regulon to be involved in the characterization of the NB group,
where neuroendocrine signature genes were significantly upregulated, and further β-catenin was shown to have significantly higher
nuclear localization. LP groups were mainly driven by the regulons ERBB2, FOXA1, GATA3, and PPARG, and they showed upregulation
of the genes involved in epithelial differentiation and urogenital development, while the activity of EGFR, FOXM1, STAT3, and HIF1A
was implicated for the regulation of BS group. Collectively, our results and classifications may serve as an important guide for the
selection and use of bladder cancer cell lines for experimental strategies, which aim to manipulate regulons critical for bladder cancer
development.
Key words: Bladder cancer, classification, regulon, gene regulation, neuroendocrine
1. Introduction
Bladder cancer is a heterogeneous group of tumors, where
transitional cell carcinoma constitutes the great majority
of the cases. Classically, bladder cancer is diagnosed in
two histopathological classes as ‘muscle invasive bladder
cancer (MIBC)’ and ‘non-muscle invasive bladder cancer
(NMIBC)’ with different prognostic and molecular
characteristics (Jin et al., 2014). In the last decade, there
have been a number of studies characterizing the genomic
landscape of both MIBC and NMIBC and defining the
molecular subgroups (Cancer Genome Atlas Research
2014; Hedegaard et al., 2016; Robertson et al., 2017; Tan
et al., 2019). A more recent study aimed to define the
consensus subgroups of MIBC using the gene expression
data in combination with several studies (Kamoun et
al., 2020), where the six consensus subgroups were
referred to as ‘luminal papillary’, ‘luminal nonspecified’,
‘luminal unstable’, ‘stroma-rich’, ‘basal/squamous’, and
‘neuroendocrine-like’. In this study, the authors, in
addition, associated these subgroups with distinct regulon
activities, previously defined in (Robertson et al., 2017).
These regulons implicated in bladder carcinogenesis
include transcription factors and growth factor receptors,
determined according to their gene regulatory activity in
bladder cancer (Robertson et al., 2017).
Bladder cancer cell lines have been extensively used
for modeling the development, progression and molecular
characteristics of bladder cancer. In addition to the focused
characterization of cell lines, where only two/three of them
are used (Piantino et al., 2010; Pinto-Leite et al., 2014),
there are a few other studies, which provided details about
the molecular and genomic characterization of bladder
cancer cell lines collectively. In one study, a classification
based on the subgroups defined by (Sjodahl et al., 2012),
‘“Urobasal A”, “Urobasal B”, “Genomically Unstable”and
“SCC-like” were established for 40 bladder cancer cell
lines (Earl et al., 2015). Another study performed exome
sequencing for 25 bladder cancer cell lines and identified
the frequently mutated genes among analyzed cell lines
(Nickerson et al., 2017). A more recent study provided a
comprehensive review about molecular characteristics,
origin, and tumorigenic properties of more than 150
*Correspondence:
656
This work is licensed under a Creative Commons Attribution 4.0 International License.
ERAY and ERKEK ÖZHAN / Turk J Biol
murine and human bladder cancer cell lines (Zuiverloon et
al., 2018). In addition, the Cancer Cell Line Encyclopedia
of the Broad Institute (CCLE database) provides a unique
source for the transcriptomic and genomic data produced
in a variety of cancer cell lines including bladder cancer
(Barretina et al., 2012).
Although regulon activities have been significantly
associated with primary bladder cancer subgroups
(Robertson et al., 2017; Kamoun et al., 2020), there has not
been yet a study, which characterized the bladder cancer
cell lines according to regulon activities defined for the
primary bladder cancers (Robertson et al., 2017; Kamoun
et al., 2020). In this study, we classified the bladder cancer
cell lines into 3 groups according to their regulon activities
and associated the upregulated genes in each cell line
group with the targets of the regulons. Our results reveal
previously unknown cooperative regulatory activities in
bladder cancer cells and can serve as a guide for modeling
bladder cancer according to different regulon activities.
2. Methods
2.1. Experimental methods
2.1.1. Cell culture
The two bladder cancer cell lines 5637 and RT112 were
obtained from DSMZ and J82 was kindly provided by
Dr. S. Senturk (Izmir Biomedicine and Genome Center,
Izmir). 5637 and RT112 were cultured in RPMI 1640
(Gibco BRL), J82 was cultured in DMEM (Dulbecco’s
Modified Eagle Medium). All media were supplemented
with %10 FBS and %1 Penicillin-Streptomycin. Cells were
cultured at 37 °C and 5% CO2.
2.1.2. Immunofluorescence
In 24 well plates, J82 was plated 10000/well, RT112 was
plated 20000/well, 5637 was plated 40000/well. Cells
were incubated overnight on glass coverslips and rinsed
with 1x PBS the following day. Cells were fixed with 4%
formaldehyde for 15 min at RT, and 0.2% TritonX was
used for permeabilization. Fixed cells were blocked with
2% Donkey serum for 45 min. Afterwards, cells were
incubated with β-catenin antibody (1:100, #9562, Cell
Signaling) diluted in 2% donkey serum overnight at 4°C.
Next day, cells were rinsed 2 times with 1x PBS. Goat
Anti-Rabbit Alexa Fluor 594 was used as a secondary
antibody. DAPI was used for nucleus staining. Coverslips
were mounted onto slides for imaging with Zeiss LSM880.
Images were acquired as Z-stack using ZEN 2 software.
Images with maximum intensity were used for further
analysis. Quantification of the images were done with
ImageJ program. Splitted DAPI channel images were used
to determine region of interests for nuclear β-catenin
signal intensities. A total of 17 cells per cell line were used
for quantification. Integrated Density Values (IDV) were
used for statistical analysis.
2.2. Data acquisition
CCLE RNAseq gene expression data for bladder cancer
cell lines (RPKM) were downloaded from Cancer Cell Line
Encyclopedia (CCLE) database (Barretina et al., 2012) and
were accessed at cbioportal (Cerami et al., 2012; Gao et al.,
2013). Regulon definitions were based on (Robertson et
al., 2017; Kamoun et al., 2020). Mutation data for bladder
cancer cell lines were obtained using cbioportal (Cerami et
al., 2012; Gao et al., 2013). Neuroendocrine differentiation
gene definitions are based on the information provided in
Supplementary Table 3 from (Kamoun et al., 2020).
2.3. Data analysis
2.3.1. Clustering of the cell lines according to regulon expression levels
Using the gene expression values for the regulon genes, we
clustered 25 bladder cancer cell lines using kmeans option
(k = 6), within pheatmap package (Kolde 2019). Only the
regulons that have min 1 rpkm (log2 scale) expression
value in at least one cell type analyzed were included in
clustering. This resulted in 19 number of regulons which
contributed to the clustering analysis.
2.3.2. Consensus classification of bladder cancer cell lines
In order to determine the consensus classification of bladder
cancer cell lines, we utilized the “Molecular Classification
of Bladder Cancer” classifier developed by Kamoun
et al., (Kamoun et al., 2020) (134.157.229.105:3838/
BLCAclassify). Gene expression matrix for the cell lines
in rpkm (obtained from CCLE database (Barretina et
al., 2012)) was uploaded to the classifier and resulting
consensus classifications are presented in Figure 1b and
Supplementary Table S1.
2.3.3. Differential gene expression analysis
Differential gene expression analysis, where one cell
line group was compared with the other groups, was
performed using cbioportal (Cerami et al., 2012; Gao et
al., 2013). Basically, custom cell line groups were formed
based on our classifications (Figure 1), and differentially
expressed genes were identified using ‘Compare’ and
‘mRNA’ options. Upregulated genes were defined using q
value threshold of 0.1 and log Ratio of 0.5.
2.3.4. Gene ontology analysis and visualization
Gene ontology analysis for the upregulated gene sets was
performed using the ConsensusPathDB (CPDB) database
of Max Planck Institute (Kamburov et al., 2009; Kamburov
et al., 2011). Overrepresentation function of the CPDB
was used, and only Level 4 GO terms (Biological Process)
were included for further analysis. “GOChord” function
of “GOplot” R package was used for visualization (Walter
et al., 2015). In chord graphs, maximum top 20 GO
terms with adjusted p-value <0.05 were shown. For the
limit parameter of the “GOChord” function, a minimum
number of genes belonging to a specific GO term was
657
ERAY and ERKEK ÖZHAN / Turk J Biol
b
a
Neuronal-Basal
(NB)
Luminal-Papillary
(LP)
Basal-Squamous
(BS)
6
Cluster: 1 Size: 3
AR, GATA6, RARB
5
4
3
Cluster: 2 Size: 1
2
FGFR1
1
Cluster: 3 Size: 4
EGFR, FOXM1,
STAT3 HIF1A
Cluster: 4 Size: 4
FGFR3, ERBB3,
TP63 FOXA1
Cluster: 5 Size: 5
RARG, RXRA,
ERBB2 KLF4,
RARA
Cluster: 6 Size: 2
PPARG, GATA3
Cell Lines
Consensus Class
253JBV
NE-like
253J
NE-like
5637
Ba/Sq
639V
NE-like
647V
Ba/Sq
BC3C
Ba/Sq
BFTC905
Ba/Sq
CAL29
Ba/Sq
HT1197
Ba/Sq
HT1376
Ba/Sq
J82
Ba/Sq
JMSU1
NE-like
KMBC2
LumP
KU1919
Ba/Sq
RT112
LumP
RT4
LumP
SCABER
Ba/Sq
SW1710
Ba/Sq
SW780
LumP
T24
Ba/Sq
TCCSUP
Ba/Sq
SCABER
647V
VMCUB1
KU1919
BFTC905
HT1376
UBLC1
5637
T24
HT1197
KMBC2
CAL29
SW780
RT112
UMUC1
RT4
SW1710
253JBV
UMUC3
639V
253J
BC3C
TCCSUP
J82
JMSU1
UBLC1
Ba/Sq
UMUC1
LumP
UMUC3
NE-like
VMCUB1
Ba/Sq
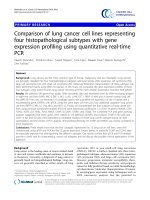
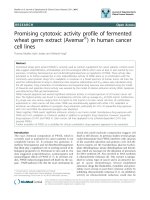
Figure 1. Clustering of bladder cancer cell lines according to regulon expressions (a) Heatmap visualization for the k-means clustering
(k = 6) of regulon expressions in bladder cancer cell lines. Three cell line groups were represented as follows: the first group defined
as Neuronal-Basal (NB), the second group defined as Luminal-Papillary (LP), the third group defined as Basal-Squamous (BS). (b)
Consensus class assigned to bladder cancer cell lines. The table shows the consensus classes of the cell lines (output from the classifier
for muscle invasive bladder cancer (Kamoun, et al. 2020).
determined as 5 if the number of the genes in upregulated
gene set was >100, otherwise the number was set as 4 genes
minimum. Genes, which are linked with at least 4 different
GO terms, were displayed on the plots together with their
logFC value representations.
2.3.5. Association of differentially expressed genes with
the target genes of regulons
Regulon – target gene association table was downloaded
from (Robertson et al., 2017) (Table S2.25) (Robertson et
al., 2017). Genes, which are positively associated with the
regulons (having value=1), were referred to as the target
of the respective regulons. Afterwards, upregulated genes
for each cell line group were intersected with the targets
of the regulons and the results were presented as percent
intersection rate (Figure 2).
2.4. Statistical analysis
Statistical analyzes were performed utilizing the R/
Bioconductor packages (www.bioconductor.org). ANOVA
was used to check the statistical difference among the
groups for Figures 3a, 4a, 5a, and Supplementary Figure
658
S2. Subsequently, Bonferroni post-hoc test was applied
to the results of ANOVA test. Spearman correlation test
was applied for Figures 3c, 3d, 4c, 4d, and 5b. Dunnett’s
multiple comparisons test was used for statistical analysis
of the immunostaining images (Figure 6b).
3. Results
3.1. Grouping of bladder cancer cell lines according to
regulon activity
We determined the expression of the regulon genes in
25 bladder cancer cell lines and classified these cell lines
according to the expression profile of the regulon genes.
Our unsupervised clustering analysis using kmeans (k =
6) clustered the bladder cell lines into 3 groups (Figure
1a). In order to find out to what extent our regulon-based
classifications are legitimate, we additionally classified the
cell lines using the consensus classifier algorithm provided
in (Kamoun et al., 2020). This analysis identified 5 out of 9
cell lines in group 1 to be assigned to neuroendocrine-like
subgroup; 6 out of 6 cell lines in group 2 were identified to
ERAY and ERKEK ÖZHAN / Turk J Biol
in BS class. Regulon cluster 5, driven by luminal-papillary
markers RARG, RXRA (Kamoun et al., 2020) and basal
marker KLF4 (Kamoun et al., 2020) was relatively enriched
in LP class, with partial enrichments in NB and BS classes.
Regulon cluster 3, dominated by the basal markers, EGFR,
FOXM1, STAT3 ,and HIF1A (Kamoun et al., 2020) were
similarly enriched in all cell line groups.
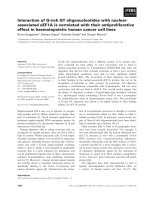
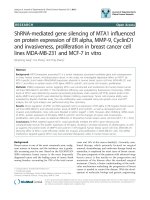
Figure 2. Concordance of upregulated genes in cell line groups
with regulon targeting. Percentages of NB and LP upregulated
genes intersecting with regulon target genes. Intersection rates
are displayed from red to green (red: high, green: low).
belong to luminal papillary and 10 out of 10 cell lines in
group 3 as basal-squamous (Figure 1b). Among the group
1 cell lines, one cell line (J82) had almost equal annotation
scores (0.383 vs 0.385) for neuroendocrine-like and basal
squamous classes, and, for two of the cell lines (SW1710
and TCCSUP), annotation scores were rather close as well
(Supplementary Table S1). Therefore, we named the group
1-3 as ‘neuronal-basal (NB)’, ‘luminal papillary (LP)’ and
‘basal squamous (BS)’, respectively.
Although luminal and basal terms are classically used
for bladder cancer cell lines (Choi et al., 2014; Zuiverloon
et al., 2018), our regulon expression-based analysis here
brought additional features, characteristics of each group.
Our analysis revealed that the expression status of FGFR1,
which is highly enriched in ‘stromal-rich’ subgroup in
consensus classification of bladder cancer (Kamoun et al.,
2020), mainly separates the NB group from the two other
groups. The regulon cluster 4 driven by the expression of
FGFR3, ERBB3, TP63, and FOXA1 was mainly enriched
for LP class; regulon cluster 6 constituted by PPARG and
GATA3 expression was enriched in LP class and partially
3.2. Differential gene expression in bladder cell line
groups and association with regulon activity
For each of the 3 groups, we determined with the clustering
analysis (Figure 1a), we performed differential gene
expression analysis contrasting one group with all other
groups and determined the upregulated genes for each
group. This analysis identified 327 and 570 upregulated
genes in NB and LP classes, respectively. However, within
the significance thresholds we used, we failed to detect
upregulated genes for the BS class. The reason behind this
can be attributed to the heterogeneous structure of this
group, as it can be seen in the heatmap (Figure 1a) and in
PCA analysis (Supplementary Figure S1) as well.
Having determined the upregulated genes in different
cell line groups we defined, next, we tempted to relate
those genes with the regulon targets. We identified the
genes positively associated with the regulons using the
information provided in (Robertson et al., 2017). This
analysis showed that cell line groups constituted according
to regulon expression profiles were in concordance with the
regulon activity. For the NB group, upregulated genes had
the highest intersection rate with FGFR1 targets (18.96%),
followed by GATA6 (4.89%) and FOXM1 (4.89%) (Figure
2). FGFR1 was also significantly upregulated in the NB
group (Figure 3a). FGFR1 targets, which are upregulated in
the NB class were mainly involved in neurogenesis, neuron
differentiation, nervous system development (Figure 3b).
Further, expression of the genes VIM and ZEB1 implicated
in epithelial to mesenchymal transition (Takeyama et al.,
2010; Pluciennik et al., 2015; Larsen et al., 2016; Wu et al.,
2018), highly correlated with the expression of FGFR1,
emphasizing the role of this regulon in the transcriptomic
constitution of the NB group (Figure 3c-3d).
Upregulated genes in the LP class mainly intersected
with ERBB2, FOXA1, PPARG, ERBB3, FGFR3, RARG,
and GATA3 targets (Figure 2). We identified that almost
all these regulons were significantly upregulated in the
LP class (Figure 4a, Supplementary Figure S2). Target
genes of the regulons upregulated in LP class were
involved in epithelial cell differentiation, cell junction
organization, and urogenital system development (Figure
4b, Supplementary Figure S2). Remarkably, expressions
of FOXA1 (ρ = 0.71) and GRHL3 (ρ = 0.60) significantly
correlated with the expression of ERBB2 (Figure 4c-4d),
indicating the luminal characteristics of the LP group.
659
ERAY and ERKEK ÖZHAN / Turk J Biol
DE
1
TN
PR
AP
1
4
KD
1
DCLK
2
3
DOCK10
2
AKT3
FC
PDG
N1
DB
1
FGFR1 Expression − log2(RPKM)
VIM
22
6
SY
CN
1
C
GP
***
***
1
LGALS
PM P
B
ZE
b
a
P1
XB
ST
B2
GO Terms
Neuronal-Basal
Luminal-Papillary
P3H1
1
neuron differentiation
nervous system development
neurogenesis
cell migration
plasma membrane bounded
cell projection organization
central nervous
system development
regulation of multicellular
organismal development
regulation of cellular
component organization
regulation of cell communication
regulation of signal transduction
neuron development
c
DIXDC
3
K
10
HG
logFC
1
REC
BS
LP
AR
NB
EF
0
AR
RB
2
ZE
Basal-Squamous
d
Neuronal-Basal
ρ=0.81
regulation of cell differentiation
Luminal-Papillary
Basal-Squamous
ρ=0.74
4
3
ZEB1 (log2 RPKM)
VIM (log2 RPKM)
8
4
2
1
0
0
−1
0
2
4
FGFR1 (log2 RPKM)
6
0
2
4
FGFR1 (log2 RPKM)
6
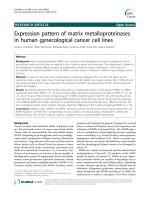
Figure 3. FGFR1 targets upregulated in NB group are involved in neuronal differentiation. (a) Boxplot comparing the expression of
FGFR1 in three cell line groups: Neuronal-Basal (NB) (dark blue), Luminal-Papillary (LP) (green) and Basal-Squamous (BS) (orange)
(ANOVA p-value=1.24e-07). Bonferroni post-hoc test was used for statistical analysis (*p < 0.05; **p < 0.01; ***p < 0.001). (b) Chord
plot visualization of GO term analysis applied to the genes upregulated in NB group cell lines and intersecting with FGFR1 regulon
targets. The right part of the chord plot represents the go terms, and the left part represents the genes linked with the respective terms.
Genes are colored according to their logFC values. (c-d) Scatter plots comparing the expression FGFR1 with its target genes VIM (ρ =
0.81) (c) and ZEB1 (ρ = 0.74) (d). Colors represent the cell line groups.
660
SGPL1
3.5
X2
ACE
R
2
SLC27
A2
OVOL1
3.0
IDH1
WNT7B
ID1
OT
CR
G
S1
F1
GO Terms
Neuronal-Basal
6
1
epithelial cell differentiation
epithelium development
lipid biosynthetic process
renal system development
fatty acid metabolic process
cellular lipid catabolic process
lipid catabolic process
kidney development
epidermis development
icosanoid metabolic process
reproductive system
development
epithelial tube
morphogenesis
lung development
c
ST2
3
PLCE
1
SO
X4
logFC
BS
MG
LP
MG
NB
ST
FA
A
KD
H
AR
PP
1
2.5
ERBB2 Expression − log2(RPKM)
CTSH
T1
HE
Basal-Squamous
Luminal-Papillary
d
Neuronal-Basal
6
ρ=0.71
4
GRHL3 (log2 RPKM)
FOXA1 (log2 RPKM)
HPGD
3
GATA
MS
L3
X3
19
OX
5
IN
TB
KRT
SP
D2
AL
***
***
1
XA
FO
T
CS
TA
b
H
GR
a
ACOX1
ERAY and ERKEK ÖZHAN / Turk J Biol
2
urogenital system
development
regulation of cell
proliferation
morphogenesis
of an epithelium
oxoacid metabolic
process
Basal-Squamous
Luminal-Papillary
ρ=0.60
4
2
0
0
3
4
ERBB2 (log2 RPKM)
5
−2
3
4
ERBB2 (log2 RPKM)
5
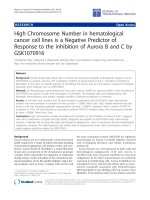
Figure 4. Targets of ERBB2 upregulated in LP group are implicated in epithelial morphogenesis. (a) Boxplot comparing the expression
of ERBB2 in three cell line groups: Neuronal-Basal (NB) (dark blue), Luminal-Papillary (LP) (green), and Basal-Squamous (BS) (orange)
(ANOVA p-value=2.36e-05). Bonferroni post-hoc test was used for statistical analysis (*p < 0.05; **p < 0.01; ***p < 0.001). (b) Chord
plot visualization of GO term analysis applied to the genes upregulated in LP group cell lines and intersecting with ERBB2 regulon target
genes. The right part of the chord plot represents the go terms, and the left part represents the genes associated with the terms. Coloring
of the genes is done according to their expression of logFC values. (c-d) Scatter plot showing the correlation between the expression of
ERBB2 and its targets FOXA1 (c) (ρ = 0.71) and GRHL3 (ρ = 0.60) (d).
661
ERAY and ERKEK ÖZHAN / Turk J Biol
3.3. Cell lines belonging to NB-group expresses neuroendocrine differentiation marker genes
Our finding, which shows the enrichment of neurogenesisrelated genes in the FGFR1 targets upregulated in the NB
group, prompted us to decipher this connection in more
detail. As FGFR1 is the main player characterizing this
group, we checked the enrichment of FGFR1 regulon
activity in each consensus subgroup of primary bladder
cancer (Kamoun et al., 2020). We discovered that although
FGFR1 has the highest enrichment score in stromal-rich
consensus subgroup (Fisher’s test p-value=4.20E-41),
it was also moderately enriched in neuroendocrinelike subgroup (Fisher’s test p-value= 3.18E-04) (Based
on the information from Supplementary Table 3,
(Kamoun et al., 2020)). To strengthen this association
further, we checked the expression of genes marker of
neuroendocrine differentiation (Kamoun et al., 2020)
in the cell line groups we determined. This analysis
also revealed that genes involved in neuroendocrine
differentiation were significantly higher expressed in
NB group (p-value=0.0146) (Figure 5a). Additionally,
expression of FGFR1 highly correlated with the expression
of neuroendocrine markers (Figure 5b). Collectively, these
results highly argue for the neuronal characteristics of the
NE group and involvement of FGFR1 in this signature.
3.4. J82 cells belonging to NB group show nucleocytoplasmic staining of β-catenin
We recently showed that the WNT/β-catenin pathway
is associated with the active regulatory elements
characterizing neuronal bladder cancer (Eray et al.,
2020). Within this frame, to check any connection of the
NB group with WNT/β-catenin pathway deregulation,
we scanned the cell lines we used in this study for the
mutation status of β-catenin and β-catenin destruction
complex components. Among the NB group cell lines, 3 of
them had APC mutation and one had CTNNB1 mutation.
On the contrary 2 had APC or CTNNB1 mutation in the
two other cell line groups (Supplementary Figure S3).
Based on this information, we checked the β-catenin
localization in one of the NB group cell lines we had in
lab J82 and the other two cell lines, 5637 (BS group) and
RT112 (LP group) as controls (no mutation in CTNNB1
or APC). The staining of β-catenin in 5637 and RT112 was
concentrated at the cytoplasm and the membrane while in
J82 it was concentrated at the nucleus of the cells. Our data
showed that β-catenin showed significantly higher nuclear
localization in J82 compared to the other two cell lines
(Figure 6a-6b). This finding strengthens our conclusions
about the involvement of WNT/β-catenin pathway in
neuronal differentiation of bladder cancer cells. The
information we provide for the potential involvement
of FGFR1 in neuroendocrine features of bladder cancer
(Figure 5), identification of significantly increased nuclear
localization of β-catenin in a cell line belonging to NB
662
group (Figure 6) collectively strengthens the neuronal/
neuroendocrine characteristics of the cell lines present in
NB group according to our classifications.
4. Discussion
Bladder cancer cell lines serve as important models for
modeling bladder tumorigenesis, invasive characteristics
and treatment responses (Brown et al., 1990; Makridakis et
al., 2009). So far, several studies characterized the genomic
and transcriptomic properties of bladder cancer cell lines
(Earl et al., 2015; Nickerson et al., 2017). In this study, we
aimed to characterize the bladder cancer lines in terms
of their regulon activity, defined for the primary bladder
cancers in literature (Robertson et al., 2017; Lindskrog
et al., 2021). Our results showed that bladder cancer
cell lines have differential regulon activities, reflecting
their transcriptomic signatures and their consensus
classifications (Kamoun et al., 2020).
Genes significantly upregulated in cell lines belonging
to the NB group were mainly intersected the targets of
FGFR1 and were involved in neuronal differentiation.
Accordingly, the expression of the genes marker of
neuroendocrine differentiation (Kamoun et al., 2020)
was significantly higher in the NB group compared to the
two other cell line groups. In literature, FGFR1 has been
shown be expressed at higher levels in bladder cancers
showing mesenchymal features (Cheng et al., 2013).
Knock-down of FGFR1 in JMSU1 and UMUC3 cell
lines, belonging to NB group in our results, resulted in a
significant reduction in the anchorage-independent ability
of these cells (Tomlinson et al., 2009). Further FGFR1
expression was high in most small cell carcinoma of the
bladder (Yang et al., 2020), which is a rare type of bladder
cancer with neuroendocrine differentiation (Ghervan et
al., 2017; Wang et al., 2019). These existing literature and
our findings highly support the association of FGFR1 with
NB characteristics and neuronal differentiation of bladder
cancer.
We previously showed that WNT/β-catenin pathway is
deregulated in neuronal subtype of bladder cancer (Eray et
al., 2020). In this study, we identified significantly higher
accumulation β-catenin in nucleus in J82 cell line belonging
to NB group, which has a mutation in APC, a component
of β-catenin destruction complex (Krishnamurthy and
Kurzrock 2018; Parker and Neufeld 2020). It is known
that the immune gene expression signature is relatively
depleted from small cell neuroendocrine carcinoma of
the bladder (Yang et al., 2020), and neuroendocrine-like
bladder cancer show decreased levels of immune infiltrate
(Kamoun et al., 2020). It was also identified that Wnt/βcatenin signaling can decrease the T-cell infiltration
in melanoma mouse models. Thus, inhibition of Wnt
signaling has been suggested to prevent immunotherapy
resistance (Chehrazi-Raffle et al., 2021). In addition,
ERAY and ERKEK ÖZHAN / Turk J Biol
b
a
*
SCN3A
*
CNKSR2
0.4
CACNA1A
0
SLC1A2
CACNA2D2
Expression − log2(RPKM)
0.4
0.6
0.8
0.6
NRXN1
CAMK2B
KIAA2022
PSIP1
RTN1
0.2
−0.2
−0.4
−0.6
SLC4A8
DPY19L2P2
SNAP25
TTLL7
RGS7
PPM1E
ASRGL1
ZDHHC15
TMEM170B
0.2
STXBP5L
GKAP1
NB
LP
KCNC1
BS
ST18
ASCL1
HEPACAM2
DCX
FAM184A
ADAM22
GPR137C
RAB39B
MAP6
EML5
FAM105A
ELAVL4
INSM1
RARB
RARA
GATA6
HIF1A
STAT3
FOXM1
KLF4
EGFR
FOXA1
TP63
ERBB3
GATA3
PPARG
ERBB2
FGFR3
RXRA
RARG
FGFR1
Figure 5. Expression profile of neuroendocrine marker genes in NB group (a) Boxplot shows the expression profile of genes
associated with neuroendocrine differentiation (Kamoun, et al. 2020) in three cell line groups: Neuronal-Basal (NB) (dark blue),
Luminal-Papillary (LP) (green) and Basal-Squamous (BS) (orange). (ANOVA p-value=0.0146). Bonferroni post-hoc test was used
for statistical analysis (*p < 0.05; **p < 0.01; ***p < 0.001). (b) Heatmap displaying the correlation between the expression of genes
involved in neuroendocrine differentiation and expression of regulons.
inhibition of FGFR1 has been shown to enhance the
immune checkpoint inhibitor response in breast cancer
(Akhand et al., 2020). Based on all these information, we
checked the expression of CXCL16, T cell chemoattractant
(Akhand et al., 2020) in bladder cancer cell lines and
identified a significant negative correlation with FGFR1
expression (Supplementary Figure S4). Our data and
existing literature together suggest a regulatory axis
involving FGFR1, WNT/ β-catenin signaling, and tumor
immune microenvironment in regulation of NB cell
lines. Therefore, we suggest that combinatorial treatment
strategies disrupting this regulatory axis can be applied on
NB cell lines.
Regulons implicated in LP group cell lines are mainly
known for early bladder cancer, mostly non-muscle
invasive and luminal associations. ERBB2 has been
identified to be overexpressed in high-risk non-muscle
invasive bladder cancer (Hedegaard et al., 2016) and as
one of the major prognostic factors for survival status of
the patients (Cormio et al., 2017; Moustakas et al., 2020).
FOXA1 expression was adequate for separating non-basal
subtype of bladder cancer from the basal subtype (Sikic et
al., 2020). Furthermore, GATA3, FOXA1, and PPARG have
been shown to drive the luminal fate in a collaborative
manner (Warrick et al., 2016). Thus, within this frame,
our regulon-based classifications confirm the luminal
character of the LP class we defined.
Our differential gene expression analysis did not
identify significantly upregulated genes in the BS class,
largely because of the heterogeneity of this group
(Supplementary Figure S1). However, we determined
EGFR, FOXM1 and STAT3 as the main regulons, driving
the basal characterization of this group (cluster 3, Figure
1a). EGFR has been previously shown to be enriched in
basal-like bladder cancer, and some groups of muscle
invasive bladder cancers have been determined to respond
to EGFR inhibitors (Rebouissou et al., 2014). In addition,
expression of FOXM1 as a prognostic factor in the survival
of muscle invasive bladder cancer patients (Rinaldetti et
al., 2017), STAT3 expression, and phosphorylation was
identified to be substantially higher in basal-like bladder
cancer (Gatta et al., 2019). Further, STAT3 activated
663
ERAY and ERKEK ƯZHAN / Turk J Biol
a
ß-catenin
DAPI
b
merged
***
J82
***
ß-catenin
DAPI
merged
5637
ß-catenin
DAPI
merged
RT112
IDV (Integrated Density Value)
400
300
Cell Lines
J82
RT112
5637
200
100
0
J82
RT112
5637
Figure 6. Immunostaining profile of β-catenin in cell line groups (a) Immunofluorescence images showing the staining of β-catenin
cells; J82, 5638, and RT112. DAPI (blue) and β-catenin (red). (b) Barplot shows the quantification of nuclear signal in IF stainings.
Dunnett’s multiple comparisons test was used for statistical analysis (*p < 0.05; **p < 0.01; ***p < 0.001).
transgenic mice directly developed invasive bladder cancer
without going through the intermediate noninvasive
stages (Ho et al., 2012). Our results here collectively
emphasize the role of EGFR, FOXM1, and STAT3 in basal
characteristics of BS cell lines.
To conclude, our regulon-based classification of
bladder cancer cell lines may serve as an important
guideline for studying the different regulons implicated
in bladder cancer and trial of drug candidates relevant for
targeting regulons.
Authorship contribution statement
Aleyna Eray: Design of the study, computational and
experimental analysis, writing of the manuscript.
Serap Erkek-Ozhan: Design, supervision of the study,
writing of the manuscript.
Declaration of Competing Interest
Authors declare no competing interests.
Acknowledgments
This work was supported by EMBO Installation Grant
(number: 4148).
We thank Dr. Şerif Şentürk for providing us with J82
bladder cancer cell line and Çağla Kiser for providing
us with information about the experimental setup of
Immunofluorescent staining and reagents.
References
Akhand SS, Liu Z, Purdy SC, Abdullah A, Lin H et al. (2020).
Pharmacologic Inhibition of FGFR Modulates the Metastatic
Immune Microenvironment and Promotes Response to
Immune Checkpoint Blockade. Cancer Immunol Research 8:
1542-1553.
Barretina J, Caponigro G, Stransky N, Venkatesan K, Margolin
AA et al. (2012). The Cancer Cell Line Encyclopedia enables
predictive modelling of anticancer drug sensitivity. Nature 483:
603-607.
Brown JL, Russell PJ, Philips J, Wotherspoon J, Raghavan D (1990).
Clonal analysis of a bladder cancer cell line: an experimental
model of tumour heterogeneity. British Journal of Cancer 61:
369-376.
664
Cancer Genome Atlas Research N (2014). Comprehensive molecular
characterization of urothelial bladder carcinoma. Nature 507:
315-322.
Cerami E, Gao J, Dogrusoz U, Gross BE, Sumer SO et al. (2012). The
cBio cancer genomics portal: an open platform for exploring
multidimensional cancer genomics data. Cancer Discovery 2:
401-404.
Chehrazi-Raffle A, Dorff TB, Pal SK, Lyou Y (2021). Wnt/betaCatenin Signaling and Immunotherapy Resistance: Lessons for
the Treatment of Urothelial Carcinoma. Cancers 13: (4): 889.
doi: 10.3390/cancers13040889
ERAY and ERKEK ÖZHAN / Turk J Biol
Cheng T, Roth B, Choi W, Black PC, Dinney C et al. (2013).
Fibroblast growth factor receptors-1 and -3 play distinct roles
in the regulation of bladder cancer growth and metastasis:
implications for therapeutic targeting. PloS One 8: e57284.
Kolde R (2019). pheatmap: Pretty Heatmaps.
Choi W, Porten S, Kim S, Willis D, Plimack ER et al. (2014).
Identification of distinct basal and luminal subtypes of muscleinvasive bladder cancer with different sensitivities to frontline
chemotherapy. Cancer Cell 25: 152-165.
Larsen JE, Nathan V, Osborne JK, Farrow RK, Deb D et al. (2016).
ZEB1 drives epithelial-to-mesenchymal transition in lung
cancer. Journal of Clinical Investigation 126: 3219-3235.
Cormio L, Sanguedolce F, Cormio A, Massenio P, Pedicillo MC et al.
(2017). Human epidermal growth factor receptor 2 expression
is more important than Bacillus Calmette Guerin treatment in
predicting the outcome of T1G3 bladder cancer. Oncotarget 8:
25433-25441.
Earl J, Rico D, Carrillo-de-Santa-Pau E, Rodriguez-Santiago B,
Mendez-Pertuz M et al. (2015). The UBC-40 Urothelial Bladder
Cancer cell line index: a genomic resource for functional
studies. BMC Genomics 16: 403.
Eray A, Guneri PY, Yilmaz GO, Karakulah G, Erkek-Ozhan S (2020).
Analysis of open chromatin regions in bladder cancer links
beta-catenin mutations and Wnt signaling with neuronal
subtype of bladder cancer. Scientific Reports 10: 18667.
Gao J, Aksoy BA, Dogrusoz U, Dresdner G, Gross B et al. (2013).
Integrative analysis of complex cancer genomics and clinical
profiles using the cBioPortal. Science Signaling 6 (269): pl1.
doi: 10.1126/scisignal.2004088
Gatta LB, Melocchi L, Bugatti M, Missale F, Lonardi S et al. (2019).
Hyper-Activation of STAT3 Sustains Progression of NonPapillary Basal-Type Bladder Cancer via FOSL1 Regulome.
Cancers 11 (9): 1-25. doi: 10.3390/cancers11091219
Ghervan L, Zaharie A, Ene B, Elec FI (2017). Small-cell carcinoma
of the urinary bladder: where do we stand? Clujul Medical 90:
13-17.
Hedegaard J, Lamy P, Nordentoft I, Algaba F, Hoyer S et al. (2016).
Comprehensive Transcriptional Analysis of Early-Stage
Urothelial Carcinoma. Cancer Cell 30: 27-42.
Ho PL, Lay EJ, Jian W, Parra D, Chan KS (2012). Stat3 activation
in urothelial stem cells leads to direct progression to invasive
bladder cancer. Cancer Research 72: 3135-3142.
Jin X, Yun SJ, Jeong P, Kim IY, Kim WJ et al. (2014). Diagnosis
of bladder cancer and prediction of survival by urinary
metabolomics. Oncotarget 5: 1635-1645.
Kamburov A, Pentchev K, Galicka H, Wierling C, Lehrach H et al.
(2011). ConsensusPathDB: toward a more complete picture of
cell biology. Nucleic Acids Research 39: D712-717.
Krishnamurthy N, Kurzrock R (2018). Targeting the Wnt/betacatenin pathway in cancer: Update on effectors and inhibitors.
Cancer Treatment Reviews 62: 50-60.
Lindskrog SV, Prip F, Lamy P, Taber A, Groeneveld CS et al. (2021).
An integrated multi-omics analysis identifies prognostic
molecular subtypes of non-muscle-invasive bladder cancer.
Nature Communications 12: 2301.
Makridakis M, Gagos S, Petrolekas A, Roubelakis MG, Bitsika V et
al. (2009). Chromosomal and proteome analysis of a new T24based cell line model for aggressive bladder cancer. Proteomics
9: 287-298.
Moustakas G, Kampantais S, Nikolaidou A, Vakalopoulos I, Tzioufa
V et al. (2020). HER-2 overexpression is a negative predictive
factor for recurrence in patients with non-muscle-invasive
bladder cancer on intravesical therapy. Journal of International
Medical Research 48 (1): 300060519895847.
Nickerson ML, Witte N, Im KM, Turan S, Owens C et al. (2017).
Molecular analysis of urothelial cancer cell lines for modeling
tumor biology and drug response. Oncogene 36: 35-46.
Parker TW, Neufeld KL (2020). APC controls Wnt-induced
beta-catenin destruction complex recruitment in human
colonocytes. Scientific Reports 10: 2957.
Piantino CB, Sousa-Canavez JM, Srougi V, Salvadori F, Kato R et al.
(2010). Establishment and characterization of human bladder
cancer cell lines BexBra1, BexBra2, and BexBra4. In Vitro
Cellular and Developmental Biology. Animal 46: 131-139.
Pinto-Leite R, Carreira I, Melo J, Ferreira SI, Ribeiro I et al. (2014).
Genomic characterization of three urinary bladder cancer cell
lines: understanding genomic types of urinary bladder cancer.
Tumour Biology 35: 4599-4617.
Pluciennik E, Nowakowska M, Pospiech K, Stepien A, Wolkowicz
M et al. (2015). The role of WWOX tumor suppressor gene in
the regulation of EMT process via regulation of CDH1-ZEB1VIM expression in endometrial cancer. International Journal
of Oncology 46: 2639-2648.
Rebouissou S, Bernard-Pierrot I, de Reynies A, Lepage ML, Krucker
C et al. (2014). EGFR as a potential therapeutic target for a
subset of muscle-invasive bladder cancers presenting a basallike phenotype. Science Translational Medicine 6: 244ra291.
Kamburov A, Wierling C, Lehrach H, Herwig R (2009).
ConsensusPathDB--a database for integrating human
functional interaction networks. Nucleic Acids Research 37:
D623-628.
Rinaldetti S, Wirtz RM, Worst TS, Eckstein M, Weiss CA et al.
(2017). FOXM1 predicts overall and disease specific survival
in muscle-invasive urothelial carcinoma and presents a
differential expression between bladder cancer subtypes.
Oncotarget 8: 47595-47606.
Kamoun A, de Reynies A, Allory Y, Sjodahl G, Robertson AG et
al. (2020). A Consensus Molecular Classification of Muscleinvasive Bladder Cancer. European Urology 77: 420-433.
Robertson AG, Kim J, Al-Ahmadie H, Bellmunt J, Guo G et al.
(2017). Comprehensive Molecular Characterization of MuscleInvasive Bladder Cancer. Cell 171: 540-556 e525.
665
ERAY and ERKEK ÖZHAN / Turk J Biol
Sikic D, Eckstein M, Wirtz RM, Jarczyk J, Worst TS et al. (2020).
FOXA1 Gene Expression for Defining Molecular Subtypes
of Muscle-Invasive Bladder Cancer after Radical Cystectomy.
Journal of Clinical Medicine 9 (4): 994. doi: 10.3390/
jcm9040994
Wang Y, Li Q, Wang J, Tong M, Xing H et al. (2019). Small cell
carcinoma of the bladder: the characteristics of molecular
alterations, treatment, and follow-up. Medical Oncology 36:
98.
Sjodahl G, Lauss M, Lovgren K, Chebil G, Gudjonsson S et al. (2012).
A molecular taxonomy for urothelial carcinoma. Clinical
Cancer Research 18: 3377-3386.
Warrick JI, Walter V, Yamashita H, Chung E, Shuman L et al.
(2016). FOXA1, GATA3 and PPAR Cooperate to Drive
Luminal Subtype in Bladder Cancer: A Molecular Analysis of
Established Human Cell Lines. Scientific Reports 6: 38531.
Takeyama Y, Sato M, Horio M, Hase T, Yoshida K et al. (2010).
Knockdown of ZEB1, a master epithelial-to-mesenchymal
transition (EMT) gene, suppresses anchorage-independent cell
growth of lung cancer cells. Cancer Letters 296: 216-224.
Wu S, Du Y, Beckford J, Alachkar H (2018). Upregulation of the EMT
marker vimentin is associated with poor clinical outcome in
acute myeloid leukemia. Journal of Translational Medicine 16:
170.
Tan TZ, Rouanne M, Tan KT, Huang RY, Thiery JP (2019). Molecular
Subtypes of Urothelial Bladder Cancer: Results from a Metacohort Analysis of 2411 Tumors. European Urology 75: 423432.
Yang G, Bondaruk J, Cogdell D, Wang Z, Lee S et al. (2020).
Urothelial-to-Neural Plasticity Drives Progression to Small
Cell Bladder Cancer. iScience 23: 101201.
Tomlinson DC, Lamont FR, Shnyder SD, Knowles MA (2009).
Fibroblast growth factor receptor 1 promotes proliferation and
survival via activation of the mitogen-activated protein kinase
pathway in bladder cancer. Cancer Research 69: 4613-4620.
Walter W, Sanchez-Cabo F, Ricote M (2015). GOplot: an R package
for visually combining expression data with functional analysis.
Bioinformatics 31: 2912-2914.
666
Zuiverloon TCM, de Jong FC, Costello JC, Theodorescu D (2018).
Systematic Review: Characteristics and Preclinical Uses of
Bladder Cancer Cell Lines. Bladder Cancer 4: 169-183.
ERAY and ERKEK ÖZHAN / Turk J Biol
Classification of bladder cancer cell lines according to regulon activity
Supplementary Information
Appendix A. Supplementary material
Supplementary data 1: Supplementary Figures 1–4.
Individuals − PCA
UBLC1
●
4
●
HT1197
●
HT1376
2
●
Dim2 (12.4%)
SCABER
647V
UMUC3
●
253JBV
●
5637
●● SW1710
● ●
●
Groups
BFTC905
●
●
●
KU1919
SW780
JMSU1
639V
●
UMUC1
●
●
253J
0
VMCUB1
●
●
●
J82
●● ●
T24
CAL29
●
●
●RT112
●
BS
LP
NB
●
RT4
KMBC2
TCCSUP
●
●
−2
BC3C
●
−4
−2
0
Dim1 (33.5%)
2
4
Supplementary Fig. S1. PCA plot of the bladder cancer cell lines according to their expression profiles. Group colors
representing the determined bladder cancer cell line groups. Neuronal-Basal (NB) (dark blue), Luminal-Papillary (LP)
(green) and Basal-Squamous (BS) (orange)
1
ERAY and ERKEK ÖZHAN / Turk J Biol
a
AGR2
HPG
D
3
TA
GA
***
***
G
RH
FOXA1 Expression − log2(RPKM)
4
L2
TB
3
X3
2
KLF5
WNT7B
1
ID1
S1
BS
E1
logFC
1
3
GO Terms
KLHL3
LP
PLC
NB
SM
AD
6
0
HE
heart development
circulatory system development
kidney development
cardiac ventricle development
positive regulation of metabolic process
ventricular septum development
renal system development
epithelial cell differentiation
urogenital system development
epithelium development
heart morphogenesis
renal tubule development
kidney morphogenesis
lung development
b
4.0
3.0
3.5
R2
2.0
2.5
IDH1
4
1.5
ST3GAL
1
ST
ST
2
1.0
MG
M
G
0.5
1
BS
ACO
X
LP
logFC
1
3
GO Terms
SGPL1
PPARG Expression − log2(RPKM)
L5
AC
E
NB
fatty acid derivative biosynthetic process
lipid biosynthetic process
fatty acid metabolic process
oxoacid metabolic process
icosanoid metabolic process
membrane lipid metabolic process
cellular lipid catabolic process
sulfur compound biosynthetic process
lipid catabolic process
2
HPGD
X5
ALO
S
AC
**
ERAY and ERKEK ÖZHAN / Turk J Biol
3.5
AC
E
3.0
EP300
SF
21
R2
SLC
27A
2
PTP
2.5
RU
PIK3C
2B
2.0
LIMCH1
GRHL1
1.5
KDF1
C5
SERIN
7
KHA
1.0
PLE
H
LIP
X4
SO
2
LD
PL1
L2
OSBP
SLC
SG
GO Terms
9A1
BS
CD
LP
ER
NB
2
AC
OT
1
1
B3
CR
S1
MA
BB
E
RV
0.5
0.0
ERBB3 Expression − log2(RPKM)
BCAS1
CDH1
RAB25
1
XA
FO
1
RP
PL
FR
B
EV
TN
2
STD
TAC
ES
F1
PO
***
1
INT
SP
*
***
KRT33A
c
logFC
3
1
cell−cell adhesion mediated by cadherin
cell−cell junction organization
cell junction assembly
epithelium development
epithelial cell differentiation
lipid biosynthetic process
epithelial cell development
myelination
adherens junction organization
negative regulation of cell adhesion
d
KRT13
IVL
T1
KR
9
***
5
XA
FO
***
4
63
EVP
3
L
CEBPA
2
7B
WNT
1
HL
LA
M
A5
1
GR
epithelial cell differentiation
GO Terms
logFC
epithelium development
KDM5B
BS
HS6
ST1
LP
RX
NB
RA
0
FGFR3 Expression − log2(RPKM)
1
TP
1
reproductive system development
3
gland morphogenesis
morphogenesis of an epithelium
placenta development
lung development
respiratory tube development
skin development
gland development
Notch signaling pathway
respiratory system development
epidermis development
cornification
regulation of cell differentiation
urogenital system development
3
ERAY and ERKEK ÖZHAN / Turk J Biol
EPHB6
IP2
FA
TN
TD
CS
TA
**
2
*
F1
ADGR
e
PT
3.0
ER
BB
3
SEMA
2.5
4A
2.0
KLF5
B
1.5
WNT7
ID1
A5
M
LA
logFC
GO Terms
1
NFE2L2
G1
BS
ADGR
LP
HS
NB
6S
T1
DA
B2
I
P
1.0
RARG Expression − log2(RPKM)
K6
vasculature development
3
blood vessel morphogenesis
circulatory system development
epithelial cell differentiation
epithelium development
plasma membrane bounded cell projection organization
ameboidal−type cell migration
lung development
respiratory tube development
nervous system development
negative regulation of signaling
cardiovascular system development
negative regulation of response to stimulus
neuron development
negative regulation of locomotion
neurogenesis
respiratory system development
CTSH
RAB
25
f
HL
GR
3
*
***
FO
XA
− log2(RPKM)
Expression
GATA3
1
2
3
4
1
TBX
3
ELF3
2
MSX
P1
3B
0
PP
AR
G
SH
logFC
2
GO Terms
3
SOX4
BS
1
LP
HES
NB
epithelial cell differentiation
epithelium development
morphogenesis of an epithelium
epithelial tube morphogenesis
gland morphogenesis
regulation of epithelial cell migration
epidermis development
branching morphogenesis of an epithelial tube
neural tube development
heart development
regulation of cell proliferation
Supplementary Fig. S2. Targets of regulons upregulated in LP group are mostly associated with epithelial
differentiation. Boxplots comparing the expression of FOXA1 (ANOVA p-value= 1.89e-05 ) (a), PPARG (ANOVA
p-value=0.00498) (b), ERBB3 (ANOVA p-value=1.35e-06) (c), FGFR3 (ANOVA p-value=3.67e-07) (d), RARG (ANOVA
p-value=0.00395) (e) and GATA3 (ANOVA p-value=0.000106) (f) in three cell line groups: Neuronal-Basal (NB) (dark
blue), Luminal-Papillary (LP) (green) and Basal-Squamous (BS) (orange). Bonferroni post-hoc test was used for statistical
analysis (*p<0.05; **p<0.01; ***p<0.001). Chord plot visualizations of GO term analysis applied to the genes upregulated
in LP group cell lines and intersecting with the respective regulon target genes.
4
639V
JMSU1
J82
KMBC2
VMCUB1
SW780
BC3C
BFTC905
CAL29
HT1197
HT1376
KU1919
RT4
RT112
SCABER
SW1710
T24
TCCSUP
UBLC1
UMUC1
UMUC3
253JBV
253J
647V
5637
ERAY and ERKEK ÖZHAN / Turk J Biol
Profiled in Copy Number Alterations
APC
20%
CTNNB1
8%
Missense Mutation (unknown significance)
Genetic Alteration
No alterations
Profiled in Copy Number
Alterations
Yes
Amplification
No
Supplementary Fig. S3. Oncoprint image of bladder cancer cell lines. APC and CTNNB1 (B-catenin) mutation
and copy number alteration status of bladder cancer cell lines has shown.
ρ = -0.45
6
CXCL16 (log2 RPKM)
4
2
0
0
2
4
FGFR1 (log2 RPKM)
6
Supplementary Fig. S4. Correlation of FGFR1 and CXCL16 among bladder cancer cell lines. Scatter plot showing the
correlation between the expression of FGFR1 and CXCL16 (ρ= -0.45).
5
ERAY and ERKEK ÖZHAN / Turk J Biol
Supplementary Table S1. Consensus classification table of bladder cancer cell lines.
Sample ID
consensusClass cor_pval
253JBV_URINARY_TRACT
NE-like
4,68948E-24 0,093787156
0,2574151
253J_URINARY_TRACT
NE-like
8,42273E-21 0,053871132
0,255865753 0,193039385 0,244510671 0,196392919 0,309972265 0,313376277
5637_URINARY_TRACT
Ba/Sq
3,10386E-52 0,777526879
0,320335243 0,222932533 0,285254683 0,249088958 0,488967135 0,258914796
639V_URINARY_TRACT
NE-like
5,88916E-42 0,480284829
0,192728703 0,142214341 0,22542168
647V_URINARY_TRACT
Ba/Sq
1,54644E-47 0,853265862
0,360508926 0,299953032 0,363097861 0,315952481 0,468489991 0,32943872
BC3C_URINARY_TRACT
Ba/Sq
3,85491E-47 0,775646138
0,308196594 0,213172802 0,253708029 0,239951443 0,466695478 0,270994284
BFTC905_URINARY_TRACT Ba/Sq
1,52316E-76 0,584423412
0,422818212 0,288666156 0,335488698 0,290741175 0,577093414 0,21967185
CAL29_URINARY_TRACT
Ba/Sq
3,30704E-59 0,220002263
0,492824834 0,387673587 0,426484928 0,350598546 0,517009803 0,247840408
HT1197_URINARY_TRACT
Ba/Sq
6,09385E-43 0,664541223
0,373748743 0,30814758
HT1376_URINARY_TRACT
Ba/Sq
4,64879E-57 0,592003049
0,418565222 0,331541917 0,381424854 0,303431822 0,508645886 0,236359508
J82_URINARY_TRACT
Ba/Sq
2,34935E-31 0,012885797
0,255052604 0,215409058 0,279418652 0,275533116 0,384827653 0,383444339
JMSU1_URINARY_TRACT
NE-like
1,00507E-30 0,435240446
0,192029012 0,134416904 0,211183064 0,181166748 0,302936915 0,381029081
KMBC2_URINARY_TRACT
LumP
3,86982E-71 0,721042702
0,559638686 0,43980401
KU1919_URINARY_TRACT
Ba/Sq
1,50534E-41 0,765579351
0,31610755
RT112_URINARY_TRACT
LumP
4,55157E-70 0,475389501
0,556054737 0,411844479 0,444996894 0,352912892 0,49537885
0,220265266
RT4_URINARY_TRACT
LumP
2,18981E-90 0,488905979
0,617489047 0,48873091
0,51529522
0,179469076
SCABER_URINARY_TRACT
Ba/Sq
1,23879E-63 0,778203729
0,28314435
0,210240712 0,213314677 0,5335444
SW1710_URINARY_TRACT
Ba/Sq
8,01706E-28 0,223664926
0,235561407 0,18319918
0,238596488 0,243605788 0,362888249 0,335648744
SW780_URINARY_TRACT
LumP
3,23431E-85 0,677347617
0,603068728 0,47822204
0,496243374 0,366094419 0,412492873 0,197484157
T24_URINARY_TRACT
Ba/Sq
1,04177E-35 0,281996728
0,288417557 0,206595387 0,2757358
TCCSUP_URINARY_TRACT
Ba/Sq
4,14267E-39 0,600646896
0,269844645 0,243464373 0,281987659 0,330848122 0,427852909 0,354913342
UBLC1_URINARY_TRACT
Ba/Sq
6,13272E-33 0,745331532
0,314657849 0,248066126 0,321962335 0,265617883 0,394141414 0,279941831
UMUC1_URINARY_TRACT
LumP
5,49414E-75 0,439865763
0,572170984 0,457405107 0,47096898
UMUC3_URINARY_TRACT
NE-like
1,6174E-28
0,157234364 0,089970968 0,170911571 0,135505835 0,282638522 0,367340793
VMCUB1_URINARY_TRACT Ba/Sq
6
separationLevel LumP
0,416702796
1,05499E-63 0,614207938
LumNS
LumU
Stroma-rich
Ba/Sq
NE-like
0,189735587 0,247377733 0,198824769 0,329468504 0,337444966
0,365380334 0,29417652
0,447015315 0,277811389
0,477951587 0,344787233 0,452892887 0,162528213
0,216494475 0,27204855
0,1705654
0,197533365 0,331390213 0,442205232
0,242037133 0,440192423 0,328330276
0,328196143 0,32483191
0,159793097
0,257842078 0,409752767 0,373748528
0,408079974 0,524672546 0,213547081
0,389584383 0,273083351 0,313249594 0,284754548 0,533797757 0,21824899