Tài liệu 43 Sony Systems ppt
Bạn đang xem bản rút gọn của tài liệu. Xem và tải ngay bản đầy đủ của tài liệu tại đây (317.83 KB, 22 trang )
Kenzo Akagiri, et. Al. “Sony Systems.”
2000 CRC Press LLC. <>.
SonySystems
KenzoAkagiri
SonyCorporation
(Tokyo)
M.Katakura
SonyCorporation
(Kanagawa)
H.Yamauchi
SonyCorporation
(Kanagawa)
E.Saito
SonyCorporation
(Kanagawa)
M.Kohut
SonyCorporation
(California)
MasayukiNishiguchi
SonyCorporation
(Tokyo)
K.Tsutsui
SonyCorporation
(Tokyo)
43.1Introduction
43.2OversamplingADandDAConversionPrinciple
Concept
•
ActualConverters
References
43.4TheSDDSSystemforDigitizingFilmSound
FilmFormat
•
PlaybackSystemforDigitalSound
•
TheSDDS
ErrorCorrectionTechnique
•
FeaturesoftheSDDSSystem
43.5SwitchedPredictiveCodingofAudioSignalsfortheCD-I
andCD-ROMXAFormat
Abstract
•
CoderScheme
•
Applications
References
43.7ATRAC(AdaptiveTransformAcousticCoding)and
ATRAC2
ATRAC
•
ATRAC2
References
43.1 Introduction
KenzoAkagiri
Indigitalsignalprocessing,manipulatingofthesignalisdefinedasanessentiallymathematical
procedure,whiletheADandDAconverters,thefrontendandthefinalstagedevicesofthepro-
cessing,includeanalogfactor/limitation.Therefore,theperformanceofthedevicesdeterminesthe
degradationfromthetheoreticalperformancedefinedbytheformatofthesystem.
Untilthe1970s,ADandDAconverterswitharound16-bitresolution,whichwerefabricated
bymoduleorhybridtechnology,wereveryexpensivedevicesforindustryapplications.Atthe
beginningofthe1980s,theCD(compactdisk)player,thefirstmass-productiondigitalaudioproduct,
wasintroduced,andrequiredlowcostandmonolithictypeDAconverterswith16-bitresolution.
Thetwo-stepdualslopemethod[1]andtheDEM(DynamicElementMatching)[2]methodwere
c
1999byCRCPressLLC
used in the first generation DA converters for CD players. These were methods which relieved the
accuracy and matching requirements of the elements to guarantee conversion accuracy by circuit
technology. Introducingnewideasoncircuitandtrimming, likesegmentdecodeandlasertrimming
of the thin film fabricated on monolithic silicon die, for example, classical circuit topologies using
binary weighted current source were also used. For AD conversion at same gener ation, successive
approximation topology andthe two-step dualslope method were also used.
In the mid-1980s, introductions of the oversampling and the noise shaping technology to the AD
andDAconvertersforaudioapplicationswereinvestigated[3]. Theconvertersusingthetechnologies
are the most popular devices for recent audio applications, especially as DA converters.
43.2 Oversampling AD and DA Conversion Principle
M. Katakura
43.2.1 Concept
The concept of the oversampling AD and DA conversion, DS or SD modulation, was known in
the 1950s; however, the device technology to fabricate actual devices was impracticable until the
1980s [4].
The oversampling AD and DA conversion is characterized by the following three technologies.
1. oversampling
2. noise shaping
3. fewer bit quantizer (converters used one bit quantizer called the DS or SD t ype)
It is well known that the quantization noise shown in the next equation is determined by only
quantization step D and distr ibuted in bandwidth limited by Nyquist frequency (2/fs), and the
spectrum is almost similar to white noise when the step size is smaller than the signal level.
V
n
= /
√
12 (43.1)
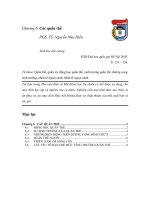
Asshownin Fig. 43.1, the oversamplingexpandsacapacity of the quantization noise cavityon the
frequency axis and reduces the noise density in the audio band, and the noise shaping moves it to
out of the band. Figure 43.2 is first-order noise shaping to show the principle of the noise shaping,
in which the quantizer is representedbythe adder fed an input U (n) and a quantization noise Q(n).
Y (n) and U(n), the output and input signals of the quantizer, respectively, are given as follows:
Y
(n)
= U
(n)
+ Q
(n)
(43.2)
U
(n)
= X
(n)
+ Q
(n−1)
(43.3)
As a result, the output Y (n) is
Y
(n)
= X
(n)
+
Q
(n)
− Q
(n−1)
(43.4)
ThequantizationnoiseinoutputY (n),whichisadifferentiationoftheoriginalquantizationnoise
Q(n) and Q(n − 1) shifted a time step, has high frequency boosted spectrum. Equation (43.4)is
written as follows using z
Y
(z)
= X
(z)
+ Q
(z)
1 − Z
−1
(43.5)
The oversampling conversion using one bit quantizer is called DS or SD AD/DA converters. Re-
garding one bit quantizer, a mismatch of the elements does not affect differential error; in other
c
1999 by CRC Press LLC
FIGURE 43.1: Quantization noise of the oversampling conversion.
FIGURE 43.2: First-order noise shaping.
words, it has no non-linear error. Assume output swing of the quantizer is ± D, quantization noise
Q(z) iswhitenoise,andthemagnitude|Q(Wt)|isD2/3,whichcorrespondstofourtimesinpowerof
Eq.(43.1)sincethe step sizeistwicethat. Define q whichis2p ·f max /f s ,wheref max andfsare
the audio bandwidth and the sampling frequency, respectively, then the in-band noise in Eq. (43.5)
becomes
¯
N
2
=
Q
(ωT )
2
1
2π
θ
−θ
H
(ωT )
2
d
(ωT )
=
2
3
1
2π
θ
−θ
1 − e
−jωT
2
d
(ωT )
=
2
3
2
π
(θ − sin θ)
=
2
9π
θ
3
(43.6)
The oversampling conversion has the following remarkable advantages comparedwith traditional
methods.
1. Itiseasytorealize“good”onebitconverterswithoutsuperiordev iceaccuracyandmatch-
ing.
2. Analog anti-aliasing filters with sharp cutoff characteristics are unnecessary due to over-
sampling.
Usingtheoversamplingconvertingtechnology,requirementsforanalogpartsarerelaxed;however,
c
1999 by CRC Press LLC
they require large scale digital circuits because interpolation filters in front of the DA conversion,
which increase sampling frequency of the input digital signal, and decimation filters after the AD
conversion, which reject quantization noise in high frequency and reduce sampling frequency, are
required.
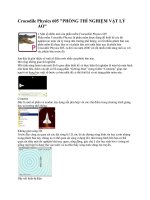
Figure43.3showsthe blockdiagramoftheDAconverterincluding aninterpolationfilter. Though
theschemeofthenoiseshaperisdifferentfromthatofFig.43.2,thefunctionisequivalent. Figure43.4
showstheblockdiagramoftheADconverterincludingadecimationfilter. NotethattheADconverter
is almost the same as with the DA converters regarding the noise shapers; however, the details of the
hardwarearedifferentdependingonwhethertheblockhandlesanalogordigitalsignal. Forexample,
to handle digital signals the delay units and the adders should use latches and digital adders; on the
otherhand,tohandleanalogsignalsdelayunits andaddersusingswitchedcapacitortopologyshould
be used. In the DS type, the quantizer is just reduction data length to one bit for the DA converter,
and is a comparator for the AD converter by the same rule.
FIGURE 43.3: Oversampling DA converter.
FIGURE 43.4: Oversampling AD converter.
43.2.2 Actual Converters
Toachieveresolutionof 16 bits or morefordigital audio applications, the first-ordernoiseshapingis
not acceptable because it requires an extra high oversampling ratio, and the following technologies
are a ctually adopted.
• High-order noise shaping
c
1999 by CRC Press LLC
• Multi-stage (feedforward) noise shaping
• Interpolative conversion
1. High-order noise shaping
Figure 43.5 shows quantization noise spectrum for order of the noise shaping. The third-order
noiseshapingachieves16-bitdynamicrangeusinglessthananoversamplingratioof100. Figure43.6
shows a third-order noise shaping for example of the high order. Order of the noise shaping used
is 2 to 5 for audio applications.
FIGURE 43.5: Quantization noise vs. order of noise shaping.
FIGURE 43.6: Third-order noise shaping.
In Fig. 43.6 output Y(z)is given
Y
(z)
= X
(z)
+ Q
(z)
1 − Z
−1
3
(43.7)
c
1999 by CRC Press LLC
The high-order noise shaping has a stability problem because the phase shift of the open loop in
morethan athird-ordernoiseshapingexceeds180
◦
. Inordertoguaranteethe stability,an amplitude
limiter at the integrator outputs is used, and modification of the loop transfer function is done,
although it degrades the noise shaping performance slightly.
2. Multi-stage (feedforward) noise shaping [5]
Multi-stage(feedforward)noiseshaping(calledMASH)achieveshigh-ordernoiseshapingtransfer
functionsusingnothigh-orderfeedbackbutfeedforward,andisshowninFig.43.7. Thoughtwo-stage
(two-order) is shown in Fig. 43.7, three-stage (three-order) is usually used for audio applications.
FIGURE 43.7: Multi-stage noise shaping.
3. Interpolative converters [6]
This is a method which uses a few bit resolution converters instead of one bit. The method
reducestheoversamplimgratio and order of the noise shaping to guaranteespecifieddynamicrange
and improve the loop stability. Since absolute value of the quantization noise becomes small, it is
relativelyeasytoguaranteenoiselevel;however,linearityoflargesignalconditionsaffectsthelinearity
error of the AD/DA converters used in the noise shaping loop.
Oversampling conversion has become a major technique in digital audio application, and one of
thedistinctions is that it does not inherently zerocrossdistort. Forrecentdevicetechnology, it is not
so difficult to guar antee 18-bit accuracy. Thus far, the available maximum dynamic range is slightly
lessthan20bit (120dB)withoutnoiseweighting(wideband)dueto analoglimitation. Ontheother
hand, converters with 20-bit or more resolution have been reported [7] and are expectedto improve
sound quality in very small sig nal levels from the standpoint of hearing.
References
[1] Kayanuma, A. et al., An integrated 16-bit A/D converter for PCM audio systems, ISSCC Dig.
Tech. Papers
, pp. 56-57, Feb., 1981.
c
1999 by CRC Press LLC
[2] Plassche,R.J.etal.,Amonolithic14-bitD/Aconverter,IEEEJ.SolidStateCircuits,SC-14:552-
556, 1979.
[3] Naus, P. J. A. et al., A CMOS stereo 16-bit D/A converter for digital audio,
IEEE J. Solid State
Circuits
, SC-22:390-395, June, 1987.
[4] Hauser,M.W.,OverviewofoversamplingA/DConverters,AudioEngineeringSocietyPreprint
#2973, 1990.
[5] Matsuya,Y.etal.,A16-bitoversamplingA-to-Dconversiontechnologyusingtriple-integration
noise shaping,
IEEE J. Solid State Circuits, SC-22:921-929, Dec., 1987.
[6] Schouwenaars, H. J. et al., An oversampling multibit CMOS D/A converter for digital audio
with 115 dB dynamic range,
IEEE J. Solid State Circuits, SC-26:1775-1780, Dec., 1991.
[7] Maruyama, Y. et al., A 20-bit stereo oversampling D-to-A converter,
IEEE Trans. Consumer
Electron.
, 39:274-276, Aug., 1993.
43.4 The SDDS System for Digitizing Film Sound
H. Yamauchi, E. Saito, and M. Kohut
43.4.1 Film Format
There are three basic concepts for developing the SDDS format. They can
1. Provide sound quality similar to CD sound quality. We adapt ATRAC (Adaptive TRansform
AcousticCoding)toobtaingoodsoundqualityequivalenttothatofCDs. ATRAC isthecompression
method used in the mini disc (MD) which has been in sale since 1992. ATRAC enables one record
digital sound data by compressing about 1/5 of the original sound.
2. Provide enough numbers of sound channels with good surround effects. We have eight discrete
channel systems and six channels to the screen in the front and two channels in the rear as surround
speakers shown in Fig. 43.8. We have discrete channel systems, making a good channel separation
which provides superior surround effects even in a large theater with no sound defects.
3. Be compatible with the current widespread analogue sound system. There are limited spaces
between the sprockets, picture frame, and in the external portion of the sprocket hole where the
digital sound could be recorded because the analogue sound track is left as usual. As in the cinema
scope format, it may be difficult to obtain enough space between picture frames. Because the signal
for recordingand playback would become intermittent between sprockets, special techniques would
be required to process such signals. As shown in Fig. 43.9, we therefore establish track P and track S
onafilmexternalportionwherecontinuousrecordingsarepossibleand wherespacecanbe obtained
in the digital sound recording region on the SDDS format.
Data bits are recorded on the film with black and white dot patterns. The size of a bit is decided
to overcome the effects caused by film scratch and is able to correct errors. In order to obtain the
certainty of reading data, we set a guard band area to the horizontal and track direction.
Now, the method to recorddigital sound data on these twotracks is toseparateeight channelsand
recordfourchannelseachintrackPandintrackS.Aredundantdataisalsorecordedabout18frames
later on the opposite track. By this method, it makes it possible to obtain the equivalent data from
track S if any error occurs on track P and the correction is unable to be made, or vice versa. This is
called the “Dig ital Backup System”.
Figure 43.10 shows the block structure for the SDDS format. A data compression block of the
ATRAC system has 512 bit sound data per film block. A vertical sync region is set at the head of the
film block. A film block ID is recorded in this region to reproducethe sound data and picture frame
c
1999 by CRC Press LLC
FIGURE 43.8: Speaker arrangement in theater.
with the right timing and to prevent the “lip sync” offset from discordance; for example, the time
accordance between an actor’s/actress’ lip movement and his/her voice. Also, a horizontal sync is
set on the left-hand side of the film block and is referred to correctly detect the head of the data in
reading with the line sensor.
43.4.2 Playback System for Digital Sound
The digital playback sound system for the SDDS system consists of a reader unit, DFP-R2000, and a
decoder unit, DFP-D2000 as shown in Fig. 43.11. The reader unit is set between the supply reel and
the projector.
The principle of digital sound reading for the reader unit DFP-R2000 is described in Fig. 43.12.
TheLED light sourceisderivedfromthe optical fiberand it scans the data portionrecordedontrack
P and track S of the film. Transparent lights through the film give an image formation on the line
sensorthroughthe lens. These optical systems are designed to havetheappropriatestructures which
can hardly be affected by scratches on the film. The output of a sensor signal is transmitted to the
decoder after the signal processing such as the wave form equalization is made.
The block diagram of the decoder unit DFP-D2000 is shown in Fig. 43.13. The unit consists of
EQ, DEC, DSP, and APR blocks.
In the EQ, signals become digital signals after being equalized. Then the digital signals are trans-
mitted to the DEC together with the regenerated clock signal.
IntheDEC, jitterselimination and lip sync controlaredonebythetimebase collectorcircuit, and
errorscausedbyscratchesanddustonthefilmarecorrectedbythestrongerrorcorrectionalgorithm.
Also in the DEC, signals for track P and track S which have been compressed by the ATRAC system
are decoded. This data is transmitted to the DSP as a linear PCM signal.
In the DSP, the sound field of the theater is adjusted and concealment modes are controlled. A
CPU is installed in the DSP to control the entire decoder, and control the front panel display and
reception and transmission of external control data.
c
1999 by CRC Press LLC
FIGURE 43.9: SDDS track designation.
FinallyintheAPR,10channelsofdigitalfilterincludingmonitors,D/Aconverter,andlineamplifier
areinstalled. Also,itispossibleto directlybypassananalogueinput signalbyrelayasnecessary. This
bypass is prepared to cope with analogue sound if digital sound would not play back.
43.4.3 The SDDS Error Correction Technique
TheSDDSsystemadaptsthe“ReedSolomon”codeforerrorcorrection. Anerrorcorrectiontechnique
is essential for maintaining high sound quality and high picture quality for digital recording and
playback systems, such as CD, MD, digital VTR, etc. Such C1 parity + C2 parity data necessary for
error correction are added and recorded in advance to cope with cases when the correct data are not
able to be obtained. It enables recovery of the correct data by using this additional data even if a
reading error occurs.
If the error rate is 10
−4
(1 bit for every 10,000 bits), the error rate for C1 parity after correction
wouldnormallybe10
−11
. Inotherwords,anerrorwouldoccuronlyonceevery1.3yearsifafilmwere
showed24 hoursaday. Errorswillbeextremelycloseto“zero”byusingC2parityerasurecorrection.
A strong error correction capability is installed in the SDDS digital sound playback system against
random errors.
Other errors besides random errors are
• errors caused by a scratch in the film running direction
• errors caused by dust on the film
• errors caused by splice points of films
• errors caused by defocusing during printing or playback
These are consideredburst errors which occur consistently. Scratcherrors in particular will increase
more and more every t ime the film is shown. SDDS has the capability of dealing with such burst
errors. Therefore, in spite of the scratch on the film width direction, error correction towards the
filmlengthwouldbepossible upto1.27mmand inspiteofthescratchonthefilm runningdirection,
error correction towards the film width would be possible up to 336 µ m.
c
1999 by CRC Press LLC
FIGURE 43.10: Data block configuration.
43.4.4 Features of the SDDS System
The specification characteristics for the SDDS player are shown in Table 43.1. It is not easy to obtain
highfidelityinaudiodatacompressioncomparedtothelinearrecordingsystemofCDswithregardto
asoundquality. Byadaptingasystemwithhighcompressionefficiencyandmakinguseofthehuman
hearing characteristics, we were able to maintain a sound quality equivalent to CDs by adapting the
ATRAC system which restrains deterioration to the minimum.
One of the biggest features of the SDDS is the adaption of a digital backup system. This is a
countermeasuresystemtomakeup forthedamagetothesplicingpartsofthe digital dataorthe parts
of data missing by using the opposite side of the track with a digital data recorded on the backup
channel. By this system, it would be possible to obtain an equivalent quality. Next, when finally the
film is worn out, the system switches over to an analogue playback signal.
This system also has a digital room EQ function. This supplies 28 bands of graphic EQ with 1/3
octave characteristics and a high and low pass filter. Moreover, a simple operation to control the
sound field in the theater will become possible by using a graphic user interface panel of an external
personal computer.
Such control usually took hours, but it can be completed in about 30 min with this SDDS player.
The stability of its features, reproducibility, and reliability of digitizing is well appreciated.
Furthermore,theSDDSplayercarriesabackupfunctionandaresetfunctionforsettingparameters
by using memories.
c
1999 by CRC Press LLC
FIGURE 43.11: Playback system.
FIGURE 43.12: Optical reader concept.
43.5 Switched Predictive Coding of Audio Signals for the CD-I
and CD-ROM XA Format
Masayuki Nishiguchi
43.5.1 Abstract
AnaudiobitratereductionsystemfortheCD-IandCD-ROMXAformatbasedonswitchedpredictive
codingalgorithmisdescribed. The principalfeatureofthe system is that thecoderprovides multiple
prediction error filters, each of which has fixed coefficients. The prediction error filter that best
matchestheinputsignalisselectedevery28samples(1block). Afirst-orderandtwokindsofsecond-
order prediction er ror filters are used for signals in the low and middle frequencies, and the st raight
PCM is used for high-frequency signals. The system also uses near-instantaneous companding to
expand the dynamic range. A noise-shaping filter is incorporated in the quantization stage, and its
frequency response is varied to minimize the energy of the output noise. With a complexity of less
than 8MIPS/channel, audio quality almost the same as CD audio can be achieved at 310 Kbps (8.2
bits/sample), near transparentaudio can be achievedat 159 Kbps (4.2 bits/sample), and mid-fidelity
audio can be achieved at 80 Kbps (4.2 bits/sample).
c
1999 by CRC Press LLC
FIGURE 43.13: Overall block diagram.
c
1999 by CRC Press LLC
TABLE 43.1 SDDS Player System
Electrical Specifications
Item Specification
Sampling frequency 44.1 KHz
Dynamic range Over 90 dB
Channel Max 8 cH
Frequency band 20 Hz - 20 KHz
+/ − 1.0dB
K.F
< 0.7%
Crosstalk < −80 dB
Reference output level
−10 dB / Unbalanced
+4 dB / Balanced
Head room
> 20 dB / Balanced
43.5.2 Coder Scheme
Figure 43.14 is a block diagram of the encoder and decoder system. The input signal, prediction
error, quantization error, encoder output, decoder input, and decoder output are respectively ex-
pressed as x(n), d(n), e(n),
ˆ
d(n),
ˆ
d
(n), and ˆx
(n).Thez-transforms of the signals are expressed as
X(z), D(z), E(z),
ˆ
D(z),
ˆ
D
(z), and
ˆ
X
(z). The encoder response can then be expressed as
ˆ
D(z) = G · X(z) ·{1 − P(z)}+E(z) ·{1 − R(z)} ,
(43.8)
and the decoder response as
ˆ
X
(z) =
G
−1
·
ˆ
D
(z)
1 − P(z)
,
(43.9)
Assuming that there is no channel error, we can write
ˆ
D
(z) =
ˆ
D(z). Using Eq. (43.8) and (43.9),
we can write the decoder output in terms of the encoder input as
ˆ
X
(z) = X(z) + G
−1
· E(z) ·
1 − R(z)
1 − P(z)
.
(43.10)
where
P(z) =
P
k=1
α
k
· z
−k
and R(z) =
R
k=1
β
k
· z
−k
(43.11)
Here α
k
and β
k
are, respectively, the coefficients of predictor P(z) and R(z). Equation (43.10)
showsthe encoder-decoderperformancecharacteristics ofthesystem. Itshowsthatthequantization
error E(z) is reduced by the extent of the noise-reduction effect G
−1
. The distribution of the noise
spectrum that appears at the decoder output is
N(z) = E(z) ·
1 − R(z)
1 − P(z)
.
(43.12)
R(z) can be varied according to the spectral shape of the input signal in order to have a maximum
masking effect, but we have set R(z) = P(z)to keep from coloring the quantization noise.
G can be regarded as the normalization factor for the peak prediction error (over 28 residual
words) from the chosen prediction error filter. The value of G changes according to the frequency
response of the prediction gain:
G ∝
|X(z)|
|D(z)|
.
(43.13)
This is also proportional to the inverse of the prediction error filter, 1/|1 − P(z)|. So, in order to
maximize G, it is necessar y to change the frequency response of the prediction er ror filter 1 −P(z)
according to the frequency distribution of the input signals.
c
1999 by CRC Press LLC
FIGURE 43.14: Block diagram of the bit rate reduction system.
c
1999 by CRC Press LLC
Selection of the Optimum Filter
Several different strategies of selecting filters are possible in the CD-I/CD-ROM XA format,
but the simplest way for the encoder to choose which predictor is most suitable is the following:
• The predictor adaptation section compares the peak value of the prediction errors (over
28 words) from each prediction error filter 1 − P(z)and selects the filter that generates
the minimum peak.
• Thegroupofpredictionerrorschosenisthengaincontrolled(normalizedbyitsmaximum
value) and noise shaping is executed at the same time.
Asaresult,ahigh SNR is obtained by using a first-order and two kinds of second-orderprediction
error filters for signals with the low and middle frequencies and by using the straight PCM for
high-frequency signals.
Coder Parameters
This system provides three bit rates for the CD-I/CD-ROM XA format, and data encoded at
any bit rate can be decoded by a single decoder. The follow ing sections explain how the parameters
used in the decoder and the encoder change according to the level of sound quality. Table 43.2 lists
the parameters for each level.
TABLE 43.2 The Parameters for Each Level
Level A Level B Level C
Sampling frequency 37.8 37.8 18.9
(KHz)
Residual wordlength 8 4 4
(bits per sample)
Block length 28 28 28
(Number of samples)
Range data 4 4 4
(bits per block)
Range values 0-8 0-12 0-12
Filter data 1 2 2
(bits per block)
Number of prediction error 2 3 4
filters used
Average of bits used per 8.18 4.21 4.21
sample (bits per sample)
= (8 ×28 +4 +1)/28 = (4 ×28 +4 +1)/28 = (4 ×28 +4 +1)/28
Bit rate (Kbps) 309 159 80
Level A
Wecan obtain the hig hest qualit y audio sound with Level A, which uses only two prediction error
filters. Either the straight PCM or the first-order differential PCM is selected. The transfer functions
of the prediction error filters are as follows:
H(z) = 1
(43.14)
and
H(z) = 1 −0.975z
−1
, (43.15)
where H(z) = 1 − P(z).
Level B
The bit rate at Level B is half as high as that at Level A. By using this level, we can obtain high-
fidelity audio sound from most high-quality sources. This level uses three filters: the st raight PCM,
c
1999 by CRC Press LLC
the first-order differential PCM, or the second-order differential PCM-1 is selected. The transfer
functions of the first two filters are the same as in Level A, and that for the second-order differential
PCM-1 mode is:
H(z) = 1 −1.796875z
−1
+ 0.8125z
−2
. (43.16)
Level C
Wecanobtainmid-fidelityaudiosoundatLevelC, andamonoauralaudio program16hours long
can be recorded on a single CD. Four filters are used for this level. The t ransfer function of the first
three filters are the same as in Level B. The transfer function of the second-order differential PCM-2
mode, used only at this level, is
H(z) = 1 −1.53125z
−1
+ 0.859375z
−2
. (43.17)
At all levels, the noise-shaping filter and the inverse-prediction-error filter in the decoder have the
same coefficients as the prediction error filter in the encoder.
43.5.3 Applications
The simple st ructure and low complexity of this CD-I/CD-ROM XA audio compression algorithm
make it suitable for applications with PCs, workstations, and video games.
References
[1] Nishiguchi, M., Akagiri, K. andSuzuki.T., A new audio bit-rate reduction systemfortheCD-I
format, Preprint 81st AES Convention, Nov. 1986.
[2] Rabiner,L.R.andSchafer,R.W.,
DigitalProcessingofSpeechSignals,Prentice-Hall,Englewood
Cliffs, NJ, 1978.
[3] Oppenhein,A.V.andSchafer,R.W.,
DigitalSignal Processing,Prentice-Hall,EnglewoodCliffs,
NJ, 1975.
43.7 ATRAC (Adaptive Transform Acoustic Coding) and
ATRAC 2
K. Tsutsui
43.7.1 ATRAC
ATRAC is a coding system designed to meet the following criteria for the MiniDisc system:
• Compressionof16-bit44.1-kHzaudio(705.6kbps)into146kbpswithminimalreduction
in sound quality.
• Simple hardware implementation suitable for portable players and recorders.
Block diagrams of the encoder and decoder structures are shown in Figs. 43.15 and 43.16, respec-
tively. The time-frequency analysis block of the encoder decomposes the input signal into spectral
coefficients grouped into 52 block floating units (BFUs). The bit allocation block divides the avail-
ablebitsamongtheBFUsadaptivelybasedonthe psychoacoustics. Thespectrumquantizationblock
normalizes spectral coefficients with the scale factor given to each BFU, and then quantizes each
c
1999 by CRC Press LLC
FIGURE 43.15: ATRAC encoder.
FIGURE 43.16: ATRAC decoder.
of them to the specified word length. These processes are performed in every sound unit, a block
consisting of 512 samples per channel.
In order to generate the BFUs, the time-frequency analysis block first divides the input signal into
three subbands. And then, each of these subbands is transformed into the frequency domain by
modified discrete cosine transform (MDCT), producing a set of spect ral coefficients. Finally, these
spectralcoefficientsarenonuniformlygroupedintoBFUs. Thesubbanddecompositionisperformed
using cascaded 48-tap quadrature mirror filters (QMFs). The input signal is divided into upper and
lower frequency bands by the first QMF, and then, the lower-frequency band is divided again by a
second QMF. While the output samples of each filter are decimated by two, the aliasing caused by
the subband decomposition is cancelled during reconstruction, due to the use of QMFs. MDCT
block length is adaptively determined based on the signal characteristics in each band. There are
two block-length modes: long mode (11.6 msec for f
s
= 44.1 kHz) and short mode (1.45 ms in
the high frequency band, 2.9 ms in the others). Normally, long mode is chosen, as this provides
good frequency resolution. However, problems occur during attack portions of the signal since the
quantization noise is spread over the entire block and the initial quantization noise is not masked by
simultaneous masking . In order to prevent this degradation known as pre-echo, ATRACswitches to
short mode when it detects an attack signal. In this case, as the noise before the attack exists only for
a very short period of time, it is masked by backward masking. The window form is symmetric for
both long and short modes, and the window form in the non-zero-nor-one region of the long mode
is the same as that of the short mode. Although this window form is somewhat disadvantageous to
the separability of the spectrum, it brings the following merits:
• The transform mode can be determined based only on the existence of an attack signal
in the cur rent sound unit, and hence, no extr a buffer is required in the encoder.
• A smaller size of buffer memory is required to store the overlapped samples for the next
sound unit in the encoder and decoder.
The mapping structure of ATRAC is summarized in Fig. 43.18.
c
1999 by CRC Press LLC
FIGURE 43.17: ATRAC time-frequency analysis.
FIGURE 43.18: ATRAC mapping structure.
43.7.2 ATRAC2
The ATRAC2system,takingadvantageofthe progressinLSI technologies, allows audio signalsof 16
bits per sample with a sampling frequency of 44.1 kHz (705.6 kbps) to be compressed to 64 kbps,
sacrificing almost no audio quality. It was designed focusing on efficient coding of tonal signals, as
the human ear is very sensitive to distortions in such signals.
Block diagrams of the encoder and decoder structures are shown in Figs. 43.19 and 43.20.The
encoder extracts psychoacoustically important tone components from the input signal spectra in
order to encode them separately from the other less important spectrum data in an efficient way. A
tonecomponentisagroupof consecutivespectralcoefficientsandisdefinedwithseveralparameters
including its location and width data. The remaining spectral coefficients are grouped into 32 non-
uniform BFUs. Both the tone components and the remaining spectral coefficients may be encoded
with Huffman coding, which is shown in Table 43.3 and for which simple decoding with a look-up
table is practical due to its small size. Although the quantization step number is limited to 63, high
S/Nratio can be obtained by repeatedlyextracting tonecomponentsfrom the same frequency range.
The mapping structure of ATRAC2 is shown in Fig. 43.21. The frequency resolution is twice that
c
1999 by CRC Press LLC
FIGURE 43.19: ATRAC2 encoder.
FIGURE 43.20: ATRAC2 decoder.
TABLE 43.3 Huffman Code Table
Quantization Dimension Maximum Look-up table
ID step number (spectr. num.) code length size
01 — — —
13 2 5 32
25 1 3 8
37 1 4 16
49 1 5 32
515 1 6 64
6 31 1 7 128
7 63 1 8 256
Note: Total = 536
of ATRAC, and in order to secure the frequency separability, ATRAC2 performs a signal analysis
using a combination of a 96-tap polyphase quadrature filter (PQF) and a fixed-length 50%-overlap
MDCTwhoseforwardandbackwardwindowformsaredifferentfromeachother. ATRAC2prevents
pre-echobyamplifying the signal precedingan attack adaptively before transforming it intospectral
coefficients in the encoder and restoring it to the original level after the inverse transform in the
decoder. This technique, called gain control, simplifies the spectral structure of the system.
The subband decomposition realizes frequency scalability; decoders with smaller complexity can
be constructed by simply decoding only lower-band data. Use of PQF lowers the computational
complexity.
c
1999 by CRC Press LLC
FIGURE 43.21: ATRAC2 mapping structure.
FIGURE 43.22: ATRAC2 time-frequency analysis.
c
1999 by CRC Press LLC
References
[1] Kayanuma, A. et al., An integrated 16 bit A/D converter for PCM audio systems, ISSCC Dig.
Tech. Papers,
pp. 56-57, Feb. 1981.
[2] Plassche, R.J. et al., A monolithic 14 bit D/A converter.,
IEEE J. Solid State Circuits, SC-14,
552-556, 1979.
[3] Naus, P.J.A. et al., A CMOS stereo 16 bit D/A converter for digital audio,
IEEE J. Solid State
Circuits,
SC-22, 390-395, June 1987.
[4] Hauser, M.W., Overview of oversampling A/D converters, an audio Engineering Society
Preprint #2973, 1990.
[5] Matsuya,Y. etal.,A 16-bitoversamplingA toD conversiontechnology usingtriple-integration
noise shaping,
IEEE J. Solid State Circuits, SC-22, 921-929, Dec. 1987.
[6] Schouwenaars, H.J. et al., An oversampling multibit CMOS D/A converter for digital audio
with 115dB dynamic range,
IEEE J. Solid State Circuits, SC-26, 1775-1780, Dec. 1991.
[7] Maruyama, Y. et al., A 20-bit stereo oversampling D to A converter,
IEEE Trans. on Consumer
Electronics,
39, 274-276, Aug. 1993.
c
1999 by CRC Press LLC