A study on a ranking method for the provincial road traffic safety index in vietnam
Bạn đang xem bản rút gọn của tài liệu. Xem và tải ngay bản đầy đủ của tài liệu tại đây (4.85 MB, 102 trang )
VIETNAM NATIONAL UNIVERSITY, HANOI
VIETNAM JAPAN UNIVERSITY
VU THI HUONG KHUE
A STUDY ON A RANKING METHOD FOR
THE PROVINCIAL ROAD TRAFFIC
SAFETY INDEX IN VIETNAM
MASTER’S THESIS
VIETNAM NATIONAL UNIVERSITY, HANOI
VIETNAM JAPAN UNIVERSITY
VU THI HUONG KHUE
A STUDY ON A RANKING METHOD FOR
THE PROVINCIAL ROAD TRAFFIC
SAFETY INDEX IN VIETNAM
MAJOR: INFRASTRUCTURE ENGINEERING
CODE: 8900201.04QTD
RESEARCH SUPERVISOR:
Assoc. Prof. VU HOAI NAM
Hanoi, 2021
COMMITMENT
I pledge that this thesis is my own intellectual product. The thesis was conducted with
integrity and no data has ever been published in any other works.
Hanoi, July the …., 2021
Author
Vu Thi Huong Khue
ACKNOWLEDGEMENT
I would first like to thank my thesis supervisor Assoc. Prof. Vu Hoai Nam of the
Department of Highway and Traffic engineering at National University of Civil
Engineering. The door to Assoc. Prof. Vu Hoai Nam office was always open whenever
I ran into a trouble spot or had a question about my research or writing. He
consistently allowed this paper to be my own work, but steered me in the right the
direction whenever he thought I needed it.
I would also like to acknowledge the experts as the second readers of this thesis: Prof.
Dr. Sci. Nguyen Dinh Duc – Director of the Infrastructure Engineering program at
Vietnam Japan University; Prof. Hironori Kato – Co-Director of the Infrastructure
Engineering program at Vietnam Japan University; Dr. Phan Le Binh – Lecturer of the
Infrastructure Engineering program at Vietnam Japan University; Prof. Shinichi
Takeda – Lecturer of the Infrastructure Engineering program at Vietnam Japan
University; and other lecturers of the Infrastructure Engineering program at Vietnam
Japan University. Without their valuable comments, this research could not have been
successfully conducted.
Finally, I must express my very profound gratitude to my parents and to my boyfriend
for providing me with unfailing support and continuous encouragement throughout my
years of study and through the process of researching and writing this thesis. This
accomplishment would not have been possible without them.
Thank you.
Author
Vu Thi Huong Khue
CONTENTS
LIST OF TABLES
LIST OF FIGURES
LIST OF ABBREVIATIONS
CHAPTER 1. INTRODUCTION................................................................................. 1
1.1. Overview ........................................................................................................... 1
1.2. Background ....................................................................................................... 1
1.3. Problem statement ............................................................................................. 3
1.4. Goals and objectives .......................................................................................... 4
1.5. Study methodology ............................................................................................ 4
1.6. Thesis organization ............................................................................................ 4
1.7. Findings and Research contributions.................................................................. 5
CHAPTER 2. LITERATURE REVIEW ...................................................................... 6
2.1. Vietnam road safety in the recent years.............................................................. 6
2.1.1. Road safety statistics ................................................................................... 6
2.1.2. Current road safety ranking by Vietnamese Government ........................... 12
2.2. Literature Review on Road safety ranking methods ......................................... 18
2.2.1. Analytic hierarchy process (AHP) method................................................. 18
2.2.2. Data Envelopment Analysis (DEA) method .............................................. 19
2.2.3. Statistical method ...................................................................................... 20
2.2.4. Delphi method ........................................................................................... 21
2.2.5. Weighting method ..................................................................................... 22
2.2.6. Aggregation method .................................................................................. 23
2.2.7. Several studies by Vietnamese researchers ................................................ 24
2.3. Summary ......................................................................................................... 25
CHAPTER 3. METHOD DEVELOPMENT.............................................................. 26
3.1. The requirements of the new method in the context of Vietnam....................... 26
3.2. The selection of new road safety performance indicators for the model ........... 27
3.2.1. The requirements of the proposal indicators .............................................. 27
3.2.2. Type of indicators...................................................................................... 27
3.2.3. The proposal indicators ............................................................................. 29
3.3. Ranking Model Development .......................................................................... 30
3.3.1. Research’s hypothesis ............................................................................... 30
3.3.2. Ranking principles ..................................................................................... 31
3.4. The method procedure ..................................................................................... 31
CHAPTER 4. MODEL PERFORMANCE ................................................................ 34
4.1. Data collection ................................................................................................. 34
4.1.1. Traffic accident data source ....................................................................... 34
4.1.2. Population data source ............................................................................... 34
4.2. Data description ............................................................................................... 34
4.3. Data treatment ................................................................................................. 37
4.4. Model performance.......................................................................................... 39
4.5. Results score ranking ....................................................................................... 44
CHAPTER 5. MODEL EVALUATION .................................................................... 48
5.1. The DEA as the reference method ................................................................... 48
5.1.1. Reasons of choosing DEA model .............................................................. 48
5.1.2. DEA Methodology .................................................................................... 48
5.1.3. Results DEA score ranking ........................................................................ 49
5.2. Comparison and Discussion ............................................................................. 52
CHAPTER 6. CONCLUSIONS AND RECOMMENDATIONS ............................... 55
6.1. Conclusions ..................................................................................................... 55
6.2. Limitations ...................................................................................................... 55
6.3. Recommendations and further studies.............................................................. 55
REFERENCES .......................................................................................................... 56
APPENDIXES........................................................................................................... 59
LIST OF TABLES
Page
Table 2.1: The percentage changing of road traffic accidents, deaths and injuries due to
RTAs from 2016 to 2018 ........................................................................................... 10
Table 2.2: List of criticized provinces by the Deputy Prime Minister ......................... 12
Table 3.1: Road traffic accidents statistics characteristics .......................................... 29
Table 3.2. Risk indicators characteristics ................................................................... 30
Table 4.1: Data category ............................................................................................ 34
Table 4.2: List of provinces stayed in low position in increasing RSIs or tend to reduce
RSIs but still being in the Government's criticism list (2016-2018) ............................ 36
Table 4.3: List of provinces and cities having sudden increase/decrease in statistics
from 2016 to 2018 ..................................................................................................... 37
Table 4.4: z-value transforming of 63 Vietnamese provinces from 2016 to 2018 (R1) 40
Table 4.5: z-value transforming of 63 Vietnamese provinces from 2016 to 2018 (R2) 41
Table 5.1: Input and output data for DEA method...................................................... 48
Table 0.1: The denominators Nij of the data set in 2016 ............................................. 77
Table 0.2: The denominators Nij of the data set in 2017 ............................................. 79
Table 0.3: The denominators Nij of the data set in 2018 ............................................. 81
i
LIST OF FIGURES
Pages
Figure 2.1: Mean and standard deviation of Total number of road traffic accidents,
total number of deaths and injuries due to RTAs from 2016 to 2018 ............................ 6
Figure 2.2: Twenty provinces and cities having the highest and the lowest total number
of road traffic accidents, total number of deaths and injuries due to RTAs in 2016 ...... 7
Figure 2.3: Twenty provinces and cities having the highest and the lowest total number
of road traffic accidents, total number of deaths and injuries due to RTAs in 2017 ...... 8
Figure 2.4: Twenty provinces and cities having the highest and the lowest total number
of road traffic accidents, total number of deaths and injuries due to RTAs in 2018 ...... 9
Figure 2.5: Road safety factors trend in 63 provinces nationwide from 2016 to 2018. 13
Figure 2.6: The distribution chart of road traffic accidents, deaths and injuries due to
road traffic accidents and population of 63 provinces and cities nationwide in 2018 .. 14
Figure 2.7: The distribution chart of road traffic accidents, deaths and injuries due to
road traffic accidents and car registered of 63 provinces and cities nationwide in 2018
.................................................................................................................................. 15
Figure 2.8: The distribution chart of road traffic accidents, deaths and injuries due to
road traffic accidents of 63 provinces 2016-2018 ....................................................... 17
Figure 3.1: Normal distribution color and scale for road safety ranking principles ..... 31
Figure 3.2: Research methodology flowchart ............................................................. 33
Figure 4.1: Distribution chart of RTAs, F and J from the smallest to the largest in 63
provinces nationwide (2016-2018) ............................................................................. 35
Figure 4.2: Distribution chart of R1 in 63 provinces and cities nationwide (2016-2018)
.................................................................................................................................. 38
Figure 4.3: Distribution chart of R2 in 63 provinces and cities nationwide (2016-2018)
.................................................................................................................................. 39
Figure 4.4: z-values distribution of R1 on control chart .............................................. 43
Figure 4.5: z-values distribution of R2 on control chart .............................................. 43
Figure 4.6: z-score and rank of 63 provinces from 2016 to 2018 by using R1 ............. 44
Figure 4.7: z-score and rank of 63 provinces from 2016 to 2018 by using R2 ............. 45
Figure 4.8: Road safety distribution map in 63 provinces from 2016 to 2018 by
ranking R1 .................................................................................................................. 46
Figure 4.9: Road safety distribution map in 63 provinces from 2016 to 2018 by
ranking R2 .................................................................................................................. 47
Figure 5.1: DEA score and rank of 63 provinces from 2016 to 2018 .......................... 50
Figure 5.2: Road safety distribution map in 63 provinces from 2016 to 2018 by using
DEA method .............................................................................................................. 51
ii
LIST OF ABBREVIATIONS
WHO
M.O.T
M.P.S
N.T.S.C
AHP
DEA
RTAs
RSIs
RS
F
J
S.D.
World Health Organization
Ministry of Transport
Ministry of Public Security
National Traffic Safety Committee
Analytic Hierarchy Process
Data Envelopment Analysis
Road traffic accidents
Road safety indicators/indices
Road safety
Fatalities/Deaths
Injuries/Injured people
Standard deviation
iii
CHAPTER 1. INTRODUCTION
1.1. Overview
Road safety is an essential element of daily life and the government or public agencies
are constantly drove to assure that their citizens can take place without incident.
Nonetheless, road traffic accidents currently act as the 9th leading cause of fatality in
the world (roughly 1.35 million deaths per year due to road traffic collisions) (WHO,
2018). [1]
On the one hand, to assess the effort of each nation as well as each area in ensuring
road safety, countries use road safety indicators as a ranking scale. As the result,
experts and specialists study and develop policies, indices to improve and ensure road
safety. [1]
Vietnam has been applying simple indicators to indicate the road safety performance
of the provinces and the cities. However, these indicators have shown the evidence of
drawbacks and need to be adjusted or replaced to achieve better evaluations on the
national and regional road safety level.
1.2. Background
Safety can be simply illustrated as the nonappearance of a hazard or vulnerability. In
the field of transportation, road safety can be defined by the human capacity in moving
freely without injury or fatality. An admirably harmless traffic network would not
occur collisions within differing travelers. Although non-accident is an excellent
situation in theory and various transportation offices set a goal of zero fatalities on
routes, people endure getting wounded or died on paths and roadways along the
country. The objection offer in the road safety course is to reduce the density of road
collisions and the following fatalities and wounds by fully applying presently possible
instruments, expertise, and technology. [1]
In additions, road safety experts usually assess safety by the amount and proportion of
traffic collisions and by the severity of those accidents, which represented by three
parameters: crash frequency, crash rates and crash outcomes. In the simplest terms,
1
crash frequency is the total road accidents appearing per year or another time unit.
Meanwhile, crash rates are the road collisions standardized by a specific group of
people or metric of exposure. For example, crashes per 100,000 people; crashes per
miles traveled, etc. Crash outcomes can be determined by the kinds of injuries suffered
to the crashes’ victims, ordinarily classified by the casualties and fatalities. [1]
There are three factors influence the road traffic accidents and safety: exposure,
accident rate and injury severity (Nilsson, 2002).
Exposure stands for the amount of movements in which accidents may take place. The
traffic volume frequently attributes the travelling turns, calling the number of people
per kilometer of driving achieved. Therefore, any individual activity is displayed the
hazard of collision, in particular the road traffic accidents. [2]
It is evident that people have many ways to circulate: walking, by bike, by car, by
public transport, etc. However, these ways absolutely not affect the similar accidents
stage. Therefore, the chosen exposure is a condition that affect to the number of deaths
and injured people in road crashes. Moreover, the danger threat to the road users is
possibly depended on different means of traffic transport. For instance, the lower the
hazard of accident to walkers, the higher the rate of pedestrians in traffic participating.
[2]
Accident rate is the threat of accident per unit of exposure and is a statistical factor of
traffic collisions. Despite the fact that an accident rate is not similar to a probability
estimation, it is an effective parameter because the accident probability can be
considered to be proportional to the accident rate, in the theoretical meaning. In fact,
the greater the accident percentage, the greater the probability of an accident on a trip.
Occasionally, the definitions of “risk of accident”, “level of risk”, or “accident risk”
will be synonymous with accident rate. Moreover, the accident rate is not independent
on the exposure although it is defined per unit of exposure. Admirably, an exposure
must be characterized when it is separated with the accident rate. Unfortunately, this
argument is still in theory. [2]
Additionally, the probability of traffic collision is influenced by a huge amount of risk
indicators associating the traffic system elements, including infrastructure and traffic
2
control devices, vehicles and road users. An accident risk indicator is any factor
raising the probability of traffic collisions. In another word, although risk indicators
are demographically linked to the probability of accidents, but not all of them can be
observed as road collisions causes. [2]
Injury severity hand over the accident’s consequence in terms of injured people or
property damage. In theory, the harshness of an accident outcome is a continuous
variable extending from the tiniest obstacle to accidents with numerous deaths. In
reality, elementary scales, assuming just several disconnected values, are frequently
created to illustrate collision or harm severity. For example, administrator road
collision data in almost nations categorize road traffic crash by severity in consonance
with the simple scale below: fatal accident, accident resulting in serious injury,
accident resulting in slight injury and property damage accidents. However, this raw
classification is not commensurate between nations and regions. [2]
1.3. Problem statement
Recently, the increasing number of fatalities and injuries caused by the road traffic
accident is still a complicated problem that each country has to cope with. An average
of 1.3 million people dies and between 20 and 50 million people are injured in road
traffic accidents each year (WHO, 2018). This report shows that road traffic injuries
are in a great concern to the community, especially for underdeveloped and developing
countries. [3]
Vietnam is the country having a high rate of 23.4 fatalities per 100,000 capitals due to
traffic accidents (WHO, 2018). In the recent years, Vietnam puts a lot of effort to
struggling with the deduction of human loss in road safety. The common approaches
that the Vietnamese government has been applying are the 5Es namely Engineering,
Enforcement, Education, Economics and Enablement. One of the issues in term of
Engineering is the accident statistics and the road safety ranking to serve for the
monitoring the national road safety trend as well as the measurement of local authority
in road safety.
Although road safety ranking is very important, but there are a number of issues that
should be sold in Vietnam. These are:
3
The inconsistency of the current ranking method that has been used by the country
The naïve road safety indicators
The lacking of sound scientific and engineering bases to pointing out the blackspot
road accident at the provincial level.
Because of these reasons, the research on a new ranking method is necessarily, and
this is also the aim of my study.
1.4. Goals and objectives
The general objective of this research is to propose a new method capable of
enhancing the accuracy of road safety ranking in Vietnam. The specific objectives are:
To propose new road safety indicators to replace the ones that have been using by
the M.O.T.
To propose a new method that would help to classify the best and the worst
provinces in term of road safety performance and achievements.
1.5. Study methodology
The research particularly proposes a ranking method basing on statistical process
control theory. The road safety database in the period from 2016 to 2018 was collected
and then processed and used as inputs for the developed model. New principles of
ranking based on the new road safety indicators have been applied to classify the road
safety of each province of the country.
1.6. Thesis organization
The dissertation includes four chapters excluding introduction and conclusion parts.
Chapter 1 analyses the road safety statistics and the current situation of road safety
ranking in Vietnam. The road safety ranking methods applied worldwide are also
mentioned in the literature review.
Chapter 2 presents the model development including the section of new road safety
indicator, the hypothesis, the ranking methodology, and the procedure to develop
the model.
Chapter 3 shows the data collection and data treatments.
4
Chapter 4 proves the model’s ranking performance in comparison with another
model which is considered to be a good ranking one. Some discussions on the
proposal model are also in this chapter.
1.7. Findings and Research contributions
Proven the limitations of the current ranking method and pointed out the needs of a
new alternative method.
The proposed road safety indicators in this research partially take into account the
local socio-economic characteristics.
The proposed method has capability of ranking the provincial road safety with a
statistically significant confidence level.
The proposed method is simple, easy to apply and understand for the current
statistics level among local officials.
5
CHAPTER 2. LITERATURE REVIEW
2.1. Vietnam road safety in the recent years
2.1.1. Road safety statistics
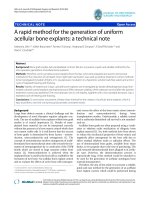
Figure 2.1 presents road safety of Vietnam from 2016 to 2018. As shown in the figure,
the number of accidents in the nation are slightly decreasing year by year.
Figure 2.1: Mean and standard deviation of Total number of road traffic accidents,
total number of deaths and injuries due to RTAs from 2016 to 2018
(Source: Modified data from Traffic Police Department – Ministry of Public Security)
To have further pictures of the road safety in Vietnam in general and its provinces in
particular, we processed the raw data and we show here 10 top highest and lowest
provinces and cities in term of road traffic accidents. As shown in the figures, HCM
city, Ha Noi, Binh Duong were constantly the top 3 most dangerous cities in term of
human losses. Four other provinces (e.g. Vung Tau, Dak Lak, Gia Lai, Binh Thuan)
were also in this list three years consecutively. In the lowest side, most of the names in
the list are the remote regions and low-income provinces.
6
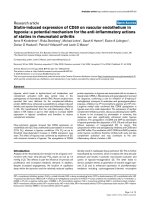
Figure 2.2: Twenty provinces and cities having the highest and the lowest total number
of road traffic accidents, total number of deaths and injuries due to RTAs in 2016
(Source: Modified data from Traffic Police Department – Ministry of Public Security)
7
Figure 2.3: Twenty provinces and cities having the highest and the lowest total number
of road traffic accidents, total number of deaths and injuries due to RTAs in 2017
(Source: Modified data from Traffic Police Department – Ministry of Public Security)
8
Figure 2.4: Twenty provinces and cities having the highest and the lowest total number
of road traffic accidents, total number of deaths and injuries due to RTAs in 2018
(Source: Modified data from Traffic Police Department – Ministry of Public Security)
9
In a closer look, Table 2.1 presents the provinces which had the number of fatalities
(F), injuries (J) and road traffic accidents (RTAs) simultaneously increased during the
time from 2016 to 2018.
Table 2.1: The percentage changing of road traffic accidents, deaths and injuries due to
RTAs from 2016 to 2018
Year
Provinces
2016-2017
2017-2018
RTAs
Deaths
Injuries
RTAs
Deaths
Injuries
An Giang
3.03%
8.51%
-5.00%
-25.32%
-23.68%
-46.34%
Binh Đinh
-16.33%
-16.05%
-15.98%
-15.83%
-8.00%
-20.99%
Binh Duong
-26.48%
-0.93%
-10.62%
-1.14%
-4.18%
-1.07%
Binh Phuoc
-1.68%
-0.59%
-13.58%
-2.77%
-1.80%
-9.05%
Binh Thuan
-12.85%
-6.28%
-22.44%
-18.57%
6.69%
-31.05%
Ba Ria-V.Tau
-8.24%
-1.16%
-12.40%
-10.23%
-9.32%
-28.57%
Bac Giang
-6.86%
-9.88%
-7.34%
57.76%
67.60%
51.90%
Bac Kan
-33.33%
-61.90%
-12.00%
19.40%
27.59%
11.76%
Bac Ninh
-5.26%
-2.30%
-13.95%
-4.59%
-2.35%
-10.26%
Bac Lieu
-23.08%
-19.44%
-44.74%
-26.83%
-33.33%
-26.67%
Ben Tre
-5.86%
2.54%
-26.32%
-8.33%
-1.03%
-27.73%
Ca Mau
-72.63%
-19.23%
-80.00%
-38.76%
-8.33%
-55.91%
Cao Bang
-67.03%
-20.93%
-76.53%
2.15%
10.42%
2.00%
Can Tho
30.98%
16.13%
41.18%
-6.36%
16.96%
-33.86%
Dak Lak
6.10%
10.07%
-3.62%
-22.08%
-5.51%
-23.21%
Da Nang
-19.64%
-20.00%
-25.00%
-20.43%
-20.69%
-20.63%
Dac Nong
-10.40%
-1.61%
-7.41%
-14.68%
-6.90%
-5.88%
Dong Nai
-12.30%
-13.52%
-10.97%
-3.68%
-8.91%
-4.41%
Dong Thap
-20.24%
-7.91%
-25.22%
-12.00%
-6.92%
-59.72%
Dien Bien
-2.17%
-12.90%
0.00%
-6.98%
-19.23%
-5.26%
Gia Lai
-6.34%
-0.82%
-8.46%
-0.99%
-0.41%
-9.49%
Ha Giang
-51.43%
-22.73%
-158.82%
-45.83%
-46.67%
-30.77%
Ha Nam
-6.02%
-3.90%
-7.06%
-2.31%
-2.67%
-7.59%
Ha Noi
-6.95%
0.00%
-15.84%
-6.75%
-5.64%
-22.84%
Ha Tinh
-27.08%
-14.93%
-28.95%
-2.13%
-2.29%
-5.56%
Hai Duong
-4.03%
-15.34%
5.03%
-4.64%
13.76%
-19.55%
Hai Phong
-1.01%
3.33%
-2.04%
-2.06%
-8.43%
-22.50%
Hau Giang
31.62%
26.76%
24.59%
-7.34%
21.98%
-12.96%
Hung Yen
-7.84%
1.75%
-5.61%
-2.00%
-2.70%
0.00%
Hoa Binh
-0.93%
-1.20%
-2.35%
-0.93%
2.35%
-3.66%
Khanh Hoa
-6.33%
1.39%
-80.77%
-12.86%
-1.41%
-44.44%
Kien Giang
-15.49%
-24.30%
-44.59%
-7.04%
12.30%
-10.45%
Kon Tum
-2.78%
-1.32%
0.00%
-4.35%
-22.58%
3.13%
Lam Đong
-7.54%
-1.46%
-35.16%
0.00%
-3.79%
5.19%
10
Year
Provinces
2016-2017
2017-2018
RTAs
Deaths
Injuries
RTAs
Deaths
Injuries
Lao Cai
-5.93%
-14.04%
-1.28%
-53.41%
-23.91%
-60.82%
Lang Son
-16.22%
-8.62%
-82.93%
-23.33%
-9.43%
0.00%
Lai Chau
20.27%
15.00%
31.52%
-15.63%
18.37%
-27.78%
Long An
-22.18%
-7.58%
-30.00%
-22.77%
-16.81%
-24.26%
Nam Dinh
-6.52%
1.59%
0.00%
-0.73%
-5.00%
-3.20%
Nghe An
-1.37%
-0.53%
-5.45%
-1.04%
-5.59%
-2.33%
Ninh Binh
-1.66%
-4.00%
-2.84%
-7.10%
-13.64%
-9.30%
Ninh Thuan
-29.62%
-24.07%
-28.18%
-42.08%
6.90%
-48.19%
Phu Tho
-4.17%
-1.56%
-4.04%
-15.38%
-3.23%
-59.68%
Phu Yen
-13.90%
-4.96%
-33.70%
-31.18%
-34.44%
-20.67%
Quang Binh
-6.49%
-1.94%
-21.99%
-7.94%
0.96%
-19.38%
Quang Nam
-3.31%
-2.63%
-4.29%
-12.04%
2.56%
-22.63%
Quang Ngai
-3.52%
-3.50%
-9.47%
-51.65%
-1.42%
-65.32%
Quang Ninh
-17.09%
-30.65%
-19.42%
0.00%
6.06%
-0.98%
Quang Tri
-7.88%
10.43%
-24.58%
-7.98%
5.74%
-24.31%
Son La
-10.37%
-24.66%
3.01%
-8.87%
-1.39%
-27.88%
Soc Trang
-9.78%
10.28%
-13.15%
0.00%
-0.94%
-10.36%
Tay Ninh
-1.80%
1.59%
-3.82%
30.13%
34.38%
16.93%
Thai Binh
-14.37%
-1.52%
-12.68%
-27.94%
-1.54%
-36.54%
Thai Nguyen
-4.57%
-8.64%
-4.00%
-1.74%
-5.19%
-2.74%
Thanh Hoa
-4.57%
-13.29%
-2.63%
-11.63%
-6.04%
-14.57%
Thua Th.Hue
-8.51%
-5.47%
-15.07%
2.29%
11.72%
-5.04%
Tien Giang
-5.69%
7.81%
-31.25%
-15.76%
-14.96%
-17.07%
H.C.M city
-0.39%
-13.19%
-8.17%
-6.73%
-0.43%
-17.64%
Tra Vinh
-23.85%
-11.43%
-38.32%
-18.48%
-2.94%
-52.86%
Tuyen Quang
35.92%
18.31%
50.00%
-21.37%
-36.54%
-37.61%
Vinh Long
-15.77%
-2.19%
-41.37%
-17.72%
-7.87%
-22.06%
Vinh Phuc
-2.27%
-2.78%
-48.89%
-7.32%
-9.09%
-25.00%
Yen Bai
-3.83%
0.00%
-2.03%
-7.73%
-6.38%
-7.89%
(Source: Traffic Police Department – M.P.S)
Every year, the Government criticizes the provinces for having bad record in road
safety. The criteria for the criticism are the high number of fatalities and the increasing
of total road accidents in comparison with that number of the last year. For example,
Table 2.2 shows the list of such the provinces from 2016 to 2018.
11
No.
1
2
3
4
5
6
7
8
Table 2.2: List of criticized provinces by the Deputy Prime Minister
2016-6/2017
2017-9/2018
(Increase > 15%)
(Increase > 30%)
(Increase > 20%)
Yen Bai
An Giang
Dak Nong
Hai Phong
Quang Tri
Hau Giang
Khanh Hoa
Can Tho
Hai Duong
Hau Giang
Lai Chau
Quang Nam
Gia Lai
Lai Chau
Ha Nam
Cao Bang
Tay Ninh
Bac Giang
(Source: Office of the Government (GO))
2.1.2. Current road safety ranking by Vietnamese Government
The Vietnamese Government currently uses a simple assessment in provincial road
safety reports. It is an evaluation of the increase percentage of three indicators in terms
of fatalities (F), injuries (I), and road traffic accidents (RTAs) by a quarter per year to
review and critique the road safety of provinces and cities nationwide as mentioned in
Section 2.1.1. Specifically, a region that is considered to have road safety problems, is
where the indicators below increase 15% or more than those comparing to the same
period last year (Fig.2.5).
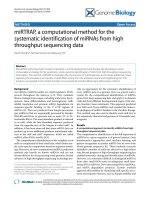
However, this assessment does not consider other relevant factors such as geographic,
socioeconomic, or transportation characteristics of each province. Therefore, this
creates the following inadequacies:
Firstly, on the one hand, the provinces and cities having an enormous population, a
high traffic transport density and a complex road network, are often documented in the
list of provinces with poor road safety level. For example, Hanoi and HCM city (Fig.
2.6 and 2.7) have a large population and vehicles, so the number of road traffic
accidents, deaths and injuries is evidently the highest among the 63 provinces
nationwide, in addition.
12
Figure 2.5: Road safety factors trend in 63 provinces nationwide from 2016 to 2018
(Source: Graphics are created by the author, Data from Traffic Police Department – Ministry of Public Security)
13
Figure 2.6: The distribution chart of road traffic accidents, deaths and injuries due to road traffic accidents and population of 63 provinces
and cities nationwide in 2018
(Source: Graphics are created by the author, Data from Traffic Police Department – Ministry of Public Security)
14
Figure 2.7: The distribution chart of road traffic accidents, deaths and injuries due to road traffic accidents and car registered of 63
provinces and cities nationwide in 2018
(Source: Graphics are created by the author, Data from Traffic Police Department – Ministry of Public Security)
15
On the other hand, when comparing Hanoi with some low populated regions whose
population 4.3 times lower than Hanoi, but representing road traffic accidents per
capita 1.3 times higher than that of Hanoi, in 2018. Therefore, is it really fair to rank
Hanoi as a more “dangerous” city than Tien Giang in terms of road safety? Moreover,
once this ranking process is continuously maintained, big and densely populated areas
such as Hanoi, HCM city... will always be in the “bad” group regardless of their
efforts in ensuring local road safety. In addition, this ranking method also gives a
“misunderstanding” picture of the road safety situation in small provinces with small
population and creates the subjectivity in ensuring local road safety.
Secondly, the current assessment indicators in Vietnam lack consistency in ranking.
Observing Figure 2.8 and comparing the road safety situation of two provinces: Bac
Kan and Bac Ninh. It emerges that Bac Kan is less safe than Bac Ninh because it
shown higher number of road traffic accidents and deaths in 2018. In contrast, Bac
Ninh is a more dangerous city as it shows higher RTAs.
It should be noted that the simple using of three indicators F, J and RTAs in road
safety assessment occurs these above inadequacies due to the indicators’ naïve
characteristics and inappropriate application.
Last but not least, the current method has not pointed out which province is a “black
spot” in terms of road safety, as well as there is no robustness scientific bases to assess
and rank road safety in Vietnam. Therefore, the research questions are “Whether a
region basing on single criteria such as F, J, or RTAs, is actually more “dangerous” at
a statistical significance level than that having lower statistics?” and “Which area is
considered as "black spots" in road safety at the provincial level?
16