Unit 16 The Association of Southeast Asian Nations
Bạn đang xem bản rút gọn của tài liệu. Xem và tải ngay bản đầy đủ của tài liệu tại đây (2.72 MB, 35 trang )
TO OUR CLASS
Presented by Nguyen THI Thanh Ha
Nguyen Tat Thanh high school
Types of charts
pie chart
line chart
Bar/ column chart
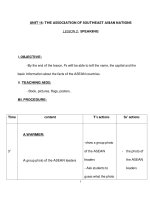
Lead-in
Today we are going to
describe a chart.
Unit 16:
historicAl
places
PERIOD 103
Lesson 4: writing
VISITOR ARRIVALS IN VIETNAM IN 2001 AND 2002
(From the USA, France, and Australia)
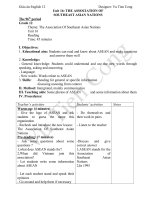
VISITOR ARRIVALS IN VIETNAM
(From the USA, France and Australia)
300000
259,967
250000
230,470
200000
150000
99,700
84,085
USA
FRANCE
96,624 AUSTRALIA
111,546
100000
50000
0
2001
2002
(Source: Vietnam National Administration, 2002)
VISITOR ARRIVALS IN VIETNAM
(From the USA, France and Australia)
300000
250000 USA
200000
FRANCE
150000
AUSTRALIA
100000
50000
0
2001
2002
(Source: Vietnam National Administration, 2002)
VISITOR ARRIVALS IN VIETNAM
(From the USA, France and Australia)
300000
259,967
250000
230,470
200000
150000
99,700
84,085
111,546
96,624
100000
50000
0
2001
2002
(Source: Vietnam
National Administration,
2002)
USA
FRANCE
AUSTRALIA
1. According
to the chart,
the USA had
the biggest
number of
visitors to
Vietnam in
2001.
VISITOR ARRIVALS IN VIETNAM
(From the USA, France and Australia)
300000
259,967
250000
230,470
200000
150000
99,700
84,085
111,546
96,624
100000
50000
0
2001
2002
(Source: Vietnam
National Administration,
2002)
USA
FRANCE
AUSTRALIA
2. 99,700
French
visitors
arrived in
Vietnam in
2001.
VISITOR ARRIVALS IN VIETNAM
(From the USA, France and Australia)
300000
259,967
250000
230,470
200000
150000
99,700
84,085
111,546
96,624
100000
50000
0
2001
2002
(Source: Vietnam
National Administration,
2002)
USA
FRANCE
AUSTRALIA
3. Australia
had the
smallest
number of
visitors to
Vietnam in
2002.
VISITOR ARRIVALS IN VIETNAM
(From the USA, France and Australia)
300000
4. No, it
isn’t.
259,967
250000
230,470
200000
150000
99,700
84,085
111,546
96,624
100000
50000
0
2001
2002
(Source: Vietnam
National Administration,
2002)
USA
FRANCE
AUSTRALIA
VISITOR ARRIVALS IN VIETNAM
(From the USA, France and Australia)
300000
5. France had
more visitors
to Vietnam in
2002.
259,967
250000
230,470
200000
150000
99,700
84,085
111,546
96,624
100000
50000
0
2001
2002
(Source: Vietnam
National Administration,
2002)
USA
FRANCE
AUSTRALIA
VISITOR ARRIVALS IN VIETNAM
(From the USA, France and Australia)
300000
6. The
259,967
250000
230,470
200000
150000
99,700
84,085
111,546
96,624
100000
50000
0
2001
2002
(Source: Vietnam
National Administration,
2002)
USA
FRANCE
AUSTRALIA
number of
American
visitors to
Vietnam
increased
from 230,470
in 2001 to
259,967 in
2002.
Outline for writing a chart
1.
Opening
2. Body
3. conclusion
1. Opening
1. What does the chart
Population of Vietnam (From 2007 to 2012)
describe?
The chart shows/
presents/
2012
80
displays/
2011
79
describes…
The chart is about…
2010
78
The chart deals with…
2009
77
2008
2007
76
75
72 73 74 75 76 77 78 79 80 81
Eg: The chart presents
the population of Vietnam
from 2007 to 2012.
1. Opening
2. Where is the
Visitor Arrivals in Vietnam in 2012source of the chart
from?
18.00%
15.00%
54.00%
13.00%
(Source: Vietnam National
Administration of Tourism)
The source of the
chart is from/provided
by…
Eg: The source of the
chart is from Vietnam
National
Administration of
Tourism.
1. Opening
3. What is the main change
the chart?
Population of Vietnam (From 2007 to showed
2012)
2012
80
2011
79
2010
78
2009
77
2008
2007
76
75
72 73 74 75 76 77 78 79 80 81
In general,/Generally,/Overall,…
It can be seen from the chart
that…/ As can be seen ...
It is clear from the chart
that…
Eg: In general, the population
of Vietnam increased steadily
from 2007 to 2012.
1. Opening – adverbs to describe the speed of
change
rapidly/quickly/swiftly
(nhanh chóng)
Pollution Rate
10
9
8.9
suddenly (đột ngột)
8
7
6.8
6
Eg: The pollution rate
increased rapidly from
2009 to 2012.
5
4
3
3.4
2
1 1.2
0
2009
2010
2011
2012
1. Opening – adverbs to describe the speed of
change
steadily/gradually
Unemployment Rate
9.6
(từ từ, ổn định)
9.5 9.5
9.4
9.3
9.3
slowly (chậm)
9.2
9.1
9.1
9
8.9
8.9
8.8
8.7
8.6
2009
2010
2011
2012
Eg: The
unemployment rate
decreased gradually
from 2009 to 2012.
2. Body – structures to describe the increase
S + increase/rise/go up/climb/inflate by|to
+ number/percent
Eg: The population of Vietnam went up to
2% in 2012.
S + increase/rise/go up/climb/inflate from +
....... + to + .............
Eg: The number of endangered species
increased from 1900 to 2100.