Tài liệu MySQL Administrator’s Bible- P13 pdf
Bạn đang xem bản rút gọn của tài liệu. Xem và tải ngay bản đầy đủ của tài liệu tại đây (1.25 MB, 50 trang )
Measuring Performance
For some status variables, such as Slave_running, the current output is enough
information — either the slave is running or it is not. The Threads_connected status
variable shows how many threads are currently connected. However, for many status variables,
there is more to be done than simply looking at the value of each variable. For example, the
Slow_queries status variable provides a count of how many slow queries the system has
logged:
mysql> SHOW GLOBAL STATUS LIKE ’Slow_queries’;
+---------------+-------+
| Variable_name | Value |
+---------------+-------+
| Slow_queries | 1073 |
+---------------+-------+
1 row in set (0.00 sec)
Is it good or bad that there have been 1073 slow queries? You should investigate and optimize
all the slow queries that are logged — see the mysqldumpslow and mysqlsla tools discussed
later in this chapter for how to find slow queries, and see Chapter 18 for how to analyze
queries.
When determining the health of a system, the important data is how frequently slow queries are
happening. The Uptime status variable shows how long, in seconds, that particular mysqld has
been running:
mysql> SHOW GLOBAL STATUS WHERE Variable_name=’Slow_queries’
-> OR Variable_name=’uptime’;
+---------------+-------+
| Variable_name | Value |
+---------------+-------+
| Slow_queries | 1073 |
| Uptime
| 10906 |
+---------------+-------+
2 rows in set (0.08 sec)
The server has been up for 10906 seconds (or roughly seven and a half days);
The rate of slow queries is an average of about one slow query every 10 seconds. Ideally, you
would like to be able to see the rate of change over time. For example, the slow query information you saw earlier would indicate a problem in a database that usually has one slow query
every hour; the database administrator would be celebrated in a database that usually has one
slow query every second. Establishing a baseline for a system’s status and comparing over time
will make patterns evident and shows where problems may lurk.
One way to establish a baseline is to compare the status variables over a short period of time.
To get an average of status variables in an hour, you can compare the output of SHOW GLOBAL
STATUS taken from a server at 1 pm to the output of SHOW GLOBAL STATUS taken from the
same server at 2 pm. Instead of comparing variables to Uptime, variables are compared to each
Please purchase PDF Split-Merge on www.verypdf.com to remove this watermark.
567
17
Part III
Core MySQL Administration
other. We may find that from 1–2
are ten slow queries.
PM,
there are only two slow queries, but from 2-3
PM,
there
With about 300 status variables, manual analysis is tedious. However, no automated tool can
take into consideration the specifics of your system, and what is acceptable to your users. There
is a tradeoff to using automated tools, which may be acceptable. Even if you use an automated
tool or tools, knowing how to use SHOW GLOBAL STATUS is a key skill for a database administrator working with mysqld.
mysqltuner
The open source program mysqltuner is a Perl script that is a part of the default package
distribution for some operating systems. If it is not part of your operating system, you
can download it at www.mysqltuner.com. It can be run with no options — by default,
mysqltuner.pl connects to mysqld on localhost port 3306, and prompts for a username and
password:
shell>
./mysqltuner.pl
>> MySQLTuner 0.9.9 - Major Hayden <>
>> Bug reports, feature requests, and downloads at http://
mysqltuner.com/
>> Run with ’--help’ for additional options and output
filtering
Please enter your MySQL administrative login: username
Please enter your MySQL administrative password:
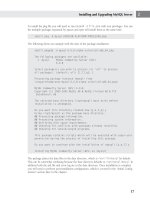
You do not need SUPER privileges in order to run the script. After entering your password,
mysqltuner analyzes mysqld and outputs four sections:
■ General Statistics
■ Storage Engine Statistics
■ Performance Metrics
■ Recommendations
Each line of information is prefixed with a code that indicates whether the check is positive,
neutral, or negative:
■ Check neutral or skipped [--]
■ Check OK [OK]
■ Warning, check not OK [!!]
Before the first section, mysqltuner will output a problem if the password provided is blank:
[!!] Successfully authenticated with no password - SECURITY RISK!
568
Please purchase PDF Split-Merge on www.verypdf.com to remove this watermark.
Measuring Performance
General Statistics
There are three checks in the General Statistics section. The first is whether or not there is
a new version of mysqltuner. This is skipped by default, but can be turned on by giving the
--checkversion flag to mysqltuner. The second check determines which version of mysqld
you are running, and whether or not that version is supported by mysqld. If you are running a
version that has been marked as end of life by Sun Microsystems, a warning will be issued. The
final check is whether or not the operating system is 64 bit.
-------- General Statistics -------------------------------------[--] Skipped version check for MySQLTuner script
[!!] Currently running unsupported MySQL version 6.0.6-alphacommunity-log
[OK] Operating on 64-bit architecture
If the system is running a 32-bit architecture with 2 GB of RAM or less, mysqltuner notes:
[OK]
Operating on 32-bit architecture with less than 2GB RAM
Otherwise, you get a warning:
[!!] Switch to 64-bit OS - MySQL cannot currenty use all of your RAM
Storage engine statistics
This section analyzes the sizes and storage engines of tables, except for tables in the mysql and
information_schema databases. At the time of this writing, mysqltuner does not give any
details about the Falcon or Maria storage engines. mysqltuner uses SHOW TABLE STATUS in
pre-5.0 database servers to determine the size of each table and whether or not the table is fragmented. With MySQL 5.0 and above, it uses the information_schema database to gather the
same information. It prints out a list of the total data stored in each table type and ends with a
count of fragmented tables.
-------- Storage Engine Statistics ----------------------------[--] Status: +Archive -BDB -Federated +InnoDB -ISAM -NDBCluster
[--] Data in MyISAM tables: 6G (Tables: 128)
[--] Data in InnoDB tables: 21G (Tables: 44)
[--] Data in MEMORY tables: 0B (Tables: 1)
[!!] Total fragmented tables: 7
It is important to note that the size of Data_length in SHOW TABLE STATUS or the information_schema database is not always accurate. For storage engines that estimate the size of their
data the size shown will be an approximation. Also, the size of indexes is not taken into consideration, so this information cannot be used to figure out how much space the database is using.
The Data_free field of either SHOW TABLE STATUS or the information schema. The TABLES
database is used to determine whether a table is fragmented or not. If Data_free is greater
Please purchase PDF Split-Merge on www.verypdf.com to remove this watermark.
569
17
Part III
Core MySQL Administration
than zero, mysqltuner considers the table fragmented. This may lead to false warnings when
using global InnoDB data files (i.e., not using innodb_file_per_table), as Data_free
shows the amount of data left in the global InnoDB data files.
If a storage engine is enabled, but there are no tables that are defined with that storage engine,
mysqltuner will issue a warning such as:
[!!] InnoDB is enabled but isn’t being used
A false positive may arise if you run mysqltuner with a user that cannot see all the tables
within mysqld, as the storage engine may actually be in use by a table that the user does not
have permissions to see.
Performance Metrics
The Performance Metrics section uses the output from SHOW GLOBAL STATUS and performs
the tedious calculations you would ordinarily do by hand. The first line gives a general overview
of mysqld:
-------- Performance Metrics -----------------------------------Up for:116d 21h 10m 14s (338M q[33.501 qps],39M conn,TX:174B,RX: 28B)
The values in the first line are simply the status variables from SHOW GLOBAL STATUS with some
formatting for better readability, as shown in Table 17-10:
TABLE 17-10
Relationships between Variables in Performance Metrics and SHOW
GLOBAL STATUS
Performance Metrics Variable
Status Variable from SHOW GLOBAL STATUS
Up for
Uptime
q
Questions
qps
qps (queries per second)
conn
Connections
TX
Bytes Sent
RX
Bytes Received
The next line gives the percentage of reads and writes, using the Com_select status variable
as the number of reads, and the sum of the Com_delete, Com_insert, Com_update,
Com_replace status variables as the writes. The percentage given is a percentage of the total
reads and writes (all five Com variables added together) and does not include administrative
commands like SHOW. Because of this, these percentages may be misleading.
[--] Reads / Writes: 32% / 68%
570
Please purchase PDF Split-Merge on www.verypdf.com to remove this watermark.
Measuring Performance
The next two lines relate to memory usage:
[--] Total buffers: 1.9G global + 12.2M per thread (300 max threads)
[!!] Maximum possible memory usage: 5.5G (91% of installed RAM)
Information for these lines comes from the system variables that are the output of SHOW GLOBAL
VARIABLES.
The global buffer formula that mysqltuner uses is:
key_buffer_size + max_tmp_table_size + innodb_buffer_pool_size +
innodb_additional_mem_pool_size + innodb_log_buffer_size +
query_cache_size
The per thread buffer formula that mysqltuner uses is:
read_buffer_size + read_rnd_buffer_size + sort_buffer_size +
thread_stack + join_buffer_size
The max_threads comes from the system variable max_connections.
The Maximum possible memory usage is calculated by:
global + max_connections * (per thread)
The global and per thread buffers in mysqltuner are not a complete picture of how much
memory is allocated for global use; they do not take into account any of the memory settings for
the BDB, Falcon, and Maria storage engines. Thus, the Maximum possible memory usage is
inaccurate.
The Maximum possible memory usage in our example is a large percentage of available memory. In some cases, it may exceed the memory available. This may or may not be a problem; in
many cases, there will not be max_connections number of connections that are all using the
maximum per thread memory allocation. In fact, there may be a few queries that require high
values for some of the per thread memory variables. The max_connections variable is useful to reduce the number of connections, so that mysqld does not crash by trying to allocate
more memory than is available. However, there are many cases in which both a high number of
max_connections and a high number of per thread memory variables are needed. This is
one of the reasons that automated tuning is not always useful.
The values in the rest of the Performance Metrics section are simple calculations involving
system and status variables from SHOW GLOBAL VARIABLES and SHOW GLOBAL STATUS:
[OK]
[OK]
[OK]
[OK]
[!!]
[!!]
[OK]
[OK]
[OK]
[OK]
Slow queries: 0% (4K/338M)
Highest usage of available connections: 34% (102/300)
Key buffer size / total MyISAM indexes: 350.0M/13.7G
Key buffer hit rate: 97.2% (368M cached / 10M reads)
Query cache efficiency: 14.1% (12M cached / 90M selects)
Query cache prunes per day: 246
Sorts requiring temporary tables: 8% (1M temp sorts / 19M sorts)
Temporary tables created on disk: 12% (162K on disk / 1M total)
Thread cache hit rate: 99% (102 created / 39M connections)
Table cache hit rate: 53% (358 open / 675 opened)
Please purchase PDF Split-Merge on www.verypdf.com to remove this watermark.
571
17
Part III
Core MySQL Administration
[OK]
[OK]
236M
[!!]
Open file limit used: 1% (310/25K)
Table locks acquired immediately: 100% (236M immediate /
locks)
InnoDB data size / buffer pool: 21.3G/1.5G
Recommendations
-------- Recommendations ---------------------------------------General recommendations:
Run OPTIMIZE TABLE to defragment tables for better performance
Variables to adjust:
*** MySQL’s maximum memory usage exceeds your installed memory ***
*** Add more RAM before increasing any MySQL buffer variables ***
query_cache_limit (> 2M, or use smaller result sets)
query_cache_size (> 64M)
innodb_buffer_pool_size (>= 21G)
Performance and Reporting Options
--skipsize
Don’t enumerate tables and their types/sizes
--checkversion
Check for updates to MySQLTuner
--forcemem <size> Amount of RAM installed in megabytes
--forceswap <size> Amount of swap memory configured in MB
Output Options:
--nogood
--nobad
--noinfo
--nocolor
Remove OK responses
Remove negative/suggestion responses
Remove informational responses
Don’t print output in color
As you can see, the information provided by mysqltuner can be quite valuable. However, any
recommendations from this (or other) profiling programs should be taken with some caution.
It is very easy to make changes just based on the recommendations of mysqltuner, without
understanding what is really happening, and have a system that does not perform as optimally
as possible.
mysqlreport
The mysqlreport program is similar in scope to mysqltuner. Like mysqltuner it is
a Perl program that uses the SHOW STATUS command to gather an overall picture of a
server’s health. Unlike mysqltuner, the mysqlreport program does not provide any
recommendations. However, it does provide a more in-depth analysis of your system that
you can use to determine where changes need to be made. The program is available at
/>Running the program is not difficult:
shell> ./mysqlreport --user qa_user --password
572
Please purchase PDF Split-Merge on www.verypdf.com to remove this watermark.
Measuring Performance
After you are prompted for the password, the report is generated. While this is the simplest way
to run mysqlreport, there are a number of options used for connecting to mysqld and managing the mysqlreport program run. Table 17-11 lists the available options.
TABLE 17-11
Available Options For mysqlreport
Option
Description
--user username
Specifies the username used by mysqlreport to for
connection to mysqld.
--password password
Specifies the password used by mysqlreport to connect
to mysqld.
--host address
Specifies an address of mysqld to connect and gather data
from.
--port tcpip_port
The TCP/IP port used for connection to mysqld.
--socket socket_file_
location
Specifies the socket file used for local connections on a
Unix-based server.
--infile file_name
Reads status information from file_name instead of
connecting to a server and running SHOW STATUS and
SHOW VARIABLES commands.
--outfile file_name
Writes report to both the file named file_name and the
screen.
--email email_address
On Unix-based systems emails report to email_address.
--flush-status
After gathering the current values issues a FLUSH STATUS
command.
--relative value
By default, mysqlreport generates a report based on the
status of the server since it began operation. The
--relative option can be used to generate reports that
are based on the values from previous reports. If value is
an integer the reports are generated live from mysqld every
num seconds. The option value can also be a list of input
files (generated by running mysqlreport with the
--report-count option), and the relative report is
generated from these input files in the order specified.
--report-count num
Collects num number of reports for use as input files for the
--relative option.
--detach
Runs the mysqlreport program in the background.
--help
Prints help information and exits.
--debug
Prints debugging information and exits.
Please purchase PDF Split-Merge on www.verypdf.com to remove this watermark.
573
17
Part III
Core MySQL Administration
As with mysqltuner, the mysqlreport program generates a report with sections devoted to
various aspects of mysqld being analyzed. The header section provides some general information about what version of MySQL is running, how long the server has been running and the
time the report was generated.
shell> ./mysqlreport --user qa_user --password
Password for database user qa_user:
MySQL 5.0.45-Debian_1ub uptime 27 22:47:2
23:56:20 2008
Tue Sep 23
The next section is the Key section and covers information about the key buffer usage. The key
buffer is the buffer used to store MyISAM indexes.
__ Key _________________________________________________________
Buffer used
13.08M of 16.00M %Used: 81.76
Current
16.00M
%Usage: 100.00
Write hit
96.88%
Read hit
99.22%
The first line of the Key section should be ignored. Buffer used is suppose to show the highest
ever level of buffer usage. However, it is very often inaccurate. In this example, it shows a maximum of 13.08 megabytes used. The Current line shows the buffer amount currently being utilized. In this case, the entire 16 MB is being utilized.
The Write hit value can vary quite a lot, depending on your overall server usage. If mysqld
has a lot of write activity that primarily executes INSERT and UPDATE statements, then Write
hit may be very low. If your server has a high percentage of SELECT statement execution, then
the key Write hit may be close to 100 percent. However, a negative key Write hit indicates
that MySQL is writing keys to hard disk more frequently than the key buffer in RAM. This is
going to be slow.
The Read hit value shows the ratio of key reads from hard disk to key reads from memory.
This percentage should be very high — near 100 percent. Having your MyISAM table indexes
stored in the key buffer is going to provide for much faster updating than having the indexes
stored on disk. If this value is not very close to 100 percent, you should see a performance
increase by allocating more memory to the key buffer.
The next section, Questions, includes information about both SQL queries being executed and
the MySQL protocol communications:
__ Questions ____________________________________________________
Total
14.20M
5.9/s
DMS
8.20M
3.4/s %Total: 57.73
Com_
5.68M
2.4/s
40.02
COM_QUIT
346.13k
0.1/s
2.44
-Unknown
340.18k
0.1/s
2.39
QC Hits
313.62k
0.1/s
2.21
Slow 10 s
492
0.0/s
0.00 %DMS: 0.01 Log:
574
Please purchase PDF Split-Merge on www.verypdf.com to remove this watermark.
ON
Measuring Performance
The Total line shows how many total questions were processed by the server. It is simply a
summation of the two fields of data. While it is somewhat disingenuous, you can say that the
second field of the Total line is your server’s query per second average. In the case of the
server being profiled, it doesn’t execute very many queries per second.
After the Total line, all of the lines following are sorted based upon frequency. In the case of
the server being profiled, the DMS statements were the majority of the total questions executed
by the server. The DMS line shows statistics about Data Manipulation Statements (SELECT,
INSERT, UPDATE, and DELETE queries). The majority of the server processing should be DML
statements, and if it is not, it probably indicates a problem. The Com_ line displays the server
communication commands, and the QC Hits line shows how many query result sets were
served from the query cache. In the case of the profile server, it is not a significant percentage
(2.21%). There is a significant amount of data about the query cache later in the report, so it
will be examined more closely at that point. The Unknown line should be fairly small. Unknown
questions are the questions that MySQL handles and increments the total questions counter but
does not have a separate status value to increment. The Slow line shows how many queries
took longer than the server variable long_query_time to return a result. With the server being
profiled the long_query_time is 10 s (seconds).
In addition to these lines showing general information, the Questions section provides a separate subsection for each line. With the server being profiled for the example, the most activity
occurred with data manipulation statements, so it is the first subsection.
DMS
INSERT
UPDATE
DELETE
SELECT
REPLACE
8.20M
7.17M
752.84k
219.20k
53.88k
0
3.4/s
3.0/s
0.3/s
0.1/s
0.0/s
0/s
57.73
50.51
5.30
1.54
0.38
0.00
87.49
9.18
2.67
0.66
0.00
This subsection can tell you at a glance how read or write heavy the application is. In this case,
it is almost entirely writes (99.34%). This is very unusual. This also explains why the earlier percentage for queries served out of the query cache is so low.
For the profiled server, the next subsection is the Com_ subsection:
Com_
5.68M
begin
3.86M
show_status 517.09k
set_option 352.17k
2.4/s
1.6/s
0.2/s
0.1/s
40.02
27.16
3.64
2.48
The Com_ subsection shows the values for the most used Com_ commands on the profiled
server. If you have some very unusual activity, it might show up here.
__ SELECT and Sort ____________________________________________
Scan
758.38k
0.3/s %SELECT: 1407.6
Range
559
0.0/s
1.04
Please purchase PDF Split-Merge on www.verypdf.com to remove this watermark.
575
17
Part III
Core MySQL Administration
Full join
Range check
Full rng join
Sort scan
Sort range
Sort mrg pass
4
0
0
182
6
152
0.0/s
0/s
0/s
0.0/s
0.0/s
0.0/s
0.01
0.00
0.00
The SELECT and Sort subsection provides information about the Select_status values.
These values can help you pinpoint issues with selects. For example, the Scan line indicates how
full table scans were performed. This could indicate that indexes might be needed to use these
tables effectively. A Full join is when full table scans are performed on tables being joined in
a multi-table queries. Both of these values should be as low as possible.
The other values tend not to impact performance. If you want more information about them,
complete documentation is available online at .
Notice that the Scan line has a percentage value of 1407.6. Since the total for all these values
should add up to 100 percent, this is clearly incorrect. Be careful when going through this
report, as there are occasional glitches.
__ Query Cache __________________________________________________
Memory usage 361.34k of 32.00M %Used:
1.10
Block Fragmnt 11.36%
Hits
313.62k
0.1/s
Inserts
42.09k
0.0/s
Insrt:Prune 42.09k:1
0.0/s
Hit:Insert
7.45:1
As stated earlier, this server is very heavy on writes. Because of this the query cache is not used
very much. The Memory usage line shows the amount of memory actually being used out of
the total memory allocated to the Query Cache. In this case, it is 361.34k out of 32 MB. The
Block Fragment percentage should be somewhere between 10 and 20 percent. It indicates the
amount of fragmentation in the query cache. The Hits line indicates the number of query
result data sets actually served from the query cache. This should be as high as possible. For
additional details one query cache optimization, see Chapter 12.
The next two lines are ratios that indicate the general effectiveness of your query cache. The first
line, Insert:Prune, is the ratio of inserts (into the query cache) to prunes. A prune is when
a query is removed from the query cache. In this case, the ratio is very heavy on inserts because
prunes are not really happening. If the amount of prunes is very large, it might be beneficial to
increase the size of the query cache. The Hit:Insert ratio shows the number of hits (results)
returned from the query cache versus the number of inserts into the query cache. The higher
this ratio is the better your server performance. For additional details on query cache optimization, see Chapter 12.
__ Table Locks ________________________________________________
Waited
6
0.0/s %Total:
0.00
Immediate
8.33M
3.4/s
576
Please purchase PDF Split-Merge on www.verypdf.com to remove this watermark.
Measuring Performance
The Table Locks subsection shows how often the database had to wait to obtain a lock on a
table (Waited) and how often the lock was granted immediately (Immediate). If the database
had to wait for table locks very often, this indicates there often a problem with MyISAM
contention.
__ Tables ________________________________________________________
Open
467 of 1024
%Cache: 45.61
Opened
13.23k
0.0/s
The Tables subsection Open line indicates the number of tables that were open when the
report was ran, the total number of open tables allowed in the table cache, and the percentage
of table cache used. The Opened line indicates the total number of tables opened since mysqld
started up and the average number opened per second.
If the number of open tables is equal to the table cache, it could possibly indicate a problem.
You might want to increase the size of the table cache.
__ Connections ___________________________________________________
Max used
19 of 500
%Max:
3.80
Total
346.36k
0.1/s
The connections subsection is straightforward. The Max used line indicates the maximum number of connections every used out of the total possible. If the Max used is approaching the maximum number you might need to raise the max_connections variable. The Total line indicates the total number of connections and the average number being made per second.
__ Created Temp _________________________________________________
Disk table
159.56k
0.1/s
Table
745.02k
0.3/s
Size: 128.0M
File
45
0.0/s
The Created Temp subsection is very important. The Disk table line shows the total number of
temporary tables that were created on disk. When temporary tables are created on disk instead
of remaining in memory, it is a big performance hit. It happens because some of the temporary
tables created in memory exceed the maximum size configured with the max_tmp_tables
variable. If you have a significant quantity of these, it would be best to increase the size of
max_tmp_tables. Assuming, of course, that your server has enough RAM to increase this
value. The next line shows the number of temporary tables created in memory, the average per
second, and the maximum allowable size before they are converted to disk-based temporary
tables.
__ Threads ____________________________________________________
Running
1 of
2
Cached
7 of
8
%Hit: 99.99
Created
37
0.0/s
Slow
0
0/s
Please purchase PDF Split-Merge on www.verypdf.com to remove this watermark.
577
17
Part III
Core MySQL Administration
The Threads subsection details information about the threads used for each connection to the
server. The most important line in this subsection is Cached. It shows the number of threads
that are stored in the thread cache ready for reuse. This keeps the server from having to create
a new thread for a new connection. The cache hit rate of 99.99 percent is excellent. If it is
not very high, it indicates that the server has to continually create and destroy new threads,
which can impact performance. If this is the case, you should probably increase the size of the
thread cache.
__ Aborted _____________________________________________
Clients
451
0.0/s
Connects
50
0.0/s
The Aborted subsection show statistics about connections to the server that have been dropped.
If this number is very high in relation to the amount of uptime, it can indicated a problem. The
Clients line shows connections that are closed because of three possibilities:
■ The client program did not call mysql_close() before exiting.
■ The client has been sleeping more seconds than the values of either of the two system variables wait_timeout or interactive_time.
■ The client program ended in the middle of a data transfer.
The Connects line is incremented when one of four things happens:
■ The client does not the required privileges to connect to the database.
■ The client used an incorrect password.
■ A connection packed is malformed or doesn’t contain the proper information.
■ It takes the server more than connect_timeout seconds to get a connection packet form
the client.
__ Bytes __________________________________________________
Sent
121.68G
50.4k/s
Received
8.78G
3.6k/s
The Bytes subsection shows the number of bytes sent from and received by the server:
__ InnoDB Buffer Pool _____________________________________
Usage
511.98M of 512.00M %Used: 100.00
Read hit
99.94%
Pages
Free
1
%Total:
0.00
Data
32.28k
98.51 %Drty:
0.03
Misc
486
1.48
Latched
0
0.00
Reads
501.12M
207.5/s
From file
320.24k
0.1/s
578
Please purchase PDF Split-Merge on www.verypdf.com to remove this watermark.
Measuring Performance
Ahead Rnd
Ahead Sql
Writes
Flushes
Wait Free
12536
3729
104.87M
8.93M
0
0.0/s
0.0/s
43.4/s
3.7/s
0/s
The InnoDB Buffer Pool section details information about the InnoDB buffer pool. The Usage
line shows you the total amount of RAM dedicated to the InnoDB buffer pool and how much
of it is actually being used. The Read hit line indicates the percentage of buffer pool page hits
from RAM instead of the much slower hard disks. Ideally, this percentage should be very near
100 percent.
The Pages subsection provides a breakdown of how the buffer pool pages are being used. The
Free pages are buffer pages that not allocated to any data at the time mysqlreport is run.
The Data pages are the buffer pages that currently contain data. The %Drty statistic shows the
quantity of the Data pages that have been modified in RAM but whose changes have not yet
been flushed to disk. The Misc pages are pages in the buffer allocated for administrative overhead. Latched pages are pages that cannot be flushed or removed from the buffer pool because
they are being written to or read from at the time the report is run.
The Reads subsection shows the read activity of the buffer pool. The Reads line shows the total
read activity both in number of reads and the average amount of reads per second. The From
file line shows the number of reads of InnoDB pages that were served from hard disk instead
of memory. A high number here is an indication of poor performance. Reads from memory are
always going to be faster than reads from storage. The two Ahead lines detail the number of
read ahead requests that are random (Rnd) or Sequential (Sql). These sequential read-ahead
reads indicate full table scans, which are a performance issue.
The Write lines describe the total number and average rate of writes to the buffer pool. This
system is quite busy with write activity, and it is shown here. The Flushes line indicates the
total and per second average number of flushes (writing data changes from the buffer pool to
disk). The Wait Free line indicates the number of times and the average that when the buffer
pool attempts to create a new page and there are no clean pages available. When this happens,
it is necessary to wait for the dirty pages to be flushed. This number should be low when compared to the total read numbers.
__ InnoDB Lock __________________________________________
Waits
0
0/s
Current
0
Time acquiring
Total
0 ms
Average
0 ms
Max
0 ms
The InnoDB Lock subsection details information about the row-level locks for InnoDB tables.
Ideally, these statistics will be at or near zero. The Waits line shows the total and average
Please purchase PDF Split-Merge on www.verypdf.com to remove this watermark.
579
17
Part III
Core MySQL Administration
number of times the server had to wait for the release of a lock on an InnoDB row. The
Current line shows the number of locks the server is waiting for at the time the report is
run. The Time acquiring section shows the total, average, and maximum amount of time (in
milliseconds) the server waited for rows locks.
__ InnoDB Data, Pages, Rows _______________________________
Data
Reads
482.10k
0.2/s
Writes
16.53M
6.8/s
fsync
9.17M
3.8/s
Pending
Reads
0
Writes
0
fsync
0
Pages
Created
Read
Written
85.23k
947.16k
8.93M
0.0/s
0.4/s
3.7/s
Rows
Deleted
Inserted
Read
Updated
609.09k
5.86M
529.57M
10.08M
0.3/s
2.4/s
219.3/s
4.2/s
The InnoDB Data, Pages, Rows subsection provides very general information about InnoDB
activity. It can be used as a quick overview before moving to the appropriate subsection for
more detailed information.
Overall the mysqlreport program provides very good information about the activity of your
server. You can use it to provide a profile of your operational servers and see potential trouble
spots or places for improvement.
mk-query-profiler
The mk-query-profiler script reads a file containing SQL statements or shell commands,
executes them, and performs analysis of the output of SHOW STATUS. At the end of program
execution, it displays statistics about query performance.
If the batch file contains multiple queries, it is necessary to separate the queries by blank
lines. If the queries are not separated, then query execution on mysqld will fail because
mk-query-profiler can not split the individual queries apart. Table 17-12 lists the options
available for mk-query-profiler.
580
Please purchase PDF Split-Merge on www.verypdf.com to remove this watermark.
Measuring Performance
TABLE 17-12
mk-query-profiler Options
Option
Description
--allowcache or -a
Uses the MySQL query cache during query execution.
Defaults to no caching.
--askpass
Will ask for a password when connecting to mysqld.
--[no]calibrate or -c
The script attempts to compensate for the SHOW STATUS
query execution. Defaults to yes.
--charset or -A
Determines the default character set.
--database or -D
Determines the database used for query execution.
--defaults-file or -F
The script read mysql options from the specified files,
which must have an absolute pathname.
--external or -e
The script calibrates and then pauses while you run an
external program. When your external program is finished,
you must press the Enter key again to resume execution.
--port or -P
TCP/IP port used for connection.
--socket or -S
Socket file used for connection.
--flush or -f
Performs FLUSH TABLES before profiling begins. If you
specify --flush twice while also specifying a batch file of
queries, FLUSH TABLES will be performed after each query.
--help
Displays help information and exits.
--host or -h
Specifies the hostname of mysqld used for query execution.
--[no]innodb or -i
Displays InnoDB table information. Defaults to yes.
--only or -n
Only shows statistics for a list of queries or commands
(separated by commas).
--password or -p
The password used for connection to mysqld.
--port or -P
The TCP/IP port used for connections to mysqld.
--separate or -s
The script will print separate statistics for each query.
--session
The script uses SHOW SESSION STATUS and SHOW
SESSION VARIABLES.
--setvars
Used to set MySQL variables. You can specify any variable
you want configured before query execution begins.
--socket or -S
Determines the Unix socket file used for a local connection.
Please purchase PDF Split-Merge on www.verypdf.com to remove this watermark.
continued
581
17
Part III
Core MySQL Administration
TABLE 17-12
(continued )
Option
Description
--tab or -t
Output is displayed with tab-separated values.
--user or -u
Username that is used for connection to mysqld.
--verbose or -v
Determines the verbosity of the output. If you specify
multiple times the output is more detailed.
--verify or -r
Verifies that nothing else is accessing mysqld.
--version
Outputs version information and exits.
Here is an example run of mk-query-profiler with very simple queries:
shell> mk-query-profiler --askpass --user=qa_user --database=sbtest
--socket=/var/run/mysqld/mysqld.sock /home/bmurphy/queries.sql
Enter password:
+----------------------------------------------------------+
|
3 (0.0008 sec)
|
+----------------------------------------------------------+
__ Overall stats _______________________ Value ____________
Total elapsed time
6.423
Questions
3
COMMIT
0
DELETE
0
DELETE MULTI
0
INSERT
0
INSERT SELECT
0
REPLACE
0
REPLACE SELECT
0
SELECT
3
UPDATE
0
UPDATE MULTI
0
Data into server
110
Data out of server
64889279
Optimizer cost
212982.199
__ Table and index accesses ____________ Value ____________
Table locks acquired
3
Table scans
1
Join
0
Index range scans
0
Join without check
0
Join with check
0
Rows sorted
0
582
Please purchase PDF Split-Merge on www.verypdf.com to remove this watermark.
Measuring Performance
Range sorts
Merge passes
Table scans
Potential filesorts
0
0
0
0
You can see that mk-query-profiler can return a great deal of information about your
queries. While these queries were very simple and did not return much data, it could be
useful to determine what some of your application’s potential ‘‘trouble queries’’ are; use
mk-query-profiler to analyze them.
The maatkit toolkit (which includes the mk-query-profiler) is available at www.
maatkit.org.
mysqldumpslow
When profiling a server to determine bottlenecks, the slow query log provides a very useful way
to see which queries are causing problems and could possibly be optimized to improve query
execution time. While there are a modest number of programs available on the Internet to help
with analyzing the slow query log, a script called mysqldumpslow, which can be used for this
analysis, is included in MySQL Server. Table 17-13 lists the options for mysqldumpslow.
TABLE 17-13
mysqldumpslow Options
Option
Description
-a
Does not abstract all numbers to ’N’ and strings to ’S’.
-d or --debug
Runs in debug mode.
-g STRING
Performs a grep of the dump only including statements with string
STRING.
-h HOSTNAME
Hostname of database server. This is used to determine the name
of the slow query log (hostname-slow.log format).
--help
Displays help message and exits.
-i NAME
Specifies the server instance name.
-l
Includes lock time in the total query time.
-n NUM
Abstracts all numbers in queries with at least NUM digits.
-r
Reverses the sort order listing longest query run last instead of first.
-s ORDER
Determines the sort order of the queries.
-t NUM
Displays the top NUM queries.
-v or --verbose
Raises the verbosity level of output.
Please purchase PDF Split-Merge on www.verypdf.com to remove this watermark.
583
17
Part III
Core MySQL Administration
With the -s (sort order) option there six possible values: t, at, l, r, c, and s.
■ The t value sorts the query output by total execution time. Total execution time is the
average query execution time × the number of times the query was executed.
■ The at value sorts the query output by the average query execution time. It is the default
sorting method.
■ The l value sorts the query output by lock time.
■ The al value sorts the query output by lock time average.
■ The r value sorts the query output by total rows.
■ The ar value sorts the query output by average rows sent.
■ The c value sorts the query output by count.
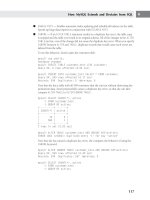
Here is an example of performing the sort by total execution time of the top five queries:
$ mysqldumpslow -s t -t 5 /mnt/mysql/logs/slowquery.log
Reading mysql slow query log from /mnt/mysql/logs/slowquery.log
Count: 3324 Time=9.79s (32533s) Lock=0.00s (0s) Rows=1.0 (3324),
username@hostname
SELECT count(*) AS count_all FROM table_one WHERE (sweepstake_id =
N and user_id is null)
Count: 1957 Time=11.26s (22028s) Lock=0.00s (0s) Rows=1.0 (1955),
username@hostname
SELECT * FROM table_one WHERE (sweepstake_id = N and user_id is
null) LIMIT N
Count: 279 Time=30.27s (8446s) Lock=0.00s (0s) Rows=0.6 (163),
username@hostname
SELECT * FROM table_two WHERE (table_two.`id` = N) FOR UPDATE
Count: 132 Time=43.59s (5754s) Lock=0.00s (0s) Rows=0.2 (23),
username@hostname
SELECT * FROM table_one WHERE (table_one.`id` = N) FOR UPDATE
Count: 901 Time=5.41s (4872s) Lock=0.02s (14s) Rows=1.0 (897),
username@hostname
SELECT * FROM table_three WHERE (table_three.`value`=’S’) LIMIT N
Knowing that these five queries spent more time executing (total execution time) than all the
other queries, you can concentrate your time on optimizing these queries. Query optimization
is covered in detail in Chapter 18.
584
Please purchase PDF Split-Merge on www.verypdf.com to remove this watermark.
Measuring Performance
Capacity Planning
Capacity planning, as it relates to information technology, is the process of determining the
computing infrastructure requirements needed by a company to meet changing demands for
products or services. The ultimate goal of benchmarking and profiling is to measure the capacity
of a server. If you know through benchmarking that a server can operate at a peak capacity of
X performance units and you know through profiling that a production server is operating at a
level of Y performance units, then you know that you have a current excess capacity level of X –
Y performance units. When the production server is operating at a level of X production units,
then you have no more room for growth.
If you have been profiling production servers over a period of time, you can develop trending
patterns and, through simple extrapolation, know how much time you have before a production server reaches full capacity. In many cases, this is all the capacity planning needed (at least
when it comes to database servers!). If you know that your current servers will reach capacity in
9 to 12 months, it will be much easier to plan for increased capacity by adding more servers or
upgrading the current servers, rather than being surprised when your servers suddenly bogs down
and performs extremely poorly because it is overloaded.
Unfortunately, many database administrators feel that they are too busy to either measure the
performance of servers or do any type of capacity planning. In the end, this costs you more time
and effort when you have to reacting to a situation where your servers reach capacity instead of
planning ahead.
Summary
The skills to perform benchmarking and profiling on database servers are some of the skills
that differentiate beginner database administrators from their more experienced colleagues.
It is invaluable to be able to perform both benchmarking and profiling and use the data
gathered to have optimally running database servers. This saves organizations money and
provides for a better experience for the end users of the application who rely on the database
servers.
In this chapter, we covered the following topics:
■ Benchmarking mysqld
■ mysqlslap
■ MyBench
■ SysBench
Please purchase PDF Split-Merge on www.verypdf.com to remove this watermark.
585
17
Part III
Core MySQL Administration
■ Profiling mysqld
■ mysqltuner
■ mysqlreport
■ mk-query-profiler
■ mysqldumpslow
■ Capacity planning for your organization
586
Please purchase PDF Split-Merge on www.verypdf.com to remove this watermark.
Extending Your
Skills
IN THIS PART
Chapter 18
Query Analysis and Index Tuning
Chapter 19
Monitoring Your Systems
Chapter 20
Security
Chapter 21
The MySQL Data Dictionary
Chapter 22
Scaling and High Availability
Architectures
Please purchase PDF Split-Merge on www.verypdf.com to remove this watermark.
Please purchase PDF Split-Merge on www.verypdf.com to remove this watermark.
Query Analysis and
Index Tuning
‘‘T
he database is slow!’’
IN THIS CHAPTER
A DBA will hear this over and over during his or her career. Although
there are times when performance can be tuned best by changing server
parameters, most of the time database slowness, it is because the:
Analyzing queries using
EXPLAIN
Using EXPLAIN on non-SELECT
statements
■ The query cache is not being utilized properly (see Chapter 12 for
troubleshooting).
Using other query analysis
tools
■ The query contains subqueries (MySQL Server 5.1) or unoptimized
subqueries (MySQL Server 6.0). See the companion website at
www.wiley.com/go/mysqladminbible for information about
how to avoid subqueries.
Optimizing queries
■ The table contains a large amount of unnecessary data.
■ The table is fragmented.
■ The schema was not designed for the queries being run.
■ The queries being run do not take into consideration the schema
design.
■ Tables have no indexes that are appropriate for the query.
The reason for the disparity between the schema and queries may be that
a developer is not familiar with MySQL, a DBA made assumptions about
database usage, or the schema and queries were in sync at one point, but
the data and/or application has grown.
A database schema is always a work in progress; as long as different
queries are being written or the data inside a schema is changing, it is
necessary to reanalyze both the schema and queries.
589
Please purchase PDF Split-Merge on www.verypdf.com to remove this watermark.
Part IV
Extending Your Skills
The larger issues of benchmarking and profiling are covered in Chapter 17, ‘‘Measuring
Performance’’; these techniques are used to identify the queries you need to analyze. Once you
have identified queries causing problems, the information in this chapter will help you analyze
and tune queries and, where appropriate, the database schema.
While there can be performance improvements done by tuning a server (Chapter 10), particularly to the needs of your storage engine (Chapter 11), overwhelmingly the reason that a query
is slow is because of the data in the table, the schema, and the query itself.
Using EXPLAIN
The most widely used query analysis tool is EXPLAIN, an SQL extension. EXPLAIN
select_statement shows information about how select_statement will likely be
executed.
This information includes:
■ How many tables are involved
■ How the tables are joined
■ How the data is looked up
■ If there are subqueries
■ If there are unions
■ If DISTINCT is used
■ If a WHERE clause is used
■ If a temporary table is used
■ Possible indexes used
■ Actual indexes used
■ Length of actual indexes used
■ Approximate number of records returned
■ If sorting requires an extra pass through the data
The information is known as the query execution plan, and is also referred to as the
EXPLAIN plan.
EXPLAIN plan basics
EXPLAIN is used in front of a SELECT statement, and returns 10 fields:
mysql> EXPLAIN SELECT return_date
-> FROM rental WHERE rental_id = 13534\G
590
Please purchase PDF Split-Merge on www.verypdf.com to remove this watermark.
Query Analysis and Index Tuning
*************************** 1. row ***************************
id: 1
select_type: SIMPLE
table: rental
type: const
possible_keys: PRIMARY
key: PRIMARY
key_len: 4
ref: const
rows: 1
Extra:
1 row in set (0.00 sec)
The first field, id, is a sequential identifier, which is different for each row. Each row represents
a physical table, subquery, temporary table, or derived table. In this simple example, there is
only one table being queried, so there is only one row, with an id of 1. Tables are returned in
join queue order, which means that a table in row 1 is used first, then joined to the table in row
2, and so on.
When EXPLAIN involves a view, returned rows correspond to the tables, subqueries,
unions, and temporary tables used in the view definition. There is no row returned
for the view itself.
The second field, select_type, is the type of SELECT represented by the row. The third field,
table, shows the table alias that the row refers to. Often, the select_type will be SIMPLE,
as it is in our example. When using EXPLAIN on a UNION query, the select_type of the first
row is PRIMARY. Other rows have a select_type of UNION, and there is a final row representing the action of performing the UNION on the result sets of the previous queries. For example,
here is an EXPLAIN plan for a simple UNION, getting the first names for all staff and customers:
mysql> EXPLAIN SELECT first_name FROM staff UNION SELECT first_name
FROM customer\G
*************************** 1. row ***************************
id: 1
select_type: PRIMARY
table: staff
type: ALL
possible_keys: NULL
key: NULL
key_len: NULL
ref: NULL
rows: 1
Extra:
*************************** 2. row ***************************
id: 2
select_type: UNION
table: customer
type: ALL
Please purchase PDF Split-Merge on www.verypdf.com to remove this watermark.
591
18