Unit 11 Sources of energy
Bạn đang xem bản rút gọn của tài liệu. Xem và tải ngay bản đầy đủ của tài liệu tại đây (122.49 KB, 3 trang )
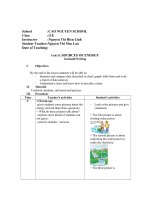
<span class='text_page_counter'>(1)</span>Preparing of date: 16/02/2017 Teaching of date class 11a1 11a2 Period 71. Total of sts. UNIT: 11. SOURCES OF ENERGY Lesson 4: Writing. I. Objectives By the end of the lesson, Ss will be able to: - students learn how to base on a chart to write a paragraph. Lexical items: words/phrase used in the chart and words about the content II. Teaching aids Textbook, charts, a model of the description. III.Teaching methods: p.p.p,communicative…. IV. Procedure: Teacher’s activities Students’ activities I.Warm up: (4 minutes) Give pictures of charts and asks students what are these. -look at the pictures and answer.. the energy consumptionin Highland. million tones 140 120 100. Coal Nuclear & Hydroelectricity Petroleum. 80. 75. 60 40. 57 40. 50. 45. 20. 20. 2000. 2005. billion 7 6 5 4 3. World. other parts of china. 2. China. ML Yangtze River. 1 0. Have you learnt about these charts? Look at these charts. What do you know? II. Pre -writing(15 minutes) 1 ask questions for elicitation. Base on the chart how do you know the energy consumption in High Land? -What sources of energy are mentioned in the chart? the energy consumptioninHighland. milliontones 140 120. Coal Nuclear & Hydroelectricity. 100. Petroleum. 80. 75. 60 40 20. - Anwers the questions - know about the figure and they can compare the information.. 57 40. 50. 45. 20. 2000. 2005. How much total energy consumption was in 2000? 2. Ask students to study the chart about energy consumption in Highland in 2000 *what is the unit of the energy consumption? * what is the length wise column about? *What is the horizontal line about? - Ask students to answer true or false - 1)The red column refers to coal - 2)The blue column refers to petrolium. -look at the color of the colum. -The numbers showed on the year 2000 and 2005.
<span class='text_page_counter'>(2)</span> -. 3)The dark green refers to hydroelectricity and fill in gaps with the information Ask students to compare the answer with other pairs. 3. Ask students to work in group of 4 students. -look at the energy consumption in the year 2005 in High Land. compare the figures and complete second paragraph like task. T gives some model structures + according to the chart we know that the energy ….. + the chart shows the energy consumption in High Land……. III. while - writing: (20 minutes) T has students write a paragraph to describe the chart using the information from task 1 Ask students to work in group Using poster to write the paragraph T goes around the class and gives help if it is needed Outlining and useful languages: 1. Give out the topic sentence. The chart shows/ describes/ illustrates…………………. + place +time: lược đồ cho thấy 2. Write some supporting ideas for the topic sentence. - As can be seen….: có thể thấy rằng… - This was followed by the consumption of….: tiếp theo là mức tiêu thụ của… - …made up the largest amount of….: ..…chiếm số lượng lớn nhất là…. 3. Summarize the concluding sentence: To sum up, in conclusion, all in all, etc… * Task 2: Write a paragraph describing energy consumption in 2005. Poster: Work in pairs to answer the following questions 1. Was the total energy consumption in 2005 higher or lower than it was in 2000? 2. How many tons was Nuclear and hydroelectricity consumed in 2005? Was it lower or higher than it was in 2000? 3. Was the consumption of coal in 2005 lower or higher than it was in 2000? 4. Was petroleum consumption in 2005 lower or higher than it was in 2000? *Expected answers: 1. The total consumption in 2005 was higher than it was in 2000. 2. 75 tons nuclear and hydroelectricity consumed in 2005. It was higher than it was in 2000. 3. The consumption of coal in 2005 was lower than it was in 2000. - they are: Coal, nuclear power and hydroelectricity. - petroleum. - 117 million fons. Work in pairs Listen to the question & answer - Million tons _the energy consumption _ the year Work in pairs to answer true or false 1.F (nuclear &hydroelectricity) 2.F (coal) 3.F (petroleum) + 117 + coal + smallest. - read the answers and write them on the board - group work - write a paragraph base on task 1. using similar structures. + write a paragraph base on the chart, using the details, numbers and the models that the teacher gives. - students should compare the energy consumption in 2000 and 2005. look at the model writing - give some other ideas if they think it necessary *Expected answer: The chart shows the energy consumption in Highland in 2005. As can be seen, the total energy consumption was 170 million tons. Nuclear and hydroelectricity made up the largest amount of this figure (75 million tons). This was followed by the consumption of petroleum (50 million tons). Coal made up the smallest amount of energy consumption (45 million tons). *Expected answer: The chart shows the energy consumption in Highland in 2000 and 2005. As can be seen, the total energy consumption in 2005 was 170 million.
<span class='text_page_counter'>(3)</span> 4. Petroleum consumption in 2005 lower or higher than it was in 2000. Task 3: Work in groups to write a paragraph to describe the energy consumption in Highland in 2000 and in 2005. III. Post -writing: (4 minutes) -have students share the paragraph with their friends -ask Ss to correct their friends ‘mistakes - correct some mistakes if necessary - give some good writings to present. * Home work: (2 minutes) - gives another chart, - Asks students to describe the chart at home - Prepare new lesson: Language focus.. tons. So it was higher than it was in 2000 (117 million tons). In 2005, nuclear and hydroelectricity made up the largest amount of this figure (75 million tons). This was followed by the consumption of petroleum (50 million tons). Both of them were higher than they were in 2000. However, coal decreased the amount of the energy consumption (from 57 million tons in 2000 to 50 million tons)..
<span class='text_page_counter'>(4)</span>