EPS CompanyreportHPG 2018 03 1462642CH
Bạn đang xem bản rút gọn của tài liệu. Xem và tải ngay bản đầy đủ của tài liệu tại đây (456.75 KB, 7 trang )
COMPANY UPDATE
12-Mar-18
HPG (HOSE) HOA PHAT JSC. - Expanding horizontally
OVERWEIGHT Pros
Rating
-
HPG in 2017 is the largest steel manufacturer in Viet Nam with market share of
construction steel and pipe steel of 24% and 26% respectively.
The phase 1 of Dung Quat complex project with capacity of 2 mil tons of construction steel
per year, which is planned to complete in 2019, will help HPG keep the number 1 position
of steel producer and boost the market share of construction steel up to 30%.
The phase 2 of Dung Quat complex project produces HRC in order to use for HPG’ other
high value products such as pipe steel and color coated steel sheet. HRC might give HPG
a significant advantage compared to other competitors in color coated steel sheet market.
The policy to cut the excess capacity of steel producers and shut down those still using
old technology in China will decrease the oversupply of the global steel market by around
30 million tons in 2018. This policy probably boosts the price of global steel in the short
15,000
term.
- The first color coated steel sheet factory in Hung Yen is going to come into production in
quarter 2/2018 with total capacity of 400,000 tons/year, helping HPG join and gain share
10,000
from this market
In furniture, construction equipment and refrigeration industries, HPG is the one of the
5,000
leading brands in Viet Nam.
Cons:
0
Steel Industry
Market price (VND)
62,000 Target price (VND)
76,000
Annualized price return (%)
22%
Expected dividend yield (%)
0%
Expected annualized total
22%
return (%)
80
VND
'000
Price - Volume
60
40
20
0
09/2017
'000
shares
12/2017
Stock performance (%)
Absolute
Relative
YTD
1M
31%
16%
1%
-6%
3M
12M
53% 134% 29% 70%
Source: Bloomberg, compare to VNI
Stock Statistics
-
12/03/2018
-
Cost of raw materials such as ore, charcoal, graphite…are forecasted to rise in 2018 due
to policies of many coutries to control more effectively the exploitation of these natural
resources.
Deb increased significantly in 2017 to nearly VND13,000 billion, creating high pressure to
HPG in paying interest and principal in 2018.
Regarding to the U.S. market, HPG will be adversely affected by the new import tax rate
of 25% imposed on imported steel
Aside from other producers in Viet Nam such as Pomina, TIS, Kyoei, etc, CPTPP will put
HPG under higher pressure of competition of the imported steel from the other 11
countries.
52-week range (VND)
Shares o/s (m)
Mkt cap (VND bn.)
Mkt cap ($m)
Foreign % owned
Est. free float (ml. shrs)
3m avg. daily vol. (shrs)
VND/USD
Index: VN-Index/HNX
25.8k-66.7k
Recommendation:
1,517
- We forecast net sales and net profit of HPG in 2018 at VND56,802 billion (+23% YoY)
93,288
and VND9,032 billion (+16% YoY). We value HPG share at VND76k per share at the end
4,101
of 2018. Total return is 22% at the current price of VND62k. OVERWEIGHT.
40%
893
VND bn.
2016
2017
2018E
2019F
6,230,798
Net revenue (VND bn.)
33,283
46,162
56,802
67,970
Growth (%)
22,760
21%
39%
23%
20%
Operating profit (VND bn.)
7,856
9,622
11,899
14,591
1,126/129
Margin (%)
24%
21%
21%
26%
Source: Bloomberg, KISVN
Net profit (VND bn.)
6,606
8,015
9,032
11,118
Margin (%)
20%
17.5%
16%
16.5%
Ownership
12/03/2018
843
1,517
1,517
1,517
Outstanding shares (million)
Chairman & Related parties
32.4%
4,205
4,895
5,651
6,957
EPS (bonus-adjusted, VND)
82%
16%
15%
23%
Tran Tuan Duong
2.7%
Growth (%)
39%
31%
25%
24%
ROE (%) (excl. minority)
Nguyen Manh Tuan
2.6%
10%
27%
28%
23%
Net debt/Equity (%)
VOF Investment Ltd
2.6%
14.7
12.7
11
9
PER (x)
Source: Bloomberg, KISVN
2.8
2.9
2.3
1.8
PBR (x)
10.1
8.9
7.4
6.1
EV/EBITDA (x)
Mr. Duong N. Tran
1,500
DPS (VND, as reported)
(+84 28) 3914 8585 - Ext: 1462
21%
Dividend yield (%)
www.kisvn.vn
Page 1
Bloomberg: KISVN <GO>
COMPANY UPDATE – HPG
KIS Vietnam Securities JSC
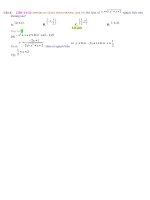
Vietnam’s steel market keeps high growth rate
Construction's steel share
market 2017
HPG
24%
Others
39%
Posco
9%
TIS
8%
POM
11%
Vinakyoei
9%
Pipe steel's share market
2017
HPG
26%
Others
33%
VGS
6%
SeAH VN
8%
HSG
18%
Minh Ngọc
9%
Source: VSA
Viet Nam market consumed 15.2 million tons of steel in 2017, increasing 17%
compared to 2016. As Vietnam still needs a lot of infrastructure development, steel
consumption increased 20% CAGR in the past 5 years and also Vietnam construction
steel market is estimated to increase from 20-25% in 2018 according to VSA. These
factors will keep the growth momentum of the steel industry in general and HPG in
particular.
Regarding to HPG, construction steel sales will increase by 2 million tons from 2.2
million tons of 2017 when the first phase of Dung Quat project complete and goes into
production in 2019, helping HPG increase its share market from 24% to 30%.
The number of steel exported in 2017 reached 3.8 million tons, increasing 27%
compared to 2016. In 2017, HPG exported 161,000 tons of steel to the U.S., Canada,
Australia, Malaysia, Cambodia, etc. Furthermore, in the first 2 months of 2018, HPG
exported nearly 31,000 tons of steel to the U.S., Australia and Asia.
In steel pipe segment, HPG still keeps the largest market share with total consumption
reaching 600,000 tons in 2017. In 2018, HPG expect to sell up to 684,000 tons of steel
pipe.
In color coated steel sheet segment, the first factory in Hung Yen with capacity of
400,000 tons per year when goes into production in quarter 2/2018 will help HPG join
this 3.5-mil-ton market. The steel sheet market is mainly consumed in the South whilst
HPG factory is located in the North, leading to some difficulties for HPG such as high
logistics cost and the low customer awareness of HPG-branded steel sheet. However,
when Dung Quat Project is completed, HPG could transport their products from the
North to the Middle and the South by sea with lower cost compared to road
transportation.
The pre-stressed steel factory with total capacity of 160,000 tons per year with high
quality products including pre-stressed steel, pre-stressed steel trans and prestressed steel wire is under construction and planned to complete in 2018 at Dung
Quat complex project.
In 2017, the phase 1 of the steel wire factory with capacity of 40,000 tons per year
went into production certified ASTM A510/A510-13 helped HPG supply to local
projects, distributors and export.
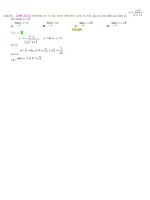
Production & Revenue of Construction steel and
Pipe steel
50,000
39,738
40,000
28,855
30,000
20,000
10,000
13,209
785
19,795
14,645
866
1,248
22,586
1,749
2,420
2,747
2012
2013
2014
2015
Revenue
Production
2016
2017
Source: VSA
12-Mar-18
Equity Research - KIS VN
Page 2
Bloomberg: KISVN <GO>
COMPANY UPDATE – HPG
KIS Vietnam Securities JSC
Real estate projects are as scheduled
In 2017, HPG has recorded 20% of revenue and profit from Mandarin Garden 2
Project. The remaining 80% will be recorded in 2018. Accordingly, in quarter 1/2018,
the revenue and net profit are VND1,300 billion and VND550 billion respectively.
Project 70 Nguyen Duc Canh, Hoang Mai District in Hanoi was launched in 2017 with
total area of 1,500 m2 including 2 commercial stores and 19 apartment stores (228
units). The basement is under construction and the apartments are planned to
handover in 2018 and 2019. Total investment of this project is VND300 billion.
Revenue and net profit estimated from this project are 400-500 billion VND and 160200 billion VND respectively.
Bac Pho Noi City project is the largest real estate project of HPG since Mandarin
Garden 1 with total area of 262 ha including 2 stages. Stage 1 with total investment
of VND2,700 billion and being under land clearance progress has 2 main products are
villas and apartments.
Hoa Phat’ Real Estate Projects
1. Mandarin Garden 2 Project
2. 70 Nguyen Duc Canh Apartment
Completed and transfer to clients in 2018
Complete and transfer to clients in 2019
- Total area: 262ha include 2 stages
3. North Pho Noi City Project (Hung Yen Province)
- Products: ajoining villas, apartments
- Clearing land and compensation
3. Pho Noi A Industrial Zone(Hung Yen Province)
4. Yen My II Industrial Zone( Hung Yen Province)
5. Hoa Mac Industrial Zone (Hà Nam Province)
6. Hoa Phat Tower in Giai Phong (Ha Noi)
- Total area: 600ha operating since 2004
- More than 100 companies located
- Total area: 230 ha formed since 2009
- Operating since 2017
- Total area: 203ha formed since 2008
- Operating since 2017
- 24 level with 5 commercial level and 19
apartment levels
- Operating since 2012
Source: HPG
Agribusiness is highly promising in 2018
The third animal feed factory of HPG is scheduled to complete in 2018, helping HPG
increase total capacity of animal feed to 1 million tons per year and gaining 5%
domestic share market.
According to the plan, in 2018, HPG will supply 20 million of chicken eggs to the
market and raise the number of Australia-originated cattle herd with the aim to supply
high quality beef product to the market.
HPG basically has completed their initial capital expenditure in the agricultural
segment and will expand its presence in the market in 2018-2020.
12-Mar-18
Equity Research - KIS VN
Page 3
Bloomberg: KISVN <GO>
COMPANY UPDATE – HPG
KIS Vietnam Securities JSC
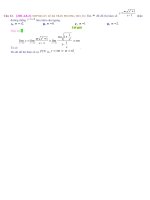
Revenue and Profit from Agricultural segment
3,500
2,895
3,000
2,500
2,000
1,500
1,395
1,332
1,000
500
(47)
56
26
(500)
2015
2016
Revenue
Profit
2017
Source: HPG
2018 forecasts
Based on good business results in 2017, we expect HPG to maintain its strong growth
2018 and 2019. Our assumptions for the forecast of 2018 are the prices of raw
materials including iron ore 62%, charcoal, scrap steel, graphite, HRC unchanged
compared to 2017.
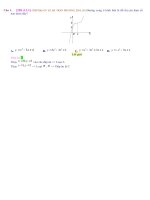
We estimate revenue of HPG in 2018 and 2019 at VND56,802 billion (+23%YoY) and
VND67,970 billion (+20%YoY) and net profit in 2018 and 2019 at VND9,024 billion
(+16%YoY) and 11,151 billion (+16.5%YoY) respectively. EPS is estimated at
VND5,464 (+15%YoY) and VND6,978 (+24%YoY) respectively.
Forecast Revenue for 2018 and 2019
70,000
60,000
50,000
57,988
48,003
40,000
30,000
20,000
10,000
2,950 3,143
1,328 2,318
4,521 4,521
Real Estate
Agriculture
Steel
Other heavy
industries
2018F
12-Mar-18
Equity Research - KIS VN
2019F
Page 4
Bloomberg: KISVN <GO>
COMPANY UPDATE – HPG
KIS Vietnam Securities JSC
FINANCIALS MODEL
Mkt cap: VND94,060bn
2016
2017
2018E
2019E
CASH FLOWS AND
BS ITEMS (VND bn.)
33,283
46,162
56,802
67,970
Receivable turnover (x)
21%
39%
23%
20%
28,855
39,738
48,003
57,988
2,598
2,768
2,950
3,143
Increase in WC
1,419
5,214
2,592
2,720
3,417
8,875
6,689
7,017
-270
2,710
2,723
2,419
3,684
-6,810
-1,434
810
Unit: Billion VND
Net Revenue
Sales growth (%)
Port Service
Logistics
2017
2018E
2019E
16.6
10.3
12.8
12.5
Inventory turnover (x)
2.7
3.0
2.9
2.9
Payable turnover (x)
4.4
4.9
4.8
4.8
435
760
1,328
2,318
Capex
1,395
2,895
4,521
4,521
Other cash flow items
24,533
35,536
43,668
51,902
26%
23%
23%
24%
Other
COGS
Gross margin (%)
2016
SG&A
EBITDA
895
1,004
1,235
1,478
9,499
11,595
14,276
17,454
Depr’n & Amort’n
28%
25%
25%
26%
Operating profit
1,643
1,974
2,377
2,863
7,856
9,622
11,899
14,591
24%
21%
21%
22%
EBITDA margin (%)
Operating margin (%)
Net interest expense
As % of avg. net debt
Free cash flow
Share issues
-
-
-
-
1,102
4
-
-
-2,581
6,814
2,768
324
1,902
8,715
11,483
11,807
Enterprise value
96,066
102,885
105,653
105,976
Total equity
19,850
32,398
40,978
51,569
106
111
100
104
Dividends paid
Increase in net debt
Net debt, end of year
Minority interests
142
371
609
692
Shareholder’s equity
19,745
32,287
40,878
51,465
Interest cover (x)
4%
7%
6%
6%
BVPS (VND)
23,425
21,282
26,945
33,924
Other profit/loss*
55.5
26
20
21
10%
27%
25%
18%
-13
38
-
-
0.2
0.8
0.7
0.5
1,096
1,274
2,258
2,780
33,227
53,022
59,223
69,562
14%
14%
20%
20%
6,606
8,015
9,032
11,118
20%
17.5%
16%
16.5%
2016
2017
2018E
2019E
4
8
8
8
6.9%
10%
7%
7%
6,602
8,007
9,024
11,109
2%
5%
5%
5%
843
1,517
1,517
1,517
ROIC (%)
3.9%
5.0%
5.0%
5.2%
4,205
4,895
5,651
6,957
WACC (%)
Tax
Effective tax rate (%)
Net profit
Net margin (%)
Minorities
Net attributable profit
Number of shares (m)
EPS (VND, bonusadjusted)
EPS growth (%)
Net debt / equity (%)
Net debt / EBITDA (x)
Total assets
Net debt = debts – cash & equivalent
KEY RETURN AND
VALUATION RATIOS
ROE (%)
(excl. minority interest)
ROA (%)
12.5%
12.5%
14.1%
14.3%
17
11
14
12
82%
16%
15%
23%
PER (x)
1,500
-
-
-
PBR (x)
1.1
1.0
0.9
0.8
21%
-
-
-
PSR (x)
6.4
4.8
3.6
3.3
EBITDA = Net revenue – (COGs -Depr’n&Amort’n)– SG&A expenses
EV/EBITDA (x)
24
23
12
11
EBIT = EBITDA – Depr’n&Amort’n
EV/Sales (x)
Dividend yield (%)
(bonus-adjusted)
12
7.7
4.9
4.4
0.0%
0.0%
0.0%
0.0%
DPS (VND)
Payout ratio (%)
Net interest expenses = interest expenses – interest income
Other profit/loss consists of other financial income/expenses, profit share
from JVs/associates and other income/loss
Payout ratio = Dividend paid / Net attributable profit
* We assume about the total value of withdrawal deals.
12-Mar-18
Equity Research - KIS VN
Page 5
Bloomberg: KISVN <GO>
COMPANY UPDATE – HPG
KIS Vietnam Securities JSC
Contacts:
HCM City Head Office
Hanoi Branch
Level 3, Maritime Bank Tower
180-192 Nguyen Cong Tru St., District 1, HCM City
Tel: (+84 28) 3914 8585
Fax: (+84 28) 3821 6898
Level 6, CTM Tower
299 Cau Giay, Cau Giay District, Hanoi
Tel: (+84 4) 3974 4448
Fax: (+84 4) 3974 4501
Equity Research
Mr. Huy Hoang, CFA
Head of Equity Research
(+84 28) 3914 8585 (x1450)
Mr. Duong Tran
Mr. Danh Nguyen
Associate – Energy & Utilities
(+84 28) 3914 8585 (x1459)
Ms. Mai Tran
Senior Associate – Materials & ITC Associate – Property &
Construction
(+84 28) 3914 8585 (x1462)
(+84 28) 3914 8585 (x1461)
Macro Research
Mr. Vien Bach
Head of Macro Research
(+84 28) 3914 8585 (x1449)
Institutional Sales
Ms. Uyen Lam
Head of WholeSales
(+84 28) 3914 8585 (x1444)
Mr. Ha Nguyen
Associate – Pharma and F&B
(+84 28) 3914 8585 (x1463)
Mr. Bao Vo
Associate – Logistics, Aviation &
Automobiles
(+84 28) 3914 8585 (x1460)
COMPANY UPDATE – HPG
KIS Vietnam Securities JSC
Our Recommendation System
OVERWEIGHT: where we believe prospective 12 months VND total return (including dividends) will be 15% or more.
NEUTRAL: where we believe it will be -5% to 15%.
UNDERWEIGHT: where we believe it will be -5% or less.
Disclaimer
This report has been issued by the KIS VN Securities Corporation (“KIS”) with the instructional contributions of KIS VN Securities Corporation
whose employees are specified in the publication. This report is for information of its institutional and professional customers.
This report is and should not be construed as an offer to sell or a solicitation of an offer to purchase or subscribe for any investment. No
consideration has been given to the particular investment objectives, financial situation or particular needs of any recipient. Investors are
advised make their own financial decisions based on their independent financial advisors as they believe necessary and based on their
particular circumstances such as their financial situation, investment objectives and other considerations.
In preparing this report, we have relied upon and assumed the accuracy and completeness of all information available from public and other
sources which we believe to be reliable, but which we have not independently verified. KIS makes no express or implied guarantee,
representation or warranty and accepts no responsibility or liability as to the accuracy or completeness of such information.
Opinions, estimates, and projections expressed are current opinions of the authors as of the original publication date appearing on this report
only and the information, including the opinions contained herein, and are subject to change without notice.
KIS and its affiliates may from time to time perform investment banking or other services for, or solicit investment banking or other business
from, companies mentioned herein. Further, KIS and its affiliates, and/or their officers, directors and employees involved in the preparation
or issuance of this report may, from time to time, have long or short positions in, and buy or sell, the securities, or derivatives (including
options) thereof, of companies mentioned herein, or related securities or derivatives in a manner that may be consistent or inconsistent with
this report and opinions expressed therein. As a result, investors should be aware that KIS and its affiliates and/or their officers, directors
and employees may have a conflict of interest that could affect this report.
This report shall not be copied, reproduced, distributed (in whole or in part) or disclosed by recipients to any other person without the express
permission of KIS in writing.