Xử lý nước bằng công nghệ khử muối
Bạn đang xem bản rút gọn của tài liệu. Xem và tải ngay bản đầy đủ của tài liệu tại đây (1.26 MB, 67 trang )
Using Desalination Technologies for Water
Treatment
March 1988
NTIS order #PB88-193354
Recommended Citation:
U.S. Congress, Office of Technology Assessment, Using Desalination Technologies for Water
Treatment, OTA-BP-O-46 (Washington, DC: U.S. Government Printing Office, March
1988).
Library of Congress Catalog Card Number 86-600507
For sale by the Superintendent of Documents
U.S. Government Printing Office, Washington, DC 20402-9325
(order form can be found in the back of this report)
Foreword
Technologies that were originally developed to desalinate water are widely applied
in this country to remove contaminants other than salt from freshwater supplies. Of the
many available desalination technologies, two membrane processes—reverse osmosis and
electrodialysis —are most widely used in the United States. Such widespread use would
not have been possible without the advances made in membrane technology over the last
two decades, due largely to federally sponsored research and development.
In the past when water was found to be contaminated, a new supply of uncontaminated water was developed. But, most renewable supplies of clean freshwater have now
either been tapped or are not readily available for development. OTA’S study ‘‘Protecting the Nation Groundwater from Contamination’ also found that the frequency of
groundwater contamination is increasing. Therefore, the need to decontaminate surface
and groundwater supplies of freshwater will undoubtedly increase in the future. The need
for treatment will be further increased as water quality regulations are developed under
the Clean Water and Safe Drinking Water Acts.
This study provides a technical assessment of traditional desalination techniques that
can be used for water treatment. These techniques include distillation, as well as more
recently developed membrane processes. As part of this effort OTA held a one-day workshop on July 29, 1987, with desalination and water treatment experts to review the initial
draft of this background paper and to discuss other areas of interest. The conclusions of
these discussions are invluded in this background report.
OTA is grateful for the input from the workshop participants and the desalination
community at large. The preparation of this report would have been much more difficult
without such support. As with all OTA studies, the content of this report is the sole responsibility of OTA.
U JOHN H. GIBBONS
Director
,..
Ill
Desalination Workshop Participants
William E. Warne, Chairman
Sacramento, CA
Leon Awerbuch
Bechtel National, Inc.
James Birkett
Arthur D. Little, Inc.
O. K. Buros
CH2M Hill International Corp.
Frank Coley
U.S. Geological Survey
Don C. Lindsten
Belvoir RD&E Center
U.S. Army
Lee Rozelle
Olin Chemical Corp.
Linda Schmauss
Ionics, Inc.
David Furukawa
FilmTec Corp.
James S. Taylor
Civil Engineering and Environmental Sciences
Department
Univ&-sity of Central Florida
Jack Jorgensen
National Water Supply Improvement Assoc.
Ken Trompeter
U.S. Bureau of Reclamation
Thomas M. Leahy
Department of Public Utilities
Virginia Beach, VA
NOTE: OTA appreciates and is grateful for the valuable assistance and thoughtful critiques provided by the workshop participants. The workshop participants do not, however, necessarily approve, disapprove, or endorse this background paper. OTA assumes full responsibility
for the background paper and the accuracy of its contents.
iv
OTA Project Staff—Desalination
John Andelin, Assistant Director, 07’A
Science, Information, and Natural Resources Division
Robert Niblock, Oceans and Environment Program Manager
William Barnard, Senior Analyst
Theo Colborn, Analyst
Joan Ham, Analyst
Peter Johnson, Senior Associate
Denzil Pauli, OTA Contractor
Administrative Staff
Kathleen Beil
Jim Brewer, Jr.
Sally Van Aller
.
Abbreviations
–(U.S.) Agency for International Development
AID
—Clean Water Act
CWJA
degrees C—degrees Centigrade
degrees F —degrees Fahrenheit
—Department of the Interior
DOI
—electrodialysis
ED
—(U.S.) Environmental Protection Agency
EPA
—granular activated carbon
GAC
—gallons
per day
gpd
—ion exchange
IX
lb/sq. in. —pounds per square inch
—multiple effect (distillation)
ME
—million gallons per day
mgd
—multi-stage flash (distillation)
MSF
NPDES —National Pollutant Discharge Elimination System
O W R R —Office of Water Resources Research
—Office of Saline Water
Osw
O W R T —Office of Water Research and Technology
—parts per million
ppm
—point-of-entry
POE
—point-of-use
Pou
—research and development
R&D
—reverse osmosis
RO
—Safe Drinking Water Act
SDWA
—U.S. Geological Survey
USGS
—vapor compression (distillation)
V c
Conversion Factors
To convert from:
cubic meters
U.S. gallons
millions of U.S. gallons
acre-feet
dollars/1 ,000 gallons
parts per million
degrees Fahrenheit
vi
To:
U.S. gallons
cubic meters
acre-feet
millions of U.S. gallons
dollars/acre-foot
milligrams per liter
degrees centigrade
Multiply by:
264
0.0038
3.07
0.33
325
1
0.56 X (0 F – 32)
Contents
Page
Abbreviations . . . . . . . . . . . . . . . . . . . . . . . . . . . . . . . . . . . . . . . . . . . . . . . . . . . . . . . . . . . . . . . . . . vi
Conversion Factors . . . . . . . . . . . . . . . . . . . . . . . . . . . . . . . . . . . . . . . . . . . . . . . . . . . . . . . . . . . . . . Vi
Chapterl. Introduction . . . . . . . . . . . . . . . . . . . . . . . . . . . . . . . . . . . . . . . . . . . . . . . . . . . . . . . . . 1
Overview . . . . . . . . . . . .. .. .. .. ... ... ......O . . . . . . . . . . . . . . . . . . . . . . ...........”.. 1
Historical Background. . . . . . . . . . . . . . . . . . . . . . . . . . . . . . . . . . . . . . . . . . . . . ...””.””.””” 3
General Water Use in the United States . . . . . . . . . . . . . . . . . . . . . . . . . . . . . . . . . . . . . . . . . 4
Future Water Supply Needs . . . . . . . . . . . . . . . . . . . . . . . . . . . . . . . . . . . . . . . . . . . . . . . . . . . . 5
Chapter2. Overview of Desalination Technologies . . . . . . . . . . . . . . . . . . . . . . . . . . . . . . . . . . 7
General Process Descriptions . . . . . . . . . . . . . . . . . . . . . . . . . . . . . . . . . . . . . . . . . . . . . . . . . . . 7
Pretreatmentof Incoming Feed Water . . . . . . . . . . . . . . . . . . . . . . . . . . . . . . . . . . . . . . . . . . . 14
Post Treatment of Product Water . . . . . . . . . . . . . . . . . . . . . . . . . . . . . . . . . . . . . . . . . . . . . . . 16
Selecting the Most Appropriate Desalination Technology . . . . . . . . . . . . . . . . . . . . . . . . . . . 16
Chapter 3. Domestic Applications . . . . . . . . . . . . . . . . . . . . . . . . . . . . . . . . . . . . . . . . . . . . . . . . . 17
Industrial Feed- and Process-Water Treatment . . . . . . . . . . . . . . . . . . . . . . . . . . . . . . . . . . . . 17
Industrial Wastewater Treatment . . . . . . . . . . . . . . . . . . . . . . . . . . . . . . . . . . . . . . . . . . . . . . . 18
Drinking Water Production . . . . . . . . . . . . . . . . . . . . . . . . . . . . . . . . . . . . . . . . . . . . . . . . . . . . 18
Military Uses . . . . . . . . . . . . . . . . . . . . . . . . . . . . . . . . . . . . . . . . . . . . .........” o CO”.””””. 20
Point-of-Use/Point-of-Entry, or At-Home, Water Treatment . . . . . . . . . . . . . . . . . . . . . . . . 21
Municipal Wastewater Treatment . . . . . . . . . . . . . . . . . . . . . . . . . . . . . . . . . . . . . . . . . . . . . . . 22
Desalinating Irrigation Water . . . . . . . . . . . . . . . . . . . . . . . . . . . . . . . . . . . . . . . . . . . . . . . . . . . 23
Chapter4. Desalination Costs . . . . . . . . . . . . . . . . . . . . . . . . . . . . . . . . . . . . . . . . . . . . . “.””””” 25
Desalination Cost Trends . . . . . . . . . . . . . . . . . . . . . . . . . . . . . . . . . . . . . . . . . . . . . . . . . . . . . . 25
Brackish WaterRO andED . . . . . . . . . . . . . . . . . . . . . . . . . . . . . . . . . . . . . . . . . . . . . . . . . . . 26
Seawater Desalination . . . . . . . . . . . . . . . . . . . . . . . . . . . . . . . . . . . . . . . . . . . . . . . . . . . . . . . . . 28
Municipal Wastewater Treatment . . . . . . . . . . . . . . . . . . . . . . . . . . . . . . . . . . . . . . . . . . . . . . . 29
Hidden Costs Associated With Using Salty Water . . . . . . . . . . . . . . . . . . . . . . . . . . . . . . . . . 29
Chapter 5. Environmental Considerations . . . . . . . . . . . . . . . . . . . . . . . . . . . . . . . . . . . . . . . . . . 31
Waste Concentrates . . . . . . . . . . . . . . . . . . . . . . . . . . . . . . . . . . . .+. ......O ..O.”OO.”.O “ . 3 1
Pretreatment Sludges . . . . . . . . . . . . . . . . . . . . . . . . . . . . . . . . . . . . . . . . . . . . . . . . ...”” ““””” 33
Chapter6. Desalination Industry . . . . . . . . . . . . . . . . . . . . . . . . . . . . . . ...........”..” . . . . 35
Developing International Markets Upto 1980 . . . . . . . . . . . . . . . . . . . . . . . . . . . . . . . . . . . . 35
Current International Markets . . . . . . . . . . . . . . . . . . . . . . . . . . . . . . . . . . . . . . . . . . . . . . . . . . 35
Current Domestic Markets . . . . . . . . . . . . . . . . . . . . . . . . . . . . . . . . . . . . . . . . . . . . . . . . . . . . . 36
Chapter 7. Government Involvement in Desalination . . . . . . . . . . . . . . . . . . . . . . . . . . . . . . . . 39
Past Federal Involvement . . . . . . . . . . . . . . . . . . . . . . . . . . . . . . . . . . . . . . . . . . . . . . . . . . . . . . 39
Federal Laws Indirectly Related to Desalination . .. . . . . . . . . . . . . . . . . . . . . . . . . . . . . . . . 41
State and Municipal Involvement . . . . . . . . . . . . . . . . . . . . . . . . . . . . . . . . . . . . . . . . . . . . . . . 42
Chapter8. International Involvement with Desalination . . . . . . . . . . . . . . . . . . . . . . . . . . . . . . 45
International Applications . . . . . . . . . . . . . . . . . . . . . . . . . . . . . . . . . . . . . . . . . . . . . . . . . . . . . . 45
U.S. Government Involvement in International Activities . . . . . . . . . . . . . . . . . . . . . . . . . . 47
Chapter9. Future Prospects for Desalination in the United States . . . . . . . . . . . . . . . . . . . . . 51
Increasing Use of Desalination Technologies . . . . . . . . . . . . . . . . . . . . . . . . . . . . . . . . . . . . . . 51
Non-technical Bias Against Desalination Technologies. . . . . . . . . . . . . . . . . . . . . . . . . . . . . . 52
Potential Avenues for Federal Support of Desalination . . . . . . . . . . . . . . . . . . . . . . . . . . . . . 52
Appendix A: Desalination Technologies . . . . . . . . . . . . . . . . . . . . . . . . . . . . . . . . . . . . . . . . . . . . 55
Distillation . . . . . . . . . . . . . . . . . . . . . . . . . . . . . . . . . . . . . . . . . . . . . . . . “.””. .“””””””. ““.”” 55
Reverse Osmosis . . . . . . . . . . . . . . . . . . . . . . . . . . . . . . . . . . . . . . . . . . . ...”.” .“”” .“. .“.”” “ 56
Electrodialysis . . . . . . . . . . . . . . . . . . . . . . . . . . . . . . . . . . . . . . ........”..””” . ““ o .“ “ “ .“”. 57
Ion Exchange . . . . . . . . . . . . . . . . . . . . . . . . . . . . . . . . . . . . . . . . . . . . . “.”-.”......””” ““.. 58
Freeze Desalination . . . . . . . . . . . . . . . . . . . . . . . . . . . . . . . . . . . . . . . . . . . . . . . . . . . . . . . . . . . 59
New Concepts. . . . . . . . . . . . . . . . . . . . . . . . . . . . . . . . . . . . . . . . . . . . . . ......”.””.”.”” ““o 59
Appendix B: Federal Funding for Desalination Research . . . . . . . . . . . . . . . . . . . . . . . . . . . . . 60
Appendix C: Present Desalination Costs in the United States . . . . . . . . . . . . . . . . . . . . . . . . . 61
References . . . . . . . . . . . . . . . . . . . . . . . . . . . . . . . . . . . . . . .“”””.””......” ““.””””””..”.”” “ 63
vii
Chapter 1
Introduction
OVERVIEW
General Trends
Over the last few decades desalination technologies have been used increasingly throughout the
world to produce drinking water from brackish
groundwater and seawater, to improve the quality
of existing supplies of fresh-water for drinking and
industrial purposes, and to treat industrial and municipal wastewater prior to discharge or reuse. In
the early 1950s there were about 225 land-based
desalination plants worldwide with a combined capacity of about 27 million gallons per day (mgd).
There are now about 3,500 plants worldwide with
a production capacity of about 3,000 mgd. As the
demand for freshwater increases and the quality of
existing supplies deteriorates, the use of desalination technologies will increase.
Seawater distillation plants dominated the early
desalination market, which was primarily overseas.
However, due to lower energy requirements, a
desalination process called reverse osmosis (RO)2
now appears to have a slightly lower cost than distillation for seawater desalination (unless a dual
purpose electric power/desalination plant is being
built). For brackish water desalination, RO and
another desalination process called electrodialysis
(ED) are both competitive. Other desalination technologies are used less widely due to their rudimentary development and/or higher cost. However,
there is no single desalination technology that is
considered ‘‘best’ for all uses. The selection of the
most appropriate technology depends on the composition of the feed water (prior to desalination),
the desired quality of the product water, and many
other site-specific factors. Desalination technologies
cannot produce water where there is none.
Brackish water can be most economically desalinated on a large scale (e. g., 1 mgd, or larger) at
well-operated, centralized RO or ED plants at an
overall cost (including both capital and operating
‘See box A on p. 2 for definitions of scientific terms.
‘Different desalination technologies are described briefly in ch. 2
and in more detail in app. A.
costs) of about $1.50 to $2.50 per 1,000 gallons;
for seawater, large scale distillation and RO both
cost about $4 to $6 per 1,000 gallons.3 Although
there are no developing desalination technologies
that will generate major reductions (e. g., 50 percent) in water treatment costs, industry experts believe that the costs of RO and ED should continue
to decrease as membranes, treatment equipment,
and operational procedures are improved. Future
cost reductions for distillation processes will probably be modest.
Domestic Use of Desalination
Technologies
Relative to many areas of the world the United
States has plentiful, and therefore inexpensive, supplies of freshwater. Since the colonization of the
United States, the use of freshwater has generally
increased along with our population growth and industrial development. As water use increases and
the availability of renewable supplies decreases, the
cost of developing new supplies of surface and groundwater increases. These trends will probably continue. Water pollution also requires increasing
levels of water treatment, including the use of some
desalination technologies. In some areas of the
country (e. g., southern California) it may be cheaper
to use desalination technologies to treat either
brackish water or irrigation drainage water than
to develop new supplies of surface water (via reservoirs and diversions).
As the cost of developing and treating water supplies increases, the use of desalination technologies
will probably increase in this country in the following six areas:
1. RO and ED of brackish groundwater will supply drinking water for some small to midsize
inland communities in the water-limited West
3
Under less-than-ideal operating conditions these costs may be
higher. Unless otherwise stated all dollar values in this report are given
in terms of 1985 dollars.
2
and for some rapidly growing, mid-size communities along our coasts.
2. A few large municipalities in the West will increasingly use RO or ED to demineralize and
treat wastewater from sewage treatment plants
3.
Box A. —Definition of Scientific Terms
Brackish water— in this report, water containing significant levels (i. e., greater than 500 ppm)
of salt and/or dissolved solids, but 1ess than that
found in seawater (35,000 ppm dissolved solids).
Less brackish water (i.e., containing between 500
ppm and 3,000 ppm dissolved solids) mayor may
not require desalination depending on the water
use; moderately brackish water (i. e., containing
between 3,000 ppm and 10,000 ppm dissolved
solids) usually requires desalination prior to use;
highly brackish water (i.e., containing between
10,000 ppm and 35,000 ppm dissolved solids)
would probably require a level of treatment comparable to seawater.
Desalination-processes used to remove salt
and other dissolved minerals from water. Other
contaminants in water (e. g., dissolved metals, bacteria, and organics) may also be removed by some
desalination processes.
Freshwater—water with levels of dissolved salt
and other minerals that are low enough (typically
less than 500 ppm) to make desalination unnecessary for most uses. However, depending on its
quality, freshwater may have to be treated in some
way prior to use.
Ions—positively or negatively charged atoms or
groups of atoms that are often found dissolved in
water. Cations are positively charged; anions are
negatively charged.
Potable water—water suitable for drinking that
generally has less than 500 ppm of dissolved minerals (including salt).
Product water—the freshwater produced from
a desalination operation.
Seawater—water that is withdrawn from the
ocean (with about 35,000 ppm salt and dissolved
solids).
Waste concentrate— salty wastewater that is
produced by desalination operations and must be
disposed of. Salt concentrations in waste concentrates can exceed 50,000 ppm.
4.
5.
6.
(and perhaps from irrigation operations) for
direct or indirect reuse as drinking water.
With more stringent Federal regulations on
drinking water, public and private suppliers
throughout the United States will increase
their use of RO, ED, and perhaps a desalination process called ion exchange, at centralized plants to remove contaminants (e. g.,
dissolved minerals, heavy metals, dissolved
organics, and pathogens) from both surface
water and groundwater supplies.
As water quality regulations become more
stringent, industries may increase their use of
RO, ED, and other water treatment processes
to remove potentially toxic contaminants from
wastewater prior to reuse or discharge.
Small RO and distillation units will be used
increasingly in homes for ‘‘point-of-use’ treatment of drinking water in response to individual concerns about water quality.
Industries will continue to use desalination
technologies to treat the water used in the
manufacture of various products, such as paper, pharmaceuticals, and food products.
Much of the development of desalination technologies in the past three decades was sponsored
by the U.S. Government. In fact, since 1952 the
Federal Government has spent just over $900 million (in 1985 dollars) in support of desalination research, development, and demonstration projects.
Federal funding for most desalination research was
discontinued in 1982. This research program was
primarily responsible for the development of reverse
osmosis, and for many advances and improvements
in distillation technologies. The United States still
holds a technological advantage in some, but not
all, areas of desalination. U.S. industry investment
in desalination R&D is now probably about $5 million to $10 million per year.
There are now about 750 desalination plants in
the United States with a combined production capacity of about 212 mgd. This water is used primarily for industrial uses, and secondarily for drinking water. There are desalination plants in 46 States
and on two island territories. Between 70 and 80
percent of this capacity is provided by RO (33).
The amount of desalinated water produced in this
country is equivalent to about 1.4 percent of the
3
15,000 mgd that is consumed4 for domestic and industrial purposes. The use of desalination technologies for treating fresh, brackish, and contaminated
water supplies will continue to increase in the United
States. However, large-scale seawater desalination
will probably not be cost-effective in this country
for some years to come.
conventional technologies, such as sedimentation,
filtration, and disinfection. However, relatively
small desalination plants may be of particular value
for tourist hotels, construction sites, and certain isolated communities that have no other readily available sources of freshwater. In very remote areas
small solar stills or solar-powered desalting units
may be an appropriate desalting alternative.
Overseas Use of Desalination
Technologies
The majority of industrialized countries are located in temperate zones where supplies of freshwater are adequate. Therefore, desalination technologies will be used in these countries primarily
for industrial purposes, and secondarily for treating drinking water.
In predominantly arid regions of the world, and
especially in the Middle East, where conventional
sources of fresh water (e. g., rivers, lakes> reservoirs
or groundwater) are not readily available, seawater
desalination will continue to supply drinking water.
In some countries, desalinated water may also be
used for government subsidized agricultural operations where self-sufficiency and national security
are primary objectives. However, desalinating irrigation water for traditional open-field agriculture
will probably not be economically competitive in
the foreseeable future anywhere in the world. In
the absence of free market constraints (e. g., government subsidies), it is usually more cost-effective
to import crops from water-rich agricultural regions.
In most lower-tier developing countries the vast
majority of water will continue to come from essentially salt-free surface and groundwater supplies.
It is estimated that about half of the people in these
countries do not have adequate (e. g., disinfected)
drinking water supplies; about 70 percent have inadequate sanitation facilities. Water treatment, if
there is any, generally involves the use Of more
4Water may be withdrawn from a supply, used for some purpose
as cooling, and then discharged direcdy or indirectly into a water
body so that it can be reused later. Water is consumed when it is
withdrawn, used up perhaps in a manufacturing process, and is not
available for reuse.
such
Scope of This Study
This report provides a state-of-the-art evaluation
of technologies that were developed to desalinate
water. Many of these same technologies can also
be used to remove contaminants other than salt
from water supplies. Water treatment techniques
that remove contaminants other than salt and/or
dissolved minerals are beyond the scope of this
study. The policy implications associated with the
use of desalination technologies are briefly addressed
in the chapter discussing future prospects for desalination in the United States.
Generalizations about the capabilities and uses
of desalination technologies have been made to the
extent possible, recognizing that there are exceptions to most generalizations. Selecting the most
appropriate desalination technology for a particular use depends on many site-specific factors that
must be evaluated in detail by qualified engineers
and scientists. In other words, this paper should
not be used as the only source of information when
evaluating different desalination technologies for
a specific use.
HISTORICAL BACKGROUND
The hydrologic cycle provides the Earth with a
continuous supply of fresh, and for the most part,
distilled water. The sun drives the cycle by providing the energy to evaporate water from the ocean
and from water bodies on land. This water vapor,
which accumulates as clouds, condenses in the
cooler upper atmosphere and falls to the Earth’s
surface in the form of rain or snow.
4
Man has distilled freshwater from seawater for
many centuries. Egyptian, Persian, Hebrew, and
Greek civilizations all studied various desalination
processes. Aristotle and Hippocrates both advocated the use of distillation in the 4th century B.C.
(37). During the 1700s both the United States and
British navies were making simple stills from pots
and by the mid- 1800s small stills were being built
into shipboard stoves. By the turn of the century
various types of land-based distillers were being
used in several arid parts of the world (4).
By the 1940s all major naval vessels and passenger ships had their own stills. During World War
II the U.S. Navy built a 55,000 gallons per day
(gpd) distillation plant on Johnston Island (87) and
several smaller stills on other Pacific islands. Prior
to 1953 there were only about 225 land-based
desalination plants worldwide with a combined capacity of about 27 mgd (24). In the late 1950s
desalination took on added importance with the
construction of several large distillation plants in
the Middle East where freshwater supplies are extremely limited.
As the demand for freshwater increased and production costs decreased in the 1960s, the use of
desalination increased, especially in arid regions of
the world. The development of nuclear power at
this same time also brought visions of inexpensive
electricity to power distillation plants (90). It was
hoped that in the coming decades ‘‘dual purpose’
reactors would produce power and distill seawater
at costs ranging from $0.35 to $1.00 per 1,,000 gallons; abundant supplies of distilled water would
‘‘make the deserts bloom and the cities thrive’
(23,32,70). However, the optimism of the 1960s
mellowed considerably in the 1970s when it became
evident that the costs of desalination using nuclear
power would be much higher than many had expected.
The costs of distillation were significantly reduced
during the 1960s through advances in plant design,
heat transfer technology, scale prevention, and corrosion resistance. Worldwide desalination capacity grew from about 60 mgd in the early 1960s to
about 1,000 mgd supplied by 1,500 plants in the
late 1970s (22,24,33,87). Although distillation
plants dominated the early desalination market, RO
and ED began to take over an increasing market
share in the early 1970s (33,50).
In 1986 there were 3,500 desalination plants in
105 countries worldwide (operating or under construction) with a combined capacity of about 3,000
mgd.5 Almost 60 percent of this capacity is located
in the Middle East. Saudi Ar’abia alone has about
800 plants that produce a total of about 915 mgd,
or about 30 percent of the world’s desalinated
water. Saudi Arabia’s 40-unit Al Jubail II is the
world’s largest desalination facility in operation with
a capacity of almost 250 mgd. The United States
and its territories have about 750 plants that account for about 10 percent of the world’s capacity.
‘This total capacity for the world includes all the desalination plants
ever built; the older plants since retired have not been subtracted from
this total. Therefore, the actual total is probably about 10 percent to
15 percent less than the 3,000 mgd. For the total desalination capacity in the United States it was assumed that plants built prior to, and
after 1970, had operating lifetimes of 10 years and 15 years, respectively. Also, the United States total does not include the 72 mgd RO
plant at Yuma, AZ, which is not yet operational.
GENERAL WATER USE IN THE UNITED STATES
Sources of Fresh and Brackish Water
Precipitation within the 48 contiguous states
averages nearly 30 inches a year, or about 4.2 billion mgd. The majority of this precipitation falls
in the East. In fact, most areas of the United States
west of the Great Plains receive less than 20 inches
of rainfall a year; during periodic droughts rainfall is even less. In addition to this renewable supply, about 150 trillion gallons of freshwater are
stored in surface lakes and reservoirs (89). and 200
to 600 times this amount is stored in aquifers of
fresh groundwater (56,89).
Potentially developable brackish aquifers are
known to occur in many parts of the United States
(25). However, limited data suggest that brackish
groundwater is quite a bit less abundant than fresh
groundwater. Furthermore, the occurrence of
brackish aquifers varies considerably from one region of the country to another. The presence of
brackish groundwater may be particularly impor-
5
tant in those arid and semiarid areas of the country where existing supplies of freshwater are scarce
and/or largely utilized. These areas are found in
the following western States: Arizona, California,
Colorado, Idaho, Kansas, Montana, Nebraska,
Nevada, New Mexico, North and South Dakota,
Oklahoma, Oregon, Texas, Utah, Washington,
and Wyoming.
Water Consumption (69)
According to data collected in 1980, about 450
billion gallons of fresh and saline water, or about
2,000 gallons/person, are withdrawn from surface
and groundwater supplies each day for various
commercial and domestic uses. Much of the freshwater that is withdrawn is discharged after use into
adjacent surface supplies for subsequent reuse in
downstream areas. However, about 100,000 mgd
of freshwater are actually consumed (e. g., via plant
transpiration, evaporation, etc. ) and are not readily available for reuse. Consumptive uses of water
include:
●
●
●
Irrigation: About 81 percent (i. e., 81,000
mgd) of freshwater consumed in this country
irrigates about 58 million acres of farmland,
mostly in the West. About 60 percent of this
water comes from major surface water diversions; the rest comes from groundwater
aquifers.
Industry: About 8 percent (i. e., 8,000 mgd)
of all freshwater is consumed by industry. The
level of water treatment required by industry
depends on its particular use and the location
of the industry. Most industries that require
large volumes of processing water are located
where water supplies are naturally abundant.
Domestic Use: Over 200,000 public water systems in the United States sell about 34,000
mgd to more than 200 million customers for
domestic use, for public and municipal use,
and for some industrial and commercial uses.
●
Average domestic use in this country is believed to be between 120 and 150 gpd per person (85). About 7 percent (i. e., 7,000 mgd)
of all freshwater consumption is for domestic uses.
Rural Use: There are about 40 million people living in rural areas of the United States.
About 90 percent of all rural water systems depend on groundwater from about 12 million
private wells for drinking water, livestock, and
other uses (besides irrigation). Rural use accounts for 4 percent (i. e., 4,000 mgd) of all
freshwater consumption.
Water Quantity/Water Quality Linkage
Only about 20 percent of water withdrawn for
use is actually consumed. The rest is generally discharged into rivers, lakes, and estuaries as wastewater or irrigation return flows, and can be subsequently reused at downstream locations. Each time
water is reused it can be expected that the concentration of pollutants (including salt) in the discharged water will increase. Water quality problems tend to be greater where the frequency of water
reuse is high, such as in water-limited areas of the
West, and along waterways adjacent to heavily industrialized areas.
In coastal areas most freshwater aquifers become
increasingly brackish as they extend offshore. If the
rate at which fresh groundwater is withdrawn exceeds the rate of freshwater recharge, more brackish water from offshore will move inland and progressively increase the salt concentration in the aquifer.
Depending on the aquifer configuration and the
brackish water withdrawal rates, increasing salinity levels in coastal wells may occur over a period
of months to many years. Saltwater intrusion has
been a significant problem for Long Island, NY,
Florida, southern California, and several other
coastal areas.
FUTURE WATER SUPPLY NEEDS
A comparison of past analyses of water use indicates that both water withdrawals and water consumption in the United States gradually increased
through 1980. More recent data collected for 1985
indicate that both water withdrawals and water consumption have decreased somewhat since 1980.
This shift may be due to more eflicient use of water,
decreased precipitation over the last 5 years, a shift
6
toward less water intensive industries in this country, and/or increased accuracy of the data collected
(68).
Despite this apparent decrease in water use over
the last 5 years, the demand for water will probably
continue to increase over the next several decades.
In fact, water demand exceeds available supplies
during periodic droughts and in many water-limited
areas of the country (e. g., most of the West).
Droughts occur more frequently in the West. In
areas of the country, where readily available supplies of surface and groundwater have already been
developed, dams and other water diversions are be-
coming more expensive and time consuming to construct and often meet with opposition due to potential environmental impacts. For example, the
Two Forks Project, a dam on the South Platte River
southwest of Denver, has been in the planning process for about 10 years. Although $37 million has
been spent on planning and preparation of an environmental impact statement, the project has yet to
be approved (35). Water from this project is projected to cost about $10 per 1,000 gallons. As the
cost of developing new supplies of water increase,
the level of water treatment and reuse will also increase,
Chapter 2
Overview of Desalination Technologies
GENERAL PROCESS DESCRIPTIONS
There are five basic techniques that can be used
to remove salt and other dissolved solids from
water: distillation, reverse osmosis (RO), electrodialysis (ED), ion exchange (IX), and freeze desalination. Distillation and freezing involve removing
pure water, in the form of water vapor or ice, from
a salty brine. RO and ED use membranes to separate dissolved salts and minerals from water. IX
involves an exchange of dissolved mineral ions in
the water for other, more desirable dissolved ions
as the water passes through chemical ‘‘resins. The
relative percentages of different types of desalination plants worldwide is shown in table 1.
In addition to removing salts and other dissolved
solids from water, some of these desalination techniques also remove suspended material, organic
matter, and bacteria and viruses; however, they will
not produce water where there is none. These techniques were originally developed for treating large
quantities of water (i. e., hundreds or thousands of
gpd) at a central location, but some have been
adapted recently for small scale use in the home.
These desalination processes are described briefly
below and in more detail in appendix A.
Distillation
Salt- and mineral-free water can be separated
from seawater by vaporizing some of the water from
the salt solution and then condensing this water vapor on a cooler surface. This is the same phenome-
non that occurs when water vapor (or steam) inside a warm house condenses on a cold window
pane, or when water vapor condenses to form rain
or snow. This separation process is called distillation.
The vaporization of water molecules can be accelerated by heating the brine to its boiling point
and/or reducing the vapor pressure over the brine.
To maximize the efficiency of the distillation process, the heat given up during condensation is used
to heat the incoming feed water, or to reheat the
unvaporized brine. Because distillation involves
vaporizing water from the salt y feed water, the
energy required for distillation, as well as its costs,
do not increase appreciably with increasing salinity of the feed water. Depending on the plant design, distilled water produced from seawater normally has salt concentrations of 5 to 50 ppm.
Between 25 and 65 percent of the feed water is recovered by most distillation plants.
Four major processes are now used to distill water
on a commercial or semi-commercial scale. Both
‘‘multiple-effect’ (ME) (figure 1) evaporation and
‘‘multi-stage flash’ (MSF) (figure 2) distillation involve boiling the brine in adjacent chambers at successively lower vapor pressures without adding
heat. With “vapor compression” (VC) (figure 3)
the water vapor from salty feed water is collected
and compressed thereby condensing the vapor.
“Solar” distillation typically occurs inside a glass
Table I.—Relative Distribution of Different Types of Desalination Plants Worldwide
Process
Distillation
MSF . . . . . . . . . . . . . . . . . .
ME . . . . . . . . . . . . . . . . . . .
Vc . . . . . . . . . . . . . . . . . . .
Membrane
RO . . . . . . . . . . . . . . . . . . .
ED . . . . . . . . . . . . . . . . . . .
Percent
of total
532
329
275
15.1
9.3
7.8
1,955
145
66
64.5
4.8
2.2
1,742
564
49.4
16.0
709
139
23.4
4.6
2.4
85
100.0
3,527
Total . . . . . . . . . . . . . . . . . . .
SOURCE: International Desalination Associate’s desalination plant inventory, 1987.
Other . . . . . . . . . . . . . . . . . . .
Capacity
(mgd)
Percent
of total
Number of plants
18
0.6
3,032
100.1
7
8
E
.-G ++
s
al
c
m
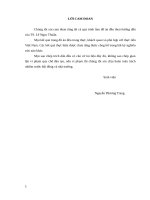
Figure 2.—Conceptual Diagram of the Multistage Flash (MSF) Process
1st STAGE
2nd STAGE
3rd STAGE
I
CD
aJ
I
N
Steam
from Boiler
Seawater
Feed
Freshwater
Product
Brine
Discharge
Condensat
Returned
to Boiler
1
J
LOW TEMPERATURE
LOW PRESSURE STAGE
HIGH TEMPERATURE
HIGH PRESSURE STAGE
Note. For simplicity, no heat rejection section is shown In this
diagram–see Figure 315.
FW =
STEAM
EJECTOR
Freshwater
~
~+
To
remove
non-condensable
The seawater feed Increases in temperature as it moves
toward the brtne heater where sufficient additional heat is
added to permtt it to flash boil iri the first stage.
gases.
Tube bundle which serves as a heat recovery and condenser
section. Incoming seawater inside the tubes is heated by
vapor condensing on the outside of the tubes.
The freshwater produced by condensation in each stage I S
flashed In subsequent stages to recover add!tlonal heat.
Demlster-Usually screening or wire mesh which removes
saltwater droplets entrapped in the vapor.
Brtne flashes when introduced into the stage wh!ch has a
reduced pressure, permitting rapid boIII ng to occur lmmedl ately.
~
M
BE R
~
rtne moves to the next stage to be flashed again to produce
additional vapor and transfer heat to the heat-recovery
section.
I
SOURCE: O.K. Buros, et al., “The IJSAID Desalination Manual,” U.S. Agency for International Development, Washington, DC, prepared by CH2M Hill International Corp., August 1980.
Figure 3.—Simplified Flow Diagram for a Spray-Film VaporOCompression Process
+
A portion of the hot brine is recirculated
to the spray nozzles for further
tion on the tube bundle.
vaporiza-
V a p o r
T, P,
.
heat enewv W
The vapor gems
b$in9
compressed bv the vapor compressor.
Seawater and
Recirculated
Brine
VAPOR
COMPRESSOR
I
I
4
kECl RCU LATION
PUMP
A steam jet ejector could replace the
vapor compressor where surplus steam is
available.
.
u s
g g
O L
T 2 > T}
P* > P,
t
HEAT
E~HANGER
I “1
n
Brine
Discharge
I
I
I
1
I
-
Freshwater
Product
, B r i n e
Discharge
Seawater
Feed
+
‘L-J
Pretreatment
Chemicels
This tvpe of electric-driven sprav film vapor compression unit
is used for facilities such as hotels, industrial plants, and
power stations. It is generallv available in capacities from
2,500 to 30,000 gpd [9.5 to 114 m 3 / d ]
SOURCE: O.K. Buros, et al., “The USAID Desalination Manual,” U.S. Agency for International Development, Washington, DC, prepared by CH2M Hill International Corp., August 19S0.
11
enclosure, similar to a greenhouse, where water vapor rising from sun-heated brine condenses on the
cooler inside surface of the glass. The droplets of
distilled water that run down the glass are then collected in troughs along the lower edges of the glass
(figure 4).
RO membranes are manufactured commonly in
the form of hollow, hair-like fibers; or several alternating layers of flat-sheet membranes and open
“spacer” fabric which is rolled into a spiral configuration (figure 6). Membrane selection depends
largely on feed water characteristics and membrane
costs.
Reverse Osmosis
With RO, salty water on one side of a semipermeable membrane is typically subjected to pressures of 200 to 500 lb/sq in. for brackish water, and
800 to 1,200 lb/sq in. for seawater. “Pure” water
will diffuse through the membrane leaving behind
a more salty concentrate containing most of the dissolved organic and inorganic contaminants (figure
5). Brackish water RO plants typically recover 50
to 80 percent of the feed water, with 90 to 98 percent salt rejection. For seawater, recovery rates vary
from 20 to 40 percent, with 90 to 98 percent salt
rejection.
Electrodialysis (ED)
With this technique, brackish water is pumped
pressures between several hundred flat, parallel, ion-permeable membranes that are assembled
in a stack. Membranes that allow cations to pass
through them are alternated with anion-permeable
membranes. A direct electrical current is established
across the stack by electrodes positioned at both
ends of the stack. This electric current ‘‘pulls’ the
ions through the membranes and concentrates them
between each alternate pair of membranes. Partially
at low
Figure 4.— Basic Elements in a Solar Still
BASIC ELEMENTS IN SOLAR DISTILLATION
1 ) Incoming Radiation (Energy)
Sun
2) Water Vapor Production from Brine
3) Condensation of Water Vapor (Condensate)
4) Collection of Condensate
DISTILLATE
OR CONDENSATE
TROUGH
BASIN
The
inside of the basin is usually black to efficiently absorb
radiation and insulated on the bottom to retain heat.
SOURCE: O.K. Buros, et al., “The USAID Desalination Manual,” U.S. Agency for International Development, Washington, DC, prepared by CH2M Hill International Corp.,
August 1980.
22
NORMAL
OSMOSIS
REVERSE
OSMOSIS
FRESH SALINE
WATER WATER
)
/
SOURCE: S.L. Scheffer, H.D. Holloway, and E.F. Miller (R.M. Parsons Co.), “The Economics of Desalting Brackish Waters for Regional, Municlpai and Industrial Water
Supply in West Texas,” Off Ice of Saline Water, R&D Progress Report 337, 1967.
Figure 5B.—Elements of a Reverse Osmosis System
HIGH
PRESSURE
PUMP
P
MEMBRANE
Brine
Sal ine
Discharge
Solution
A
membrane
box
with
a
assembly
diagonal
is
line
generally
across
it
symbolized
as
representing
a
rectangular
the
membrane.
SOURCE: O.K. Buros, et al., “The USAID Desailnatlon Manual,” U.S. Agency for International Development, Washington, DC, prepared by CH2M Hill International Corp.,
August 19S0.
Figure 6.—Spiral Membrane-Cut-Away View With Elements in a Pressure Vessel
water
MEMBRANE (cast on fabric back, ng)
FEE DWATE R &
BRINE SPACE Ff
POROUS
PRODUCT WATER C A R RI E R
MEMBRANE (cast on fabric
backing)
FEE DWATE R &
BRINE SPACE R
Desalted water passes through the membranes on both s$des
of the porous product water carrier.
Feedwater
WI
Brine
C o n c e n t r a t e ~ (I
Adar)red ~ ,1 )rn
Produ
Wate
through the porous material In la
ts and flows through the holes In
PRESSURE
PRODUCT
wATER
OUTLET
~v(j~dndL IICS
W a l t e r systems d ,aqr~rr
VESSEL
ANTI-TELESCOPING
BRINE
[ / / / L n / / / / / / / / L n / / / / / /
“E R
BRINE
OUTLET
CONNECTOR
CROSS SECTION OF PRESSURE VESSEL WITH 3-MEMBRANE ELEMENT
SOURCE: O.K. Buros, et al., “The USAID Desalination Manual,” IJ.S, Agency for International Development, Washington, DC, prepared by CH2M Hill International Corp., August 1980.
14
desalted water is left between each adjacent set of
membrane pairs (figure 7).
Scaling or fouling of the membranes is prevented
in most ED units by operationally reversing the
direction of the electrical current around the stacks
at 15- to 30-minute intervals. This reverses the flow
of ions through the membranes, so that the spaces
collecting salty concentrate begin collecting less salty
product water. Alternating valves in the water collection system automatically direct the flow in the
appropriate direction. Typical freshwater recovery
rates for ED (reversal) range from 80 to 90 percent of the feedwater volume (65).
Figure 7.–ElectrodiaIysis (ED)
+ 1 , -
Sdllu tad
+
.,. .
;.# .. .
,.. ,
Brim
~
~
Producl lntor
Ion Exchange (IX)
In this process undesirable ions in the feed water
are exchanged for desirable ions as the water passes
through granular chemicals, called ion exchange
resins. For example, cation exchange resins are
typically used in homes and municipal water treatment plants to remove calcium and magnesium ions
in ‘‘hard’ water, and by industries in the production of ultra-pure water. The higher the concentration of dissolved solids in the feed water, the
more often the resins will need to be replaced or
regenerated. With rising costs for resins and for disposing of regeneration solutions, IX is now competitive with RO and ED only in treating relatively
dilute solutions containing a few hundred ppm of
dissolved solids.
Freeze Desalination
When saltwater freezes, the ice crystallizes from
pure water leaving the dissolved salt and other
minerals in pockets of higher salinity brine. In fact,
1 I
I
/
POWV9 Jon
~rmeabla rnombmrn
J
p.fm.~blo
rnom~m
J
SOURCE: O.K. Buros, et al., “The USAID Deaallnation Manual,” U.S. Agency for
International Development, Washington, DC, prepared by CH2M Hiii
International Corp., August 1980.
freeze desalination has the potential to concentrate
a wider variety of waste streams to higher concentrations with less energy than any distillation process (55). Traditional freezing processes involve five
steps:
1. precooking of the feed water,
2. crystallization of ice into a slush,
3. separation of ice from the brine,
4. washing the ice, and
5. melting the ice.
New research efforts are attempting to reduce the
number of steps, especially the need to wash the
ice crystals. Although small scale commercialization of freezing was attempted in the late 1960s,
there were still significant operational problems.
Only a few isolated commercial freezing plants now
exist (figure 8).
PRETREATMENT OF INCOMING FEED WATER
The efficiency of desalination equipment can be
significantly reduced due to fouling of membrane
surfaces with solids (e. g., colloidal material, dissolved organics, bacteria, etc. ) and/or the formation of scale (due to the precipitation of dissolved
minerals). Consequently, the water fed to desalination units usually requires some type of pretreatment. The level of pretreatment required depends
on the desalination process used, and feed water
quality.
Pretreatment may include coagulation and settling; filtration; treatment with activated carbon to
remove organics; disinfection to kill microorganisms; dechlorination (when chlorine and chlorine
sensitive membranes are used); and the addition
of acid, polyphosphates, or polymer-based additives
to inhibit scaling (67,91). Generally speaking, these
are all standard, water treatment techniques. Pretreatment costs may account for 3 percent to 30 percent of the total cost of desalination.
15
I
I
II
I
\
In
c
.-
0
5
c
E
lx
w
N
LLl
w
a
‘1
L.
UJ
—— I
c
.-
%!
1?
IA
.-
; ‘4
EI01V3U3V3CI
..
P
.. .
. ... ... ... ... . .. . .. . .. . . .
c%
cd
16
POST TREATMENT OF PRODUCT WATER
Depending on the quality of the product water
and its intended use, some post treatment of the
product water may be required. For example, distillation and ion exchange can produce water with
such a low mineral content that the water may corrode metal pipes. Post treatment processes include
carbon dioxide removal, pH adjustment, chemical addition, and disinfection. In some cases desalted
water may be blended with water supplies from
other sources to improve taste, to extend supplies
of desalted water, and to improve the quality of
other water (91).
SELECTING THE MOST APPROPRIATE
DESALINATION TECHNOLOGY
Selec ion of the most appropriate technology depends on many site-specific factors including the
concentration of organic and inorganic material in
the incoming feed water (table 2), the desired quality of the treated water, the level of pretreatment
that may be required prior to desalination, the
availability of energy and chemicals to treat the
water, and the ease with which waste concentrates
can be disposed (91). In fact, both RO and ED
membranes can be tailor-made based on the feed
water composition. Many other factors that must
also be considered include availability of construction and operating personnel, waste concentrate disposal, environmental considerations, maintenance
requirements, and cost. An engineering study of
site-specific conditions within the context of a longterm water resources development plan is usually
required prior to selecting a specific process for
desalinating or demineralizing large quantities of
water.
Table 2.—Desalination Techniques
Typical applications
Brackish water
Technique
Distillation . . . . . . . . . . . . . . . . .
Electrodialysis. . . . . . . . . . . . . .
Reverse osmosis . . . . . . . . . . .
Ion exchange. . . . . . . . . . . . . . .
KEY: P - Primary application
0-3,000
3,000-10,000
ppm
ppm
s - Secondary application
t = Technically possible, but not economic
SOURCE: Office of Technology Assessment, 19S7.
s
b
P
P
;
Higher
Seawater
35,000 ppm salinity brines
P
P
P
t
P
s
Chapter 3
Domestic Applications
The United States has about 750 desalination
plants (with individual capacities greater than
25,000 gpd) with a combined capacity of about 212
m gd, orr about 1.4 percent of the 15 billion gallons of freshwater consumed each day for domestic and industrial purposes. Between 70 percent and
80 percent of this capacity is provided by reverse
osmosis plants located in 44 States. Although this
country ranks second in the world in the number
of desalination plants, it ranks fourth in capacity
with almost 10 percent of world production. The
largest non-Federal plant in the United States is
the RO plant operated by the city of Cape Coral,
Florida (33). About 70 percent of the desalination
plants in this country are used for industrial purposes. There are also more small RO units (i. e.,
producing less than 25,000 gpd) than large plants
in the United States, but their combined capacity
is relatively low. These units are used by hospitals,
small industries, pleasure boats, merchant ships,
off-shore drilling rigs, and the military.
Desalination technologies can be cost-effective
not only to obtain freshwater from brackish and sea1 There are many tens of thousands of desalination plants with individual capacities of less than 25,000 gpd. The combined capacity
of these smaller plants is probably small relative to the combined capacity of larger plants.
water, but also to remove contaminants from drinking water supplies, sewage wastewater, industrial
feedwater and wastewater, and irrigation drainage
water. In fact, desalination technologies may be
more widely applied in this country to decontaminate water than to remove salt. As problems and
concerns about water quality increase in the future,
the use of desalination technologies, along with
other water- treatment techniques, will increase.
Legal, environmental, and sociopolitical factors in
some areas of the country may also encourage the
desalination of brackish groundwater, rather than
transfer of surface waters from other counties or
States. Therefore, desalination should be included
as a viable option in any evaluation of water-supply
alternatives. 2
The current and potential uses of desalination
technologies for desalination and water treatment
are evaluated in the following discussion.
20ver the long-term desalination could become very important if
predictions of global warming and other climate modifications resulting
from increased levels of atmospheric carbon dioxide prove to be true.
For example, increased desertification could create severe water shortages in semiarid and warmer regions of the world, and elevated sea
levels could increase the degree of saltwater intrusion in many coastal
aquifers.
INDUSTRIAL FEED- AND PROCESS-WATER TREATMENT
Industry consumes about 8 billion gallons of
freshwater per day (69). Although water requirements vary significantly from one use to another,
high-quality water is needed for manufacturing
many products including textiles, leather, paper,
pharmaceuticals and other chemicals, beverages,
and dairy and other food products. In fact, the
majority of desalination capacity in the United
States is used by industries to treat feedwater,
processwater, or wastewater prior to its discharge
or reuse.
Water treatment for different industries varies,
but typically involves conventional water treatment
techniques (e. g., filtering, softening, etc.). More
sophisticated water treatment systems used by industries incorporate RO, ED, IX, or a combination of these and other treatment processes. For example, ultra-pure, deionized water is used by the
electronics industry for manufacturing integrated
circuits and pharmaceuticals, and for medical applications, electroplating, electric power generation,
and some petroleum processes (42,55).
17
18
INDUSTRIAL WASTEWATER TREATMENT
There are over 200,000 industrial facilities and
commercial establishments that discharge an estimated 18 billion gallons of wastewater daily. About
three-fourths of this wastewater is discharged into
adjacent waterbodies, while the remaining quarter is discharged into municipal sewage treatment
systems (52). Desalination technologies can be used
to remove and concentrate contaminants in wastewater, thereby reducing potential problems associated with its disposal or reuse.
Although not widely used now for treating industrial wastewater, the attractiveness of RO, ED,
and other desalination techniques will probably increase as regulatory restrictions on wastewater discharges become increasingly stringent under EPA’s
National Pollutant Discharge Elimination System.
This trend will also intensify as the cost of membrane processes decreases. Especially in areas where
water supplies are limited, industries will increasingly treat and reuse their wastewater (42,55). In
some states, ‘‘zero discharge’ requirements have
forced some industries to use VC distillation in
combination with RO to minimize or eliminate
wastewater discharges.
In some cases, industries (e. g., photographic,
electroplating, pulp and paper, etc. ) may use desalination technologies to recover valuable chemicals.
However, recovery of potentially useful material
from wastewater is often not economic because of
low material concentrations in the wastewater. Furthermore, the adverse economic effects of faulty
wastewater treatment and recovery processes can
be significant. If recovery is practiced, industries
generally favor segregating, treating, and reusing
waste streams from individual processes rather than
treating the combined flow from all processes.
Whether or not desalination technologies would be
used in such recovery processes would depend primarily on the nature of the waste streams (55).
DRINKING WATER PRODUCTION
About 140, or 20 percent, of the desalination
plants (with capacities of greater than 25,000 gpd)
in the United States are used to treat brackish
groundwater for municipal drinking water supplies.
Florida alone has a total of about 70 such plants.3
Most of these systems rely on RO. With future improvements and cost reductions in membrane technologies, desalination will become increasingly attractive for supplying drinking water to some small
(e.g., with populations of 10,000) to midsized (e.g.,
with populations of a few hundred thousand) communities in the West and along our coasts where
brackish groundwater supplies are often adequate
and waste concentrate disposal is economically feasible. 4 However, high costs may limit the use of sea3Florida also has another 42 municipal plants with production capacities of less than 25,000 gpd.
‘These numbers are based in part on an unpublished evaluation
of potential sites for demonstrating different desalination techniques
conducted by the Office of Water Research and Technology in the
late 1970s. A 1 mgd plant will supply the water needs for about 7,000
people using just under 150 gpd over a typical year. In some areas
of the country and during hot, dry weather domestic water peak demand may be another 30 percent higher (26).
water desalination in the United States for some
time to come.
Many large metropolitan areas in the United
States (i.e., with populations of greater than a million) have fewer problems obtaining adequate supplies of drinking water at reasonable costs, than
smaller communities. There are several reasons for
this. First, there are significant economies-of-scale
associated with developing large supplies of water
from conventional sources (e.g., reservoirs, freshwater aquifers, etc. ) even if this involves transporting the water over long distances, and treating it
prior to use. These costs are normally less than comparable costs associated with desalinating brackish
groundwater. Second, many metropolitan areas are
located on major rivers or near larger surface supplies of freshwater. Finally, many larger cities have
factored future water supply needs into long-term
growth scenarios,
In the West, rapidly growing metropolitan areas
are having increasing problems finding freshwater
as available surface and groundwater supplies are