Tài liệu HPLC for Pharmaceutical Scientists 2007 (Part 4B) pdf
Bạn đang xem bản rút gọn của tài liệu. Xem và tải ngay bản đầy đủ của tài liệu tại đây (610.85 KB, 30 trang )
An empirical formula representing the variation of the δ quantity with mole
fraction of acetonitrile (χ) from the values in Table 4-4 could be determined
using equation (4-20). The dependence of δ versus the mole fraction of ace-
tonitrile is shown in Figure 4-25.
(4-20)
An empirical formula representing the variation of the δ quantity with mole
fraction of methanol (χ) from the values in Table 4-5 could be determined
using equation (4-21). The dependence of delta versus the mole fraction of
methanol is shown in Figure 4-26.
(4-21)
δ=
()
+0 4826 0 2632
2
..cc
MeOH
δ= −
()
+393 003
2
..cc
MeCN
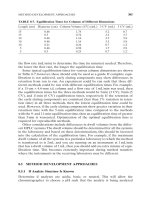
pH EFFECT ON HPLC SEPARATIONS 173
TABLE 4-5. Delta Values for Various Methanol/Water Compositions [73, 74]
Volume fraction MeOH (φ): 0 0.1 0.2 0.3 0.4 0.5 0.6
Mole fraction: 0 0.047 0.1 0.16 0.229 0.308 0.4
δ: 0 0.01 0.03 0.05 0.09 0.13 0.18
Figure 4-25. Variation in the δ quantity with mole fraction of acetonitrile.
Figure 4-26. Variation in the δ quantity with mole fraction of methanol.
Similarly, the delta values as a function of any volume composition up to 60
v/v% acetonitrile [i.e., is equivalent to 0.6 volume fraction (φ)] and methanol
can be determined using equations (4-22a) and (4-22b). [74]
(4-22a)
(4-22b)
Note, however, that the difference between
s
w
pH and
s
s
pH is a constant value
for each mobile-phase composition, and the difference between
s
w
pH and
s
s
pH
depends not only on the type and concentration of mobile-phase composition,
but also on the particular solution being measured [74–76]. However, these
values can serve as estimates for converting from
s
w
pH to
s
s
pH or
s
w
pK
a
to
s
s
pK
a
.
The authors claim that the δ values could be directly used with other elec-
trode systems or by other laboratories, given that the residual liquid junction
potential of the respective system is negligible [74–76]. This can be a conve-
nient way to convert from the
s
w
pH scale to
s
s
pH scale as Espinosa et al. have
described [73].
4.5.6.2 Effect of Organic on Modifier Ionization–pH Shift. Typically, most
reversed-phase HPLC methods use monoprotic or polyprotic acidic buffers.
The determination of pK values of acids in acetonitrile/water mixtures and
methanol/water mixtures have been reviewed in the literature [61–65, 67, 77]
Several excellent reviews have been published on this topic by Roses and
Bosch. [74, 75] The
s
s
pH can be determined directly from
s
w
pH by the following
relationship as shown in equation (4-19).
For example, seven aqueous solutions of 10mM dipotassium monohydro-
gen phosphate (adjusted with phosphoric acid) with initial
w
w
pH (pH 2–9) were
prepared in five acetonitrile/water compositions ranging from 10 to 50 v/v%
of acetonitrile, and the
s
w
pH was determined.
s
s
pH was calculated using equa-
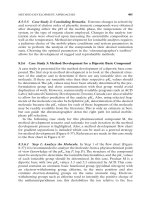
tion (4-19), and the final values are shown in Table 4-6. In Figure 4-27 the
s
s
pH
values were plotted versus the acetonitrile concentration ranging from 10 to
50 v/v%. It was shown that the
s
s
pH of the eluent increases with an increase of
acetonitrile content. For the buffers that had initial
w
w
pH values between 2 and
9, the slopes of the plots of
s
s
pH versus v/v% acetonitrile concentration are
essentially independent of the initial aqueous pH with R
2
> 0.98. There is an
increase (or upward shift of the pH) of approximately 0.22 pH units for every
10 v/v% of acetonitrile added, indicating a change in the acidic modifier’s dis-
sociation constant (change in the modifier’s pK
a
).
The change in the mobile-phase pH of a particular buffer as a function of
the organic compositions will be referred to as the pH shift in the following
sections in this book. For acidic buffers/modifiers, the relative increase in the
pH will be dependent upon the type and concentration of acidic modifier and
δ=
−
−+ −
009 011
1 3 15 3 51 1 35
2
23
..
...
ff
ff f
MeOH MeOH
MeOH MeOH MeOH
δ
φ
φφ
=
−
−+
0 446
1 1 316 0 433
2
2
.
..
MeCN
MeCN MeCN
174 REVERSED-PHASE HPLC
organic eluent. However, several other typically used acidic buffers such as
acetate, dihydrogen phosphate, dihydrogen citrate, hydrogen citrate, and
citrate and boric acid show a similar pH shift with an increase of acetonitrile
organic modifier. These acids bear a similar trend in increase of the
s
s
pH with
increasing amounts of v/v% acetonitrile. The
s
s
pH values determined by
Espinosa et al. and Subirats et al. in the acetonitrile concentration range from
10 to 60 v/v% are shown in Table 4-7 and correspond to approximately 0.2–0.3
pH units increase per 10 v/v% acetonitrile [64, 78].A conservative value of 0.2
pH units per 10 v/v% increase in acetonitrile will be used throughout the text
to denote the acidic modifier pH shift of the aqueous portion of the mobile
phase with the addition of acetonitrile.
The variation of the pK
a
of acidic modifiers with the addition of methanol
to the aqueous portion of the mobile phase bears a similar upward trend.
pH EFFECT ON HPLC SEPARATIONS 175
TABLE 4-6.
s
s
pH Values of 10 mM Monohydrogen Phosphate Buffer Adjusted with
Phosphoric Acid in Various MeCN Compositions
v/v% MeCN
s
s
pH
a
0 2.09 3.11 4 5.12 6.11 7.01 8.9
10 2.3 3.28 4.34 5.47 6.48 7.24 9.06
20 2.48 3.46 4.56 5.69 6.69 7.46 9.26
30 2.65 3.64 4.74 5.87 6.87 7.64 9.48
40 2.96 3.91 4.92 6.12 7.12 7.89 9.75
50 3.24 4.18 5.32 6.34 7.33 8.14
Slope 0.023 0.021 0.024 0.024 0.023 0.022 0.021
R
2
0.986 0.988 0.982 0.991 0.988 0.998 0.991
a
Corrected for delta at each organic composition using δ
avg
values from reference 73.
Figure 4-27. Effect of concentration of acetonitrile on the pH shift for a 10mM mono-
hydrogen phosphate buffer.
However, the variation in the positive slope for
s
s
pK
a
values in methanol/water
mixtures is smaller than for acetonitrile/water mixtures because methanol is
more similar to water. The typical increase in
s
s
pH values of acidic modifiers
in methanol/water mixtures is about 0.15 pH units per 10 v/v% methanol.
4.5.6.3 Acidic Modifiers: pH Shift and Correlation with Dielectric Con-
stant. The
s
s
pK variation of acids is related to changes in the electrostatic inter-
actions upon addition of organic media. pH is the negative log of the
concentration of protons that are the result of the acid dissociation (for acidic
buffers).With the increase of the content of organic molecules in the solution,
the dissociation is decreasing (with the decrease of dielectric constant the sta-
bilization of dissociated ions is decreased), thus increasing the solution pH.As
was discussed by Espinosa et al. [79], the pH shift occurs because an increase
in organic leads to a change of the dielectric constant of the hydro-organic
solution.As the organic content increases, the dielectric constant of the mobile
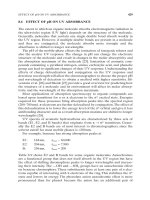
phase decreases. In our studies with a decrease in the dielectric constant of
the eluent composition (increasing acetonitrile composition) the
s
s
pK
a
of the
dipotassium monohydrogen buffer was observed to increase in a linear fashion
at all pHs (Figure 4-28). As the organic content increases, the dielectric con-
176 REVERSED-PHASE HPLC
TABLE 4-7.
s
s
pH Values of the Acids Studied as Buffer Components in
Acetonitrile/Water Mixtures
a
Slope
per 10
s
s
pH in % acetonitrile by volume
v/v%
10mM Buffer
b
0 10 20 30 40 50 60 MeCN R
2
Acetic/acetate 4.74 4.94 5.17 5.44 5.76 6.15 6.62 0.31 0.978
Phosphoric/ 2.21 2.39 2.62 2.8 3.11 3.42 3.75 0.26 0.986
dihydrogen
phosphate
Dihydrogen 7.23 7.4 7.6 7.82 8.08 8.38 8.73 0.25 0.985
phosphate/
hydrogen
phosphate
Citric/dihydrogen 3.16 3.31 3.49 3.68 3.9 4.16 4.45 0.21 0.987
citrate
Dihydrogen 4.79 4.95 5.14 5.35 5.6 5.91 6.28 0.24 0.979
citrate/
hydrogen
citrate
Hydrogen 6.42 6.62 6.85 7.11 7.4 7.74 8.13 0.28 0.987
citrate/citrate
a
Values in the table are from references 64 and 78.
b
Adjusted pH with either concentrated HCl or NaOH.
stant of the mobile phases decreases. The dielectric constant is expected to
influence the position of the equilibrium in ionic secondary chemical equilib-
ria of acidic compounds [80–83]. The solvent has the ability to disperse elec-
trostatic charges via ion–dipole interactions, which is inversely proportional to
the dielectric constant of the solvent composition.The lower the dielectric con-
stant, the lower the ionization constant of the acid, K
a
, and consequently
greater pK
a
values are obtained.
4.5.6.4 Basic Modifiers: pH Shift. Basic mobile-phase modifiers such as
NH
4
+
/NH
3
(
w
w
pH 9) and BuNH
3
+
/BuNH
2
(
w
w
pH 10) show a decrease in their pK
a
values with increasing organic content [74]. These basic modifiers have an
average pH decrease on the order of −0.05 to −0.1 pH units per 10 v/v% ace-
tonitrile. The minimum of the
s
s
pH values as a function of acetonitrile compo-
sition for basic modifiers is reached at approximately 30–50 v/v% MeCN.
Upon further increase in MeCN concentration the
s
s
pH of the basic modifier
will increase. For example, ammonium/ammonia basic modifier
s
s
pH values in
acetonitrile/water mixtures are: 0% MeCN: 9.29, 10% MeCN: 9.27, 20%
MeCN: 9.21, 30% MeCN: 9.17, 40% MeCN: 9.19, 50% MeCN: 9.21, 60%
MeCN: 9.34 [64]. For BuNH
3
+
/BuNH
2
(
w
w
pH 10), basic modifier
s
s
pH values in
acetonitrile/water mixtures are: 0% MeCN: 10.00, 20% MeCN: 9.78, 40%
MeCN: 9.63, 60% MeCN: 9.79 [64]. For basic modifiers a decrease in pH is also
observed with increase of methanol content on the order of 0.1 pH units per
10 v/v% methanol.
4.5.6.5 Amphoteric Buffers: pH Shift. When buffers that contain both ioni-
zable cations and anions such as ammonium acetate or ammonium phosphate
are used, the change in the buffer pH (pH shift) is dependent on the pH of
the starting buffer. For example, with an ammonium acetate buffer with the
pH EFFECT ON HPLC SEPARATIONS 177
Figure 4-28. Influence of the dielectric constant on the
s
s
pK
a
of acidic buffer from pH
2 to 9.
addition of organic modifier, there is an upward pH shift up to
w
w
pH 6 (due to
acetate counterion) and a downward pH shift when
w
w
pH > 7 (due to ammo-
nium counterion). These effects are prevalent in both acetonitrile/water and
methanol/water systems, as shown in Tables 4-8 and 4-9, respectively. The
changes in pH slopes are (a) approximately constant and positive for
w
w
pH <
178 REVERSED-PHASE HPLC
TABLE 4-8. Calculated
s
s
pH Values of 50 mM Ammonium Acetate at Different
Acetonitrile/Water Compositions
a
Slope per
s
s
pH in% MeCN by volume
10v/v%
Buffer 0 10 20 30 40 50 60 MeCN R
2
50mM Acetic acid 4.67 4.86 5.08 5.34 5.68 6.04 6.46 0.30 0.981
50mM Amm. acetate 2.67 2.8 2.98 3.16 3.5 3.84 4.23 0.26 0.964
50mM Amm. acetate 3.01 3.15 3.33 3.54 3.86 4.19 4.6 0.26 0.968
50mM Amm. acetate 4.06 4.21 4.43 4.66 5.01 5.33 5.75 0.28 0.977
50mM Amm. acetate 5.07 5.23 5.49 5.74 6.11 6.43 6.88 0.30 0.981
50mM Amm. acetate 6.07 6.24 6.48 6.71 7.05 7.33 7.69 0.27 0.988
50mM Amm. acetate 6.96 7.06 7.16 7.29 7.5 7.67 7.94 0.16 0.969
50mM Amm. acetate 7.94 7.9 7.85 7.81 7.9 7.97 8.15 −0.04
a
0.998
b
50mM Amm. acetate 8.94 8.88 8.84 8.76 8.8 8.8 8.87 −0.06
a
0.984
b
50mM Amm. acetate 9.95 9.88 9.85 9.76 9.8 9.8 9.88 −0.06
a
0.968
b
a
All
s
w
pH data were obtained from reference [84], and
s
s
pH values were calculated using δ values
from reference 73. The pHs were adjusted with formic acid and ammonium hydroxide.
b
The slope and R
2
were determined from 0–30v/v% acetonitrile.
TABLE 4-9. Calculated
s
s
pH Values of 50 mM Ammonium Acetate at Different
Methanol/Water Compositions
Slope per
s
s
pH in% MeOH by Volume
10v/v%
Buffer 0 10 20 30 40 50 60 MeOH R
2
10mM Acetic acid 4.76 4.96 5.15 5.36 5.57 5.8 6.03 0.21 0.999
50mM Amm. acetate 2.67 2.8 2.94 3.06 3.22 3.37 3.55 0.15 0.997
50mM Amm. acetate 3.01 3.15 3.24 3.36 3.5 3.65 3.86 0.14 0.986
50mM Amm. acetate 4.06 4.17 4.26 4.38 4.52 4.71 4.92 0.14 0.976
50mM Amm. acetate 5.07 5.16 5.28 5.42 5.6 5.8 6.03 0.16 0.977
50mM Amm. acetate 6.07 6.15 6.26 6.4 6.57 6.75 6.93 0.15 0.983
50mM Amm. acetate 6.96 7.0 7.05 7.05 7.11 7.16 7.25 0.04 0.950
50mM Amm. acetate 7.94 7.9 7.8 7.69 7.63 7.56 7.53 −0.07 0.979
50mM Amm. acetate 8.94 8.89 8.79 8.66 8.56 8.44 8.34 −0.10 0.992
50mM Amm. acetate 9.95 9.92 9.79 9.68 9.59 9.47 9.35 −0.10 0.989
a
All
s
w
pH data were obtained from reference 84,
and
s
s
pH values were calculated using δ values
from Table 4-5. The pHs were adjusted with formic acid and ammonium hydroxide.
6 where the solution is buffered by the acetic/acetate pair in the solution and
(b) constant and negative for
w
w
pH > 7 where the solution is buffered by the
ammonium/ammonia pair.
Also, the organic content is expected to influence the dissociation constant
of acidic analytes, resulting in an increase in the acidic analyte pK
a
and this
could be described as the acidic analyte pK
a
shift, which is discussed in Section
4.6. On the other hand, the organic eluent will affect the dissociation of basic
analytes in the opposite direction, resulting in a decrease in the basic analyte
pK
a
, and is discussed in the Section 4.6 as the basic analyte pK
a
shift.
4.5.7 Analyte Dissociation Constants
The pK
a
is an important physicochemical parameter. The analyte pK
a
values
are especially important in regard to pharmacokinetics (ADME—absorption,
distribution, metabolism, excretion) of xenobiotics since the pK
a
affects the
apparent drug lipophilicity [59]. Potentiometric titrations and spectrophome-
tric analysis can be used for pK
a
determination; however, if the compound is
not pure, is poorly soluble in water, and/or does not have a significant UV
chromophore and is in limited quantity, its determination may prove to be
challenging.
Dissociation constants of ionizable components can be determined using
various methods such as potentiometric titrations [85] CE, NMR, [86] and UV
spectrophotometric methods [87]. Potentiometric methods have been used in
aqueous and hydro-organic systems; however, these methods usually require
a large quantity of pure compound and solubility could be a problem. Poten-
tiometric methods are not selective because if the ionizable impurities in an
impure sample of the analyte have a pK
a
similar to that of the analyte, this
could interfere with determining the titration endpoint. If the titration end-
point is confounded, then these may lead to erroneous values for the target
analyte pK
a
.
Liquid chromatography has also been widely used for the determination of
dissociation constants [88–92] since it only requires small quantity of com-
pounds, compounds do not need to be pure, and solubility is not a serious
concern. However, the effect of an organic eluent modifier on the analyte ioni-
zation needs to also be considered. It has been shown that increase of the
organic content in hydro-organic mixture leads to suppression of the basic
analyte pK
a
and leads to an increase in the acidic analyte pK
a
compared to
their potentiometric pK
a
values determined in pure water [74].
Knowledge of pK
a
for the target analyte and related impurities is particu-
larly useful for commencement of method development of HPLC methods for
key raw materials, reaction monitoring, and active pharmaceutical ingredients.
This practice leads to faster method development, rugged methods, and an
accurate description of the analyte retention as a function of pH at varying
organic compositions. Relationship of the analyte retention as function of
mobile-phase pH (
s
s
pH) is very useful to determine the pK
a
of the particular
pH EFFECT ON HPLC SEPARATIONS 179
analyte in the hydroorganic mixture and can be extrapolated to predict the
w
w
pK
a
of the analyte. Reversed-phase HPLC in isocratic mode can be used for
the pK
a
determination of new drug compounds.
4.5.8 Determination of Chromatographic pK
a
The general procedure for the chromatographic determination of the pK
a
is
to run at least 5 pH experiments isocratically to construct a pH (on the x-axis)
versus retention factor (or retention, on the y-axis) plot. The concentration of
organic in the mobile phase should be selected to elute the most hydrophilic
species (ionized form) with a k′>1. If the compound is acidic, the elution of
the fully ionized species will be obtained at 2 pH units greater than the analyte
pK
a
. If the compound is basic, the elution of the fully ionized species will be
obtained at 2 pH units less than the analyte pK
a
. The organic composition
chosen must also be able to elute the neutral species within a reasonable reten-
tion time (i.e., <30min). A short column with narrow internal diameter (i.e.,
5.0 × 3.0mm, using flow rate of 1.5mL/min) that is stable from
w
w
pH 2–11 should
be used for these studies.The mobile phase could be made from 15mM potas-
sium phosphate, and the pH can be adjusted with either HCl or NaOH from
2 to 11.
If the target analyte is a basic compound, then the lowest pH mobile phase
could be run first, to obtain the retention of the ionized species. At least 25
column volumes (1 column volume =π×radius of column
2
× length of column
× 0.7) should pass through the column in order to obtain stable retention at
each pH used. There is no need to run blank injections. Multiple injections of
the analyte should be made; and once a stable retention is obtained at a par-
ticular pH, the next pH can be evaluated. This is repeated throughout the
whole pH range from low pH to high pH. A representative chromatogram
overlay at the various pH values is shown in Figure 4-29 for a basic compound
(compound M). The retention factor (or retention) is then plotted versus the
s
s
pH of the mobile phase. A representative plot of the retention dependencies
versus the
s
s
pH of the mobile phase at 30 v/v% acetonitrile compositions is
shown in Figure 4-30. Using nonlinear regression analysis software, the
s
s
pK
a
of the analyte can be determined. For the example given in Figure 4-29 the
s
s
pK
a
of compound M at 30 v/v% acetonitrile was determined to be 3.9 (Figure
4-30). Knowing the
s
s
pK
a
of the analyte and the type and concentration of
organic modifier used, the
w
w
pK
a
of the analyte can be calculated. For acetoni-
trile/water systems the
w
w
pK
a
can be calculated by the following empirical
formula for basic and acidic compounds:
(4-23)
(4-24)
where B = 0.02 (corresponds to basic analyte pK
a
shift per 10 v/v% MeCN)
and A = 0.03 (corresponds to acidic analyte pK
a
shift per 10 v/v% MeCN).
w
w
s
s
p
p % organic *A acidic compoundsKKx
aa
=−
()( )
w
w
s
s
p p %organic *B basic compoundsKKx
aa
=+
()( )
180 REVERSED-PHASE HPLC
EFFECT OF ORGANIC ELUENT COMPOSITION 181
Figure 4-29. Column:Acquity BEH C18 1.7µm, 2.1∗50 mm, flow rate, 0.8mL/min, tem-
perature, 35°C, injection 2-µL full loop, run time 3–5min, detection 215nm. Strong
wash: 0.1% NH
4
OH 50/50 MeCN/H
2
O. Weak wash: 90/10 H
2
O/MeCN. Mobile phase
A: 15mM K
2
HPO
4
adjusted with HCl. Mobile phase B: MeCN. Starting pressure: ∼9000
psi, isocratic 30 v/v% MeCN.
Figure 4-30. Retention versus
s
s
pH for compound M at 30 v/v% acetonitrile
.
The basic and acidic analyte pK
a
shift values will be discussed in Section 4.6.
Using equation (4-23), the
w
w
pK
a
at 30 v/v% acetonitrile was estimated to
be 4.5.
w
w
pK
a
= 3.9 + (30 v/v% MeCN)*0.02 = 4.5. Similar pH studies were con-
ducted with 40 and 50 v/v% MeCN compositions, and the respective
s
s
pK
a
(experimental) and
w
w
pK
a
(predicted) values are shown in Table 4-10. These
results agree well with the potentiometric value of 4.4 for this compound M.
4.6 EFFECT OF ORGANIC ELUENT COMPOSITION ON
ANALYTE IONIZATION
As discussed in Section 4.5.6, the increase of the organic content in hydro-
organic mixture leads to suppression of the basic analyte pK
a
and to an
increase in the acidic analyte pK
a
. Accounting for the pH shift of the mobile
phase and analyte pK
a
shift upon the addition of organic modifier is necessary
for the chromatographer to analyze the ionogenic samples at their optimal pH
values.
In order to avoid any secondary equilibrium effects on the retention of
ionogenic analytes, it is preferable to use the mobile-phase pH either two units
greater or less than the analyte pK
a
in the particular hydro-organic media that
is employed.Therefore, one must account for the pH shift of the mobile phase
upon the addition of the organic modifier for a proper description of the iono-
genic analyte retention process. However, the effect of organic eluent modi-
fier on the analyte ionization needs to also be considered. It has been shown
that increase of the organic content in hydro-organic mixture leads to sup-
pression of the basic analyte pK
a
and an increase in the acidic analyte pK
a
compared to their potentiometric pK
a
values determined in pure water [74,
79]. Accounting for the pH shift of modifier in the mobile phase and analyte
pK
a
shift upon the addition of organic modifier, this will allow the chro-
matographer to analyze the ionogenic samples at their optimal pH values.
4.6.1 Effect of Organic Modifier on Basic Analyte pK
a
Shift
In order for proper description of the basic analyte retention versus the mobile-
phase
s
s
pH, the pH shift of the aqueous portion of the mobile phase must be
182 REVERSED-PHASE HPLC
TABLE 4-10. pK Values for Compound M at Various
Organic Compositions
pK
a
pK
a
30v/v% 40v/v% 50v/v%
s
s
pK
a
3.9 3.65 3.5
Estimated
w
w
pK
a
4.5 4.45 4.5
taken into account.Figure 4-31 is a plot of the retention factor of aniline plotted
versus two different pH scales:
w
w
pH (Figure 4-31, line A) and
s
s
pH (Figure 4-31,
line B). Moreover, a theoretical curve of the retention dependence versus pH
of the mobile phase was constructed for aniline, based on its potentiometric
pK
a
of 4.6 in a purely aqueous system (Figure 4-31, line C).The inflection point
of the dependence of k′ versus pH corresponds to the analyte pK
a
at a partic-
ular hydro-organic composition. As can be seen, the plot of retention factor
versus.
w
w
pH (Figure 4-31, line A) does not correspond to pK
a
from the theo-
retical curve (Figure 4-31, line C).The pK
a
difference between these two curves
is actually the combination of two individual shifts occurring in opposing direc-
tions: acidic mobile-phase upward pH shift and the basic analyte downward
pK
a
shift.The difference between the
w
w
pH and
s
s
pH curve is due to the pH shift
of the aqueous portion of the acidic mobile phase which is caused by a change
in the dissociation in the acidic buffer in the particular hydro-organic eluent.
After the retention factor is plotted versus
s
s
pH (Figure 4-31, line B), the pK
a
determined still does not correspond to the pK
a
from the theoretical curve
(Figure 4-31, line C). The difference between the
s
s
pH curve and the theoreti-
cal curve could be attributed to a change of the basic analyte ionization state
at a particular hydro-organic composition upon addition of acetonitrile in the
mobile phase, and this is denoted as the basic analyte pK
a
shift.
Figure 4-32 is a plot of the retention factor of aniline versus the
s
s
pH of the
hydro-organic mixture (pH shift of the aqueous portion of the mobile phase
is accounted for) from 10 to 50 v/v% MeCN using the values from Table 4-11.
In the graph for all organic compositions a sigmoidal dependence of retention
factor versus
s
s
pH is obtained and the plateau regions are the limiting factors
for the fully ionized and neutral forms of the analyte. The inflection point of
REFECT OF ORGANIC ELUENT COMPOSITION 183
Figure 4-31. Retention versus
w
w
pH and
s
s
pH for aniline at 50 v/v% MeCN. (15mM
phosphate buffer adjusted with phosphoric acid.) See color plate.
the dependence of k versus
s
s
pH corresponds to the analyte
s
s
pK
a
at a particu-
lar hydro-organic composition.
In Figure 4-33 the analyte
w
w
pK
a
and
s
s
pK
a
is plotted versus 0–50 v/v% MeCN.
It is shown that even after correcting for the pH shift of the mobile phase upon
addition of organic at each organic composition, the chromatographic
s
s
pK
a
at
184 REVERSED-PHASE HPLC
Figure 4-32. Retention versus
s
s
pH for aniline from 10 to 50 v/v% MeCN.
TABLE 4-11. Retention Volume of Aniline as a Function of
s
s
pH (10–50 v/v%
Acetonitrile)
s
s
pH 50
s
s
pH 40
s
s
pH 30
s
s
pH 20
s
s
pH 10
2.62 1.225 2.36 1.294 2.08 1.406 1.89 1.587 1.69 2.002
3.12 1.419 2.86 1.393 2.58 1.461 2.39 1.624 2.19 2.043
3.62 1.701 3.36 1.658 3.08 1.645 2.89 1.987 2.69 2.069
4.12 2.193 3.86 2.21 3.58 2.145 3.39 2.182 3.19 2.549
5.12 2.848 4.86 3.42 4.58 4.11 4.39 4.885 4.19 6.172
6.12 2.961 5.86 3.749 5.58 5.081 5.39 7.572 5.19 13.04
7.12 2.954 6.86 3.76 6.58 5.136 6.39 7.925 6.19 14.64
10.12 2.961 9.86 3.774 9.58 5.18 9.39 8.043 9.19 15.115