Tài liệu Memory Dump Analysis Anthology- P13 doc
Bạn đang xem bản rút gọn của tài liệu. Xem và tải ngay bản đầy đủ của tài liệu tại đây (852.91 KB, 30 trang )
Memory Leak (Process Heap) 361
76a4bc31 USER32!DrawTextExWorker+0x000001b1
76a4bedc USER32!DrawTextExW+0x0000001e
746051d8 uxtheme!CTextDraw::GetTextExtent+0x000000be
7460515a uxtheme!GetThemeTextExtent+0x00000065
74611ed4 uxtheme!CThemeMenuBar::MeasureItem+0x00000124
746119c1 uxtheme!CThemeMenu::OnMeasureItem+0x0000003f
74611978 uxtheme!CThemeWnd::_PreDefWindowProc+0x00000117
74601ea5 uxtheme!_ThemeDefWindowProc+0x00000090
74601f61 uxtheme!ThemeDefWindowProcW+0x00000018
76a4a09e USER32!DefWindowProcW+0x00000068
931406 notepad!NPWndProc+0x00000084
76a51a10 USER32!InternalCallWinProc+0x00000023
76a51ae8 USER32!UserCallWinProcCheckWow+0x0000014b
76a51c03 USER32!DispatchClientMessage+0x000000da
76a3bc24 USER32!__fnINOUTLPUAHMEASUREMENUITEM+0x00000027
77040e6e ntdll!KiUserCallbackDispatcher+0x0000002e
76a51d87 USER32!RealDefWindowProcW+0x00000047
74601f2f uxtheme!_ThemeDefWindowProc+0x000001b8
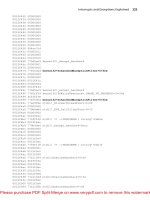
If we want to dump all heap entries with their corresponding stack traces we can
use !heap -k -h <heap address> command.
Note: sometimes all these commands don’t work. In such cases we can use old
Windows 2000 extension (page 182).
Some prefer to use umdh.exe and get text file logs but the advantage of embed-
ding heap allocation stack traces in a crash dump is that we are not concerned with
sending and configuring symbol files at a customer site.
When analyzing heap various pageheap options !heap -p are useful such as
(taken from WinDbg help):
-t[c|s] [Traces]
“Causes the debugger to display the collected traces of the heavy heap users.
Traces specifies the number of traces to display; the default is four. If there are more
traces than the specified number, the earliest traces are displayed. If -t or -tc is used, the
traces are sorted by count usage. If -ts is used, the traces are sorted by size.”
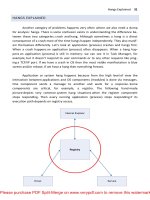
We can also use Microsoft Debug Diagnostics tool:
Please purchase PDF Split-Merge on www.verypdf.com to remove this watermark.
362 PART 3: Crash Dump Analysis Patterns
MISSING THREAD
Sometimes it is possible that a process crash dump doesn’t have all usual threads
inside. For example, we expect at least 4 threads including the main process thread but
in the dump we see only 3. If we know that some access violations were reported in the
event log before (not necessarily for the same PID) we might suspect that one of threads
had been terminated due to some reason. I call this pattern Missing Thread.
In order to simulate this problem I created a small multithreaded program in Vis-
ual C++:
#include "stdafx.h"
#include <process.h>
void thread_request(void *param)
{
while (true);
}
int _tmain(int argc, _TCHAR* argv[])
{
_beginthread(thread_request, 0, NULL);
try
{
if (argc == 2)
{
*(int *)NULL = 0;
}
}
catch (...)
{
_endthread();
}
while (true);
return 0;
}
If there is a command line argument then the main thread simulates access viola-
tion and finishes in the exception handler. In order to use SEH exceptions with C++
try/catch blocks you have to enable /EHa option in C++ Code Generation properties:
Please purchase PDF Split-Merge on www.verypdf.com to remove this watermark.
Missing Thread 363
If we run the program without command line parameter and take a manual
dump from it we would see 2 threads:
0:000> ~*kL
. 0 Id: 1208.fdc Suspend: 1 Teb: 7efdd000 Unfrozen
ChildEBP RetAddr
0012ff70 00401403 MissingThread!wmain+0x58
0012ffc0 7d4e7d2a MissingThread!__tmainCRTStartup+0x15e
0012fff0 00000000 kernel32!BaseProcessStart+0x28
1 Id: 1208.102c Suspend: 1 Teb: 7efda000 Unfrozen
ChildEBP RetAddr
005dff7c 004010ef MissingThread!thread_request
005dffb4 00401188 MissingThread!_callthreadstart+0x1b
005dffb8 7d4dfe21 MissingThread!_threadstart+0x73
005dffec 00000000 kernel32!BaseThreadStart+0x34
0:000> ~
. 0 Id: 1208.fdc Suspend: 1 Teb: 7efdd000 Unfrozen
1 Id: 1208.102c Suspend: 1 Teb: 7efda000 Unfrozen
0:000> dd 7efdd000 l4
7efdd000 0012ff64 00130000 0012e000 00000000
I also dumped TEB of the main thread. However if we run the program with any
command line parameter and look at its manual dump we would see only one thread
with the main thread missing:
Please purchase PDF Split-Merge on www.verypdf.com to remove this watermark.
364 PART 3: Crash Dump Analysis Patterns
0:000> ~*kL
. 0 Id: 1004.12e8 Suspend: 1 Teb: 7efda000 Unfrozen
ChildEBP RetAddr
005dff7c 004010ef MissingThread!thread_request
005dffb4 00401188 MissingThread!_callthreadstart+0x1b
005dffb8 7d4dfe21 MissingThread!_threadstart+0x73
005dffec 00000000 kernel32!BaseThreadStart+0x34
0:000> ~
. 0 Id: 1004.12e8 Suspend: 1 Teb: 7efda000 Unfrozen
If we try to dump TEB address and stack data from the missing main thread we
would see that the memory was already decommitted:
0:000> dd 7efdd000 l4
7efdd000 ???????? ???????? ???????? ????????
0:000> dds 0012e000 00130000
0012e000 ????????
0012e004 ????????
0012e008 ????????
0012e00c ????????
0012e010 ????????
0012e014 ????????
0012e018 ????????
0012e01c ????????
0012e020 ????????
0012e024 ????????
The same effect can be achieved in the similar program that exits the thread in
the custom unhandled exception filter:
#include "stdafx.h"
#include <process.h>
#include <windows.h>
LONG WINAPI CustomUnhandledExceptionFilter(struct _EXCEPTION_POINTERS*
ExceptionInfo)
{
ExitThread(-1);
}
void thread_request(void *param)
{
while (true);
}
Please purchase PDF Split-Merge on www.verypdf.com to remove this watermark.
Missing Thread 365
int _tmain(int argc, _TCHAR* argv[])
{
_beginthread(thread_request, 0, NULL);
SetUnhandledExceptionFilter(CustomUnhandledExceptionFilter);
*(int *)NULL = 0;
while (true);
return 0;
}
The solution to catch an exception that results in a thread termination would be
to run the program under WinDbg or any other debugger:
CommandLine: C:\MissingThread\MissingThread.exe 1
Symbol search path is:
SRV*c:\websymbols*
Executable search path is:
ModLoad: 00400000 0040f000 MissingThread.exe
ModLoad: 7d4c0000 7d5f0000 NOT_AN_IMAGE
ModLoad: 7d600000 7d6f0000 C:\W2K3\SysWOW64\ntdll32.dll
ModLoad: 7d4c0000 7d5f0000 C:\W2K3\syswow64\kernel32.dll
(df0.12f0): Break instruction exception - code 80000003 (first chance)
eax=7d600000 ebx=7efde000 ecx=00000005 edx=00000020 esi=7d6a01f4
edi=00221f38
eip=7d61002d esp=0012fb4c ebp=0012fcac iopl=0 nv up ei pl nz na po nc
cs=0023 ss=002b ds=002b es=002b fs=0053 gs=002b efl=00000202
ntdll32!DbgBreakPoint:
7d61002d cc int 3
0:000> g
ModLoad: 71c20000 71c32000 C:\W2K3\SysWOW64\tsappcmp.dll
ModLoad: 77ba0000 77bfa000 C:\W2K3\syswow64\msvcrt.dll
ModLoad: 00410000 004ab000 C:\W2K3\syswow64\ADVAPI32.dll
ModLoad: 7da20000 7db00000 C:\W2K3\syswow64\RPCRT4.dll
ModLoad: 7d8d0000 7d920000 C:\W2K3\syswow64\Secur32.dll
(df0.12f0): Access violation - code c0000005 (first chance)
First chance exceptions are reported before any exception handling.
This exception may be expected and handled.
eax=000007a0 ebx=7d4d8df9 ecx=78b842d9 edx=00000000 esi=00000002
edi=00000ece
eip=00401057 esp=0012ff50 ebp=0012ff70 iopl=0 nv up ei pl zr na pe nc
cs=0023 ss=002b ds=002b es=002b fs=0053 gs=002b efl=00010246
MissingThread!wmain+0x47:
00401057 c7050000000000000000 mov dword ptr
ds:[0],0 ds:002b:00000000=????????
Please purchase PDF Split-Merge on www.verypdf.com to remove this watermark.
366 PART 3: Crash Dump Analysis Patterns
0:000> kL
ChildEBP RetAddr
0012ff70 00401403 MissingThread!wmain+0x47
0012ffc0 7d4e7d2a MissingThread!__tmainCRTStartup+0x15e
0012fff0 00000000 kernel32!BaseProcessStart+0x28
If live debugging is not possible and we are interested in crash dumps saved
upon a first chance exception before it is processed in an exception handler we can also
use MS userdump tool after we install it and enable All Exceptions in the Process
Monitoring Rules dialog box. Another tool can be used is ADPlus in crash mode from
Debugging Tools for Windows.
Please purchase PDF Split-Merge on www.verypdf.com to remove this watermark.
Unknown Component 367
UNKNOWN COMPONENT
Sometimes we suspect that a problem was caused by some module but WinDbg
lmv command doesn’t show the company name and other verbose information for it
and Google search has no results for the file name. I call this pattern Unknown Compo-
nent.
In such cases additional information can be obtained by dumping the module re-
source section or the whole module address range and looking for ASCII and UNICODE
strings. For example (byte values in db output are omitted for clarity):
2: kd> lmv m driver
start end module name
f5022000 f503e400 driver (deferred)
Image path: \SystemRoot\System32\drivers\driver.sys
Image name: driver.sys
Timestamp: Tue Jun 12 11:33:16 2007 (466E766C)
CheckSum: 00021A2C
ImageSize: 0001C400
Translations: 0000.04b0 0000.04e0 0409.04b0 0409.04e0
2: kd> db f5022000 f503e400
f5022000 MZ..............
f5022010 ........@.......
f5022020 ................
f5022030 ................
f5022040 ........!..L.!Th
f5022050 is program canno
f5022060 t be run in DOS
f5022070 mode....$.......
f5022080 .g,._.B._.B._.B.
f5022090 _.C.=.B..%Q.X.B.
f50220a0 _.B.].B.Y%H.|.B.
f50220b0 ..D.^.B.Rich_.B.
f50220c0 ........PE..L...
f50220d0 lvnF............
...
...
...
f503ce30 ................
f503ce40 ................
f503ce50 ................
f503ce60 ............0...
f503ce70 ................
f503ce80 ....H...........
f503ce90 ..........4...V.
f503cea0 S._.V.E.R.S.I.O.
f503ceb0 N._.I.N.F.O.....
f503cec0 ................
Please purchase PDF Split-Merge on www.verypdf.com to remove this watermark.
368 PART 3: Crash Dump Analysis Patterns
f503ced0 ........?.......
f503cee0 ................
f503cef0 ....P.....S.t.r.
f503cf00 i.n.g.F.i.l.e.I.
f503cf10 n.f.o...,.....0.
f503cf20 4.0.9.0.4.b.0...
f503cf30 4.....C.o.m.p.a.
f503cf40 n.y.N.a.m.e.....
f503cf50 M.y.C.o.m.p. .A.
f503cf60 G...p.$...F.i.l.
f503cf70 e.D.e.s.c.r.i.p.
f503cf80 t.i.o.n.....M.y.
f503cf90 .B.i.g. .P.r.o.
f503cfa0 d.u.c.t. .H.o.o.
f503cfb0 k...............
f503cfc0 ................
f503cfd0 ....4.....F.i.l.
f503cfe0 e.V.e.r.s.i.o.n.
f503cff0 ....5...1...0...
f503d000 ????????????????
f503d010 ????????????????
f503d020 ????????????????
f503d030 ????????????????
...
...
...
We see that CompanyName is MyComp AG, FileDescription is My Big Product
Hook and FileVersion is 5.0.1.
In our example the same information can be retrieved by dumping the image file
header and then finding and dumping the resource section:
2: kd> lmv m driver
start end module name
f5022000 f503e400 driver (deferred)
Image path: \SystemRoot\System32\drivers\driver.sys
Image name: driver.sys
Timestamp: Tue Jun 12 11:33:16 2007 (466E766C)
CheckSum: 00021A2C
ImageSize: 0001C400
Translations: 0000.04b0 0000.04e0 0409.04b0 0409.04e0
Please purchase PDF Split-Merge on www.verypdf.com to remove this watermark.
Unknown Component 369
2: kd> !dh f5022000 -f
File Type: EXECUTABLE IMAGE
FILE HEADER VALUES
14C machine (i386)
6 number of sections
466E766C time date stamp Tue Jun 12 11:33:16 2007
0 file pointer to symbol table
0 number of symbols
E0 size of optional header
10E characteristics
Executable
Line numbers stripped
Symbols stripped
32 bit word machine
OPTIONAL HEADER VALUES
10B magic #
6.00 linker version
190A0 size of code
30A0 size of initialized data
0 size of uninitialized data
1A340 address of entry point
2C0 base of code
----- new -----
00010000 image base
20 section alignment
20 file alignment
1 subsystem (Native)
4.00 operating system version
0.00 image version
4.00 subsystem version
1C400 size of image
2C0 size of headers
21A2C checksum
00100000 size of stack reserve
00001000 size of stack commit
00100000 size of heap reserve
00001000 size of heap commit
0 [ 0] address [size] of Export Directory
1A580 [ 50] address [size] of Import Directory
1AE40 [ 348] address [size] of Resource Directory
0 [ 0] address [size] of Exception Directory
0 [ 0] address [size] of Security Directory
1B1A0 [ 1084] address [size] of Base Relocation Directory
420 [ 1C] address [size] of Debug Directory
0 [ 0] address [size] of Description Directory
0 [ 0] address [size] of Special Directory
0 [ 0] address [size] of Thread Storage Directory
0 [ 0] address [size] of Load Configuration Directory
0 [ 0] address [size] of Bound Import Directory
2C0 [ 15C] address [size] of Import Address Table Directory
Please purchase PDF Split-Merge on www.verypdf.com to remove this watermark.
370 PART 3: Crash Dump Analysis Patterns
0 [ 0] address [size] of Delay Import Directory
0 [ 0] address [size] of COR20 Header Directory
0 [ 0] address [size] of Reserved Directory
2: kd> db f5022000+1AE40 f5022000+1AE40+348
f503ce40 ................
f503ce50 ................
f503ce60 ............0...
f503ce70 ................
f503ce80 ....H...........
f503ce90 ..........4...V.
f503cea0 S._.V.E.R.S.I.O.
f503ceb0 N._.I.N.F.O.....
f503cec0 ................
f503ced0 ........?.......
f503cee0 ................
f503cef0 ....P.....S.t.r.
f503cf00 i.n.g.F.i.l.e.I.
f503cf10 n.f.o...,.....0.
f503cf20 4.0.9.0.4.b.0...
f503cf30 4.....C.o.m.p.a.
f503cf40 n.y.N.a.m.e.....
f503cf50 M.y.C.o.m.p. .A.
f503cf60 G...p.$...F.i.l.
f503cf70 e.D.e.s.c.r.i.p.
f503cf80 t.i.o.n.....M.y.
f503cf90 .B.i.g. .P.r.o.
f503cfa0 d.u.c.t. .H.o.o.
f503cfb0 k...............
f503cfc0 ................
f503cfd0 ....4.....F.i.l.
f503cfe0 e.V.e.r.s.i.o.n.
f503cff0 ....5...1...0...
f503d000 ????????????????
f503d010 ????????????????
...
...
...
Please purchase PDF Split-Merge on www.verypdf.com to remove this watermark.
Memory Leak (.NET Heap) 371
MEMORY LEAK (.NET HEAP)
Sometimes the process size constantly grows but there is no difference in the
process heap size. In such cases we need to check whether the process uses Microsoft
.NET runtime (CLR). If one of the loaded modules is mscorwks.dll or mscorsvr.dll then it
is most likely. Then we should check CLR heap statistics.
In .NET world dynamically allocated objects are garbage collected (GC) and there-
fore simple allocate-and-forget memory leaks are not possible. To simulate that I
created the following C# program:
using System;
namespace CLRHeapLeak
{
class Leak
{
private byte[] m_data;
public Leak()
{
m_data = new byte[1024];
}
}
class Program
{
static void Main(string[] args)
{
Leak leak = new Leak();
while (true)
{
leak = new Leak();
System.Threading.Thread.Sleep(100);
}
}
}
}
Please purchase PDF Split-Merge on www.verypdf.com to remove this watermark.
372 PART 3: Crash Dump Analysis Patterns
If we run it the process size will never grow. GC thread will collect and free
unreferenced Leak classes. This can be seen from inspecting memory dumps taken with
userdump.exe after the start, 2, 6 and 12 minutes. The GC heap never grows higher than
1Mb and the number of CLRHeapLeak.Leak and System.Byte[] objects always fluctuates
between 100 and 500. For example, on 12th minute we have the following statistics:
0:000> .loadby sos mscorwks
0:000> !eeheap -gc
Number of GC Heaps: 1
generation 0 starts at 0x0147160c
generation 1 starts at 0x0147100c
generation 2 starts at 0x01471000
ephemeral segment allocation context: (0x014dc53c, 0x014dd618)
segment begin allocated size
004aedb8 790d7ae4 790f7064 0x0001f580(128384)
01470000 01471000 014dd618 0x0006c618(443928)
Large object heap starts at 0x02471000
segment begin allocated size
02470000 02471000 02473250 0x00002250(8784)
Total Size 0x8dde8(581096)
------------------------------
GC Heap Size 0×8dde8(581096)
0:000> !dumpheap -stat
total 2901 objects
Statistics:
Count TotalSize Class Name
1 12 System.Security.Permissions.SecurityPermission
1 24 System.OperatingSystem
1 24 System.Version
1 24 System.Reflection.Assembly
1 28 System.SharedStatics
1 36 System.Int64[]
1 40 System.AppDomainSetup
3 60 System.RuntimeType
5 60 System.Object
2 72 System.Security.PermissionSet
1 72 System.ExecutionEngineException
1 72 System.StackOverflowException
1 72 System.OutOfMemoryException
1 100 System.AppDomain
7 100 Free
2 144 System.Threading.ThreadAbortException
4 328 System.Char[]
418 5016 CLRHeapLeak.Leak
5 8816 System.Object[]
2026 128632 System.String
418 433048 System.Byte[]
Total 2901 objects
Please purchase PDF Split-Merge on www.verypdf.com to remove this watermark.