Tài liệu Ten Principles of Economics - Part 65 pptx
Bạn đang xem bản rút gọn của tài liệu. Xem và tải ngay bản đầy đủ của tài liệu tại đây (270.2 KB, 10 trang )
CHAPTER 29 OPEN-ECONOMY MACROECONOMICS: BASIC CONCEPTS 663
Mexican government has imposed, or might impose in the future, on foreign
investors in Mexico.
THE EQUALITY OF NET EXPORTS
AND NET FOREIGN INVESTMENT
We have seen that an open economy interacts with the rest of the world in two
ways—in world markets for goods and services and in world financial markets.
Net exports and net foreign investment each measure a type of imbalance in these
markets. Net exports measure an imbalance between a country’s exports and its
imports. Net foreign investment measures an imbalance between the amount of
foreign assets bought by domestic residents and the amount of domestic assets
bought by foreigners.
An important but subtle fact of accounting states that, for an economy as a
whole, these two imbalances must offset each other. That is, net foreign investment
(NFI) always equals net exports (NX):
NFI ϭ NX.
This equation holds because every transaction that affects one side of this equation
must also affect the other side by exactly the same amount. This equation is an
identity—an equation that must hold because of the way the variables in the equa-
tion are defined and measured.
To see why this accounting identity is true, consider an example. Suppose that
Boeing, the U.S. aircraft maker, sells some planes to a Japanese airline. In this sale,
a U.S. company gives planes to a Japanese company, and a Japanese company
gives yen to a U.S. company. Notice that two things have occurred simultaneously.
The United States has sold to a foreigner some of its output (the planes), and this
sale increases U.S. net exports. In addition, the United States has acquired some
foreign assets (the yen), and this acquisition increases U.S. net foreign investment.
Although Boeing most likely will not hold on to the yen it has acquired in this
sale, any subsequent transaction will preserve the equality of net exports and net
foreign investment. For example, Boeing may exchange its yen for dollars with a
U.S. mutual fund that wants the yen to buy stock in Sony Corporation, the Japan-
ese maker of consumer electronics. In this case, Boeing’s net export of planes
equals the mutual fund’s net foreign investment in Sony stock. Hence, NX and NFI
rise by an equal amount.
Alternatively, Boeing may exchange its yen for dollars with another U.S. com-
pany that wants to buy computers from Toshiba, the Japanese computer maker. In
this case, U.S. imports (of computers) exactly offset U.S. exports (of planes). The
sales by Boeing and Toshiba together affect neither U.S. net exports nor U.S. net
foreign investment. That is, NX and NFI are the same as they were before these
transactions took place.
The equality of net exports and net foreign investment follows from the fact
that every international transaction is an exchange. When a seller country transfers
a good or service to a buyer country, the buyer country gives up some asset to pay
for this good or service. The value of that asset equals the value of the good or ser-
vice sold. When we add everything up, the net value of goods and services sold by
a country (NX) must equal the net value of assets acquired (NFI). The international
664 PART ELEVEN THE MACROECONOMICS OF OPEN ECONOMIES
flow of goods and services and the international flow of capital are two sides of
the same coin.
SAVING, INVESTMENT, AND THEIR RELATIONSHIP
TO THE INTERNATIONAL FLOWS
A nation’s saving and investment are, as we have seen in Chapters 24 and 25, cru-
cial to its long-run economic growth. Let’s therefore consider how these variables
are related to the international flows of goods and capital, as measured by net
exports and net foreign investment. We can do this most easily with the help of
some simple mathematics.
As you may recall, the term net exports first appeared earlier in the book when
we discussed the components of gross domestic product. The economy’s gross
domestic product (Y) is divided among four components: consumption (C),
investment (I), government purchases (G), and net exports (NX). We write
this as
Y ϭ C ϩ I ϩ G ϩ NX.
W
ILL THE WORLD
’
SDEVELOPING COUN
-
tries, such as those in Latin America,
flood the world’s industrial countries
with cheap exports while refusing to
import goods from the industrial coun-
tries? Will the developing countries use
the world’s saving to finance invest-
ment and growth, leaving the indus-
trial countries with insufficient funds
for their own capital accumulation?
Some people fear that both of these out-
comes might occur. But an accounting
identity, and economist Paul Krugman,
tell us not to worry.
Fantasy Economics
B
Y
P
AUL
K
RUGMAN
Reports by international organizations
are usually greeted with well deserved
yawns. Occasionally, however, such a
report is a leading indicator of a sea
change in opinion.
A few weeks ago, the World Eco-
nomic Forum—which every year draws
an unmatched assemblage of the world’s
political and business elite to its confer-
ence in Davos, Switzerland—released
its annual report on international compet-
itiveness. The report made headlines be-
cause it demoted Japan and declared
America the world’s most competitive
economy.
The revealing part of the report,
however, is not its more or less mean-
ingless competitiveness rankings but its
introduction, which offers what seems to
be a very clear vision of the global eco-
nomic future.
That vision, shared by many power-
ful people, is compelling and alarming. It
is also nonsense. And the fact that this
nonsense is being taken seriously by
many people who believe themselves to
be sophisticated about economics is it-
self an ominous portent for the world
economy.
The report finds that the spread
of modern technology to newly in-
dustrializing nations is deindustrializing
high-wage nations: Capital is flowing to
the Third World and low-cost produc-
ers in these countries are flooding
world markets with cheap manufactured
goods.
The report predicts that these
trends will accelerate, that service jobs
will soon begin to follow the lost jobs in
manufacturing and that the future of the
high-wage nations offers a bleak choice
between declining wages and rising un-
employment.
This vision resonates with many
people. Yet as a description of what has
IN THE NEWS
Flows between
the Developing South
and the Industrial North
CHAPTER 29 OPEN-ECONOMY MACROECONOMICS: BASIC CONCEPTS 665
Total expenditure on the economy’s output of goods and services is the sum of
expenditure on consumption, investment, government purchases, and net exports.
Because each dollar of expenditure is placed into one of these four components,
this equation is an accounting identity: It must be true because of the way the vari-
ables are defined and measured.
Recall that national saving is the income of the nation that is left after paying
for current consumption and government purchases. National saving (S) equals
Y Ϫ C Ϫ G. If we rearrange the above equation to reflect this fact, we obtain
Y Ϫ C Ϫ G ϭ I ϩ NX
S ϭ I ϩ NX.
Because net exports (NX) also equal net foreign investment (NFI), we can write
this equation as
S ϭ I ϩ NFI
Saving ϭ
Domestic
ϩ
Net foreign
investment investment.
actually happened in recent years, it is al-
most completely untrue.
Rapidly growing Third World econ-
omies have indeed increased their ex-
ports of manufactured goods. But today
these exports absorb only about 1 per-
cent of First World income. Moreover,
Third World nations have also increased
their imports.
Overall, the effect of Third World
growth on the number of industrial jobs
in Western nations has been minimal:
Growing exports to the newly industrial-
izing countries have created about as
many jobs as growing imports have
displaced.
What about capital flows? The num-
bers sound impressive. Last year, $24
billion flowed to Mexico, $11 billion to
China. The total movement of capital
from advanced to developing nations
was about $60 billion. But though this
sounds like a lot, it is pocket change in a
world economy that invests more than
$4 trillion a year.
In other words, if the vision of a
Western economy battered by low-wage
competition is meant to describe today’s
world, it is a fantasy with hardly any ba-
sis in reality.
Even if the vision does not describe
the present, might it describe the future?
Well, growing exports of manufactured
goods from South to North will lead to a
net loss of northern industrial jobs only if
they are not matched by growth in ex-
ports from North to South.
The authors of the report evidently
envision a future of large-scale Third
World trade surpluses. But it is an un-
avoidable fact of accounting that a coun-
try that runs a trade surplus must also
be a net investor in other countries. So
large-scale deindustrialization can take
place only if low-wage nations are major
exporters of capital to high-wage na-
tions. This seems unlikely. In any case, it
contradicts the rest of the story, which
predicts huge capital flows into low-wage
nations.
Thus, the vision offered by the
world competitiveness report conflicts
not only with the facts but with itself. Yet
it is a vision that a growing number of the
world’s most influential men and women
seem to share. That is a dangerous
trend.
Not everyone who worries about
low-wage competition is a protectionist.
Indeed, the authors of the world compet-
itiveness report would surely claim to be
champions of free trade. Nonetheless,
the fact that such ideas have become re-
spectable . . . suggests that the intellec-
tual consensus that has kept world trade
relatively free, and that has allowed hun-
dreds of millions of people in the Third
World to get their first taste of prosper-
ity, may be unraveling.
S
OURCE
: The New York Times, September 26, 1994,
p. A17.
666 PART ELEVEN THE MACROECONOMICS OF OPEN ECONOMIES
CASE STUDY
ARE U.S. TRADE DEFICITS
A NATIONAL PROBLEM?
You may have heard the press call the United States “the world’s largest
debtor.” The nation earned that description by borrowing heavily in world fi-
nancial markets during the 1980s and 1990s to finance large trade deficits. Why
did the United States do this, and should this event give Americans reason to
worry?
To answer these questions, let’s see what these macroeconomic accounting
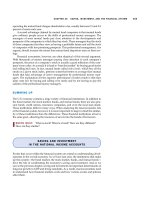
identities tell us about the U.S. economy. Panel (a) of Figure 29-2 shows national
saving and domestic investment as a percentage of GDP since 1960. Panel (b)
shows net foreign investment as a percentage of GDP. Notice that, as the identi-
ties require, net foreign investment always equals national saving minus do-
mestic investment.
The figure shows a dramatic change beginning in the early 1980s. Before
1980, national saving and domestic investment were very close, and so net for-
eign investment was small. Yet after 1980, national saving fell dramatically, in
part because of increased government budget deficits and in part because of a
fall in private saving. Because this fall in saving did not coincide with a similar
fall in domestic investment, net foreign investment became a large negative
number, indicating that foreigners were buying more assets in the United States
than Americans were buying abroad. Put simply, the United States was going
into debt.
As we have seen, accounting identities require that net exports must equal
net foreign investment. Thus, when net foreign investment became negative,
net exports became negative as well. The United States ran a trade deficit:
This equation shows that a nation’s saving must equal its domestic investment
plus its net foreign investment. In other words, when U.S. citizens save a dollar of
their income for the future, that dollar can be used to finance accumulation of do-
mestic capital or it can be used to finance the purchase of capital abroad.
This equation should look somewhat familiar. Earlier in the book, when we
analyzed the role of the financial system, we considered this identity for the spe-
cial case of a closed economy. In a closed economy, net foreign investment is zero
(NFI ϭ 0), so saving equals investment (S ϭ I). By contrast, an open economy has
two uses for its saving: domestic investment and net foreign investment.
As before, we can view the financial system as standing between the two sides
of this identity. For example, suppose the Smith family decides to save some of its
income for retirement. This decision contributes to national saving, the left-hand
side of our equation. If the Smiths deposit their saving in a mutual fund, the mu-
tual fund may use some of the deposit to buy stock issued by General Motors,
which uses the proceeds to build a factory in Ohio. In addition, the mutual fund
may use some of the Smiths’ deposit to buy stock issued by Toyota, which uses the
proceeds to build a factory in Osaka. These transactions show up on the right-
hand side of the equation. From the standpoint of U.S. accounting, the General
Motors expenditure on a new factory is domestic investment, and the purchase of
Toyota stock by a U.S. resident is net foreign investment. Thus, all saving in the
U.S. economy shows up as investment in the U.S. economy or as U.S. net foreign
investment.
CHAPTER 29 OPEN-ECONOMY MACROECONOMICS: BASIC CONCEPTS 667
Imports of goods and services exceeded exports. In 1998, the trade deficit was
$151 billion, or about 1.8 percent of GDP.
Are these trade deficits a problem for the U.S. economy? Most economists
believe that they are not a problem in themselves, but perhaps are a symptom
of a problem—reduced national saving. Reduced national saving is potentially
a problem because it means that the nation is putting away less to provide for
its future. Once national saving has fallen, however, there is no reason to de-
plore the resulting trade deficits. If national saving fell without inducing a trade
deficit, investment in the United States would have to fall. This fall in invest-
ment, in turn, would adversely affect the growth in the capital stock, labor
Percent
of GDP
20
18
16
14
12
10
1960 1965 199519901985198019751970
National saving
Domestic investment
Percent
of GDP
4
Ϫ
4
Ϫ
3
Ϫ
2
Ϫ
1
0
1
2
3
Net foreign
investment
(a) National Saving and Domestic Investment (as a percentage of GDP)
(b) Net Foreign Investment (as a percentage of GDP)
2000
1960 1965 199519901985198019751970 2000
Figure 29-2
N
ATIONAL
S
AVIN G
,
D
OMESTIC
I
NVESTMENT
,
AND
N
ET
F
OREIGN
I
NVESTMENT
.
Panel (a) shows national saving
and domestic investment as
a percentage of GDP. Panel
(b) shows net foreign investment
as a percentage of GDP. You can
see from the figure that national
saving has been lower since 1980
than it was before 1980. This fall
in national saving has been
reflected primarily in reduced net
foreign investment rather than in
reduced domestic investment.
S
OURCE
: U.S. Department of Commerce.