Deep learningbased approach for water crystal classification
Bạn đang xem bản rút gọn của tài liệu. Xem và tải ngay bản đầy đủ của tài liệu tại đây (13.47 MB, 63 trang )
VIETNAM NATIONAL UNIVERSITY, HANOI
UNIVERSITY OF ENGINEERING AND TECHNOLOGY
DOAN THI HIEN
DEEP LEARNING-BASED APPROACH FOR
WATER CRYSTAL CLASSIFICATION
MASTER THESIS
Major: Computer Science
HA NOI - 2021
Abstract
Almost the earth’s surface area is covered by water. As it is pointed out in the 2020
edition of the World Water Development Report, climate change challenges the sustainability of water resources. It is important to monitor the quality of water to preserve
sustainable water resources. Quality of water can be related to the water crystal structure, solid-state of water, methods to understand water crystal help to improve water
quality. First step, water crystal exploratory analysis has been initiated under cooperation with the Emoto Peace Project (EPP). The 5K EPP Dataset has been created as
the first world-wide small dataset of water crystals. Our research focused on reducing
inherent limitations when fitting machine learning models to the 5K EPP dataset. One
major result is the classification of water crystals and how to split our small dataset into
most related groups. Using the 5K EPP dataset human observations and past researches
on snow crystal classification, we provided a simple set of visual labels to name water
crystal shapes, with 12 categories. A deep learning-based method has been used to automatically do the classification task with a subset of the labeled dataset. The classification
achieved high accuracy when fine-tuning the ResNet pretrained model.
Keywords: Water crystal, Deep learning, Fine-tuning, Supervised, Classification.
iii
Acknowledgements
I would first like to thank my thesis supervisor Dr. Tran Quoc Long, Head of the Department of Computer Science at the University of Engineering and Technology. Thanks for
his insightful comments both in my work and in this thesis, for his support, and many
motivating discussions.
I also want to acknowledge my co-supervisor Dr. Frederic Andres from the National Institute of Informatics, Japan for offering me the internship opportunities at NII,
Japan and leading me working on diverse exciting projects. Without his support and
experience, I could not achieve today result.
Besides, I have been very privileged to get to know and to collaborate with many
other great collaborators.
Finally, I must express my very profound gratitude to my family for providing me
with unfailing support and continuous encouragement throughout my years of study and
through the process of researching and writing this thesis. This accomplishment would
not have been possible without them.
iv
Declaration
I declare that the thesis has been composed by myself and that the work has not be
submitted for any other degree or professional qualification. I confirm that the work
submitted is my own, except where work which has formed part of jointly-authored
publications has been included. My contribution and those of the other authors to this
work have been explicitly indicated below. I confirm that appropriate credit has been
given within this thesis where reference has been made to the work of others.
This study was conceived by all of the authors. I carried out the main idea(s) and
implemented all the model(s) and material(s).
I certify that, to the best of my knowledge, my thesis does not infringe upon anyone’s copyright nor violate any proprietary rights and that any ideas, techniques, quotations, or any other material from the work of other people included in my thesis, published or otherwise, are fully acknowledged in accordance with the standard referencing
practices. Furthermore, to the extent that I have included copyrighted material, I certify
that I have obtained a written permission from the copyright owner(s) to include such
material(s) in my thesis and have fully authorship to improve these materials.
Master student
Doan Thi Hien
v
Table of Contents
Abstract . . . . . . . . . . . . . . . . . . . . . . . . . . . . . . . . . . . . . . . . . iii
Acknowledgements . . . . . . . . . . . . . . . . . . . . . . . . . . . . . . . . . . .
iv
Declaration . . . . . . . . . . . . . . . . . . . . . . . . . . . . . . . . . . . . . . .
v
Table of Contents . . . . . . . . . . . . . . . . . . . . . . . . . . . . . . . . . . . .
vi
Acronyms . . . . . . . . . . . . . . . . . . . . . . . . . . . . . . . . . . . . . . . . viii
List of Figures . . . . . . . . . . . . . . . . . . . . . . . . . . . . . . . . . . . . . .
x
List of Tables . . . . . . . . . . . . . . . . . . . . . . . . . . . . . . . . . . . . . .
xi
1 Introduction . . . . . . . . . . . . . . . . . . . . . . . . . . . . . . . . . . . . .
1
1.1 Motivation . . . . . . . . . . . . . . . . . . . . . . . . . . . . . . . . . . .
1
1.2 Problem Statement . . . . . . . . . . . . . . . . . . . . . . . . . . . . . . .
2
1.3 Difficulties and Challenges . . . . . . . . . . . . . . . . . . . . . . . . . .
4
1.4 Common Approaches . . . . . . . . . . . . . . . . . . . . . . . . . . . . .
5
1.5 Contributions and Structure of the Thesis . . . . . . . . . . . . . . . . . .
6
2 Related Work . . . . . . . . . . . . . . . . . . . . . . . . . . . . . . . . . . . .
8
2.1 Manually Approaches . . . . . . . . . . . . . . . . . . . . . . . . . . . . .
8
2.2 Deep Learning-Based Approaches . . . . . . . . . . . . . . . . . . . . . .
9
3 The 5K EPP dataset . . . . . . . . . . . . . . . . . . . . . . . . . . . . . . . . 11
3.1 Data collection . . . . . . . . . . . . . . . . . . . . . . . . . . . . . . . . . 11
3.2 Water crystal definition . . . . . . . . . . . . . . . . . . . . . . . . . . . . . 12
4 Materials and Methods . . . . . . . . . . . . . . . . . . . . . . . . . . . . . . . 17
4.1 Theoretical Basis . . . . . . . . . . . . . . . . . . . . . . . . . . . . . . . . 17
4.1.1 Convolutional Neural Network . . . . . . . . . . . . . . . . . . . . 17
vi
4.1.2 Convolutional Autoencoder . . . . . . . . . . . . . . . . . . . . . . 19
4.1.3 Residual Connection . . . . . . . . . . . . . . . . . . . . . . . . . . 20
4.2 Overview of Proposed System . . . . . . . . . . . . . . . . . . . . . . . . . 20
4.3 Unsupervised Learning . . . . . . . . . . . . . . . . . . . . . . . . . . . . . 21
4.3.1 Residual Autoencoder Model . . . . . . . . . . . . . . . . . . . . . 21
4.3.2 K-means algorithm . . . . . . . . . . . . . . . . . . . . . . . . . . . 23
4.4 Supervised Learning . . . . . . . . . . . . . . . . . . . . . . . . . . . . . . 24
4.5 Data processing . . . . . . . . . . . . . . . . . . . . . . . . . . . . . . . . . 26
4.5.1 Background removing . . . . . . . . . . . . . . . . . . . . . . . . . 26
4.5.2 Dataset diversity . . . . . . . . . . . . . . . . . . . . . . . . . . . . 27
4.5.3 Imbalanced data . . . . . . . . . . . . . . . . . . . . . . . . . . . . 27
5 Experiments and Results . . . . . . . . . . . . . . . . . . . . . . . . . . . . . . 29
5.1 Implementation and Configurations . . . . . . . . . . . . . . . . . . . . . . 29
5.1.1 Model Implementation . . . . . . . . . . . . . . . . . . . . . . . . . 29
5.1.2 Training and Testing Environment . . . . . . . . . . . . . . . . . . 30
5.2 Datasets and Evaluation methods . . . . . . . . . . . . . . . . . . . . . . . 31
5.2.1 Dataset . . . . . . . . . . . . . . . . . . . . . . . . . . . . . . . . . 31
5.2.2 Metrics and Evaluation . . . . . . . . . . . . . . . . . . . . . . . . . 32
5.3 Performance of Proposed model . . . . . . . . . . . . . . . . . . . . . . . . 33
5.3.1 Residual Autoencoder model (RAE) . . . . . . . . . . . . . . . . . 33
5.3.2 K-means for Clustering . . . . . . . . . . . . . . . . . . . . . . . . 35
5.3.3 Training Classification Model . . . . . . . . . . . . . . . . . . . . . 36
Conclusions . . . . . . . . . . . . . . . . . . . . . . . . . . . . . . . . . . . . . . . 40
References . . . . . . . . . . . . . . . . . . . . . . . . . . . . . . . . . . . . . . . . 41
vii
Acronyms
2D
2-Dimensional
3D
3-Dimensional
Adam
Adaptive Moment Estimation
AI
Artificial Intelligence
BCE
Binary Cross Entropy
CAE
Convolutional Auto Encoder
CNN
Convolutional Neural Network
CPU
Central Processing Unit
DNN
Deep Neural Network
EPP
Emoto Peace Project
FC
Fully Connected
GPU
Graphics Processing Unit
ILSVRC ImageNet Large Scale Visual Recognition
Challenge
MASC
Multi-Angle Snowflake Camera
MLP
Multilayer Perceptron
RAE
Residual Auto Encoder
viii
ReLU
Rectified Linear Unit
RNN
Recurrent Neural Network
SGD
Stochastic Gradient Descent
SSIM
Structural Similarity Index
ix
List of Figures
1.1 A typical pipeline of classification system . . . . . . . . . . . . . . . . . .
3
3.1 A tree-like diagram to demonstrate the water crystal categories with 5K
EPP dataset. . . . . . . . . . . . . . . . . . . . . . . . . . . . . . . . . . . . 12
4.1 System overview. . . . . . . . . . . . . . . . . . . . . . . . . . . . . . . . . 21
4.2 Residual block’s structures. (a) The regular block. (b) The downsample
block . . . . . . . . . . . . . . . . . . . . . . . . . . . . . . . . . . . . . . . 22
4.3 Residual Autoencoder model to extract features from origin images. Each
residual block is a combination of a downsample block and a regular
block respectively. . . . . . . . . . . . . . . . . . . . . . . . . . . . . . . . 23
4.4 Clustering with K-means. The image features are extracted by Residual
Autoencoder (RAE) model. Those features are then fed into the k-mean
algorithm to do the clustering. . . . . . . . . . . . . . . . . . . . . . . . . . 24
4.5 Otsu’s method is applied to find an object mask and remove the bacground which is not relevant to object area. . . . . . . . . . . . . . . . . . 26
5.1 Reconstruct image generated by RAE model train with BCE and Spherical metric separately. The SSIM index is calculated with each reconstructed image. The spherical one is outperforming the BCE one. . . . . . 34
5.2 A visualization for K-means clustering result. The number of classes
which equals to 13 shows the best performance, with the densest space. . . 35
5.3 Three different transfer learning techniques were used to train the baseline model (SqueezeNet): feature extracting, fine-tuning, and proposed
fine-tuning. . . . . . . . . . . . . . . . . . . . . . . . . . . . . . . . . . . . 37
5.4 Our proposed model is compared with Hicks’s model. Both implementations are trained on the 5K EPP dataset. Our accuracy (99.05%) is 0.2%
higher than Hicks’ one (98.80%). . . . . . . . . . . . . . . . . . . . . . . . 39
x
List of Tables
3.1 The definition for water crystal classes based on the knowledge from [16]
classification. . . . . . . . . . . . . . . . . . . . . . . . . . . . . . . . . . . 13
3.2 5K EPP dataset summary. . . . . . . . . . . . . . . . . . . . . . . . . . . . 15
5.1 Grid5000: Gemini clusters’s configuration. . . . . . . . . . . . . . . . . . 30
5.2 Statistics of 5K EPP dataset distribution used in the training classification
model. . . . . . . . . . . . . . . . . . . . . . . . . . . . . . . . . . . . . . . 31
5.3 Top-1 Accuracy and F1 -score on 5K EPP dataset. . . . . . . . . . . . . . . 38
xi
Chapter 1
Introduction
1.1
Motivation
Along with the development of society, the research on human impact on nature is more
and more concerned. Water quality [4] has become one of the main challenges that
societies will face during the 21st century, as the United Nations brought water quality
issues to the forefront of international actions under the Sustainable Development Goal
6. It is important to monitor how human actions will affect water quality, pollution
issues... Water has been playing an important role in the climatic ecosystem. Because
most of our planet is covered by water, 70 to 90% of the human body (depending on
age) is water. Testing the quality is simple, but not too simple as water can exist in
different states or phases (liquid, solid, and gas). Advanced researches [8] has been
done to understand water phases finding a new phase for the water liquid. Water quality
can be evaluated in each of the four phases.
Crystals are formed when water changes to a solid-state, are usually frozen at -25
to -30 degrees Celsius. Depending on the origin of the water and the formation process,
crystals are divided into three main types: snow crystals, ice crystals, and water crystals.
From the shape of the crystal, the purity and the texture level are clearly reflected, then it
enables us to assess the quality of the water. Depending on the environmental conditions
and the impact of the surrounding elements, the same water can give many different
shapes. Each type of shape of crystals can be considered to be unique, without repetition.
Up to now, a lot of research has been done to classify water solid form: crystals.
Based on the researcher’s knowledge and available dataset, they focused on classifying
the snowflake and ice crystals. A full definition of snowflake categories was proposed
1
and finalized overtime. But no research has been done with water crystals.
While co-operating with Emoto Peace Project, we have a chance to work with the
water crystal data, which is contributed over 20 years. We, therefore, have the urge
to build a system to classify water crystal based on deep learning methods. We are
interested in applying a deep learning model to extract the high-meaning features from
2D water crystal images then use those features to classify their structures.
In this thesis, we focus on the 2 main tasks: (1) provide a new definition of water
crystal structure and (2) build a classifier to split the labeled dataset into small groups.
1.2
Problem Statement
Nowadays, the problem of environmental pollution is very concerned, especially water
pollution. Along with the speed of development and urbanization in Vietnam, the problem of water pollution is also becoming more and more serious. At the Workshop ”Water security for sustainable development in Vietnam” organized by the Vietnam Union of
Science and Technology Associations (VUSTA), experts raised alarm about the state of
water security in Vietnam. Currently 20% of people do not have access to clean water,
17.2 million people still use water sources that do not meet the clean water standards of
the Ministry of Health.
We decided to do this research to solve current two big problems related to water
quality.
The first problem is how can we assess the water quality. In fact, to check the quality of water, we need to test according to many factors: Physical examination, Chemical
test and Bacterial examination [4]. All those process take time and costs. The question
is how to reduce costs and speed up the evaluation process.
The second problem is how can we apply machine learning in water quality assessment. It’s mentioned as classification problem in machine learning. In the terminology
of machine learning [1], classification is considered an in‘stance of supervised learning,
in which the computer program learns from the data given to it and make new observations or classifications. The main goal is to identify which class/category the new data
will fall into. It can be performed on both structured or unstructured data. The process
starts with predicting the class of given data points. The classes are often referred to as
target, label, or categories. Figure 1.1 shows an overview of the classification system.
While the classifier is trained with labeled data, it will be able to predict the class or
2
Figure 1.1: A typical pipeline of classification system
category for the new data, which is kept secret with the classifier.
Based on the data observation and machine learning-based knowledge, we focus
on building an deep learning model to classify the water crystal, in which we can assess
the water quality.
To build a machine learning classification system, it requires two main parts: data
and algorithm.
• Data is the most important part to build any machine learning system. It can be a
set of observations or instances, which are correctly labeled by humans or a trust
system. Data should be present in a numeric vector or matrix. For example, an
image X is presented as a matrix of real values where each number is a pixel,
demonstrate for an image illumination: X =
0.1 122.5 255.0
0.1 255.0 255.0
• Algorithm is a mapping function from input variables to output variables. Given a
dataset X , algorithm f is responsible for mapping X to a specific class y : y = f (X).
An algorithm that implements classification, especially in a concrete implementation, is known as a classifier. The term “classifier” sometimes also refers to the
mathematical function, implemented by a classification algorithm, that maps input
data to a category.
In this thesis, we mainly focus on building a deep learning-based classification and
providing a high-quality dataset with water crystal to teach the algorithm the mapping
function.
3
1.3
Difficulties and Challenges
Classification is a general problem in computer science. Even we have many proposed
works in these tasks, we need to build a new classifier for each specific domain. There
exists some of difficulties and challenges, from the basic issue of deep learning classification to its various specific issues as below:
• Small dataset. With the specific condition of surrounding, the same water bottle
can form different WCs. Any small change can lead to a different and unexpected
type of crystal. Therefore, while getting a water sample and capturing the photo
from it, the scientist needs to do it very carefully. Besides, to enhance the diversity
of the dataset, the scientist needs to collect dataset all around the world with the
help of other organization.
• Imbalanced data. It is considered as an extremely serious classification issue, in
which we can expect poor accuracy for minor classes. Generally, only positive
instances are annotated in most relation extraction corpora, so negative instances
must be generated automatically by pairing all the entities appearing in the same
sentence that has not been annotated as positives yet. Because of a big number in
such entities, the number of possible negatives pairs is huge.
• High resolution image. To capture the water crystal, the Emoto laboratory used
the microscope camera. Because the crystals are very small, and to capture full
details, they need to keep the highest resolution. So, the final dataset has a very
high resolution, which is considered as a serious issue with deep learning.
There are many other difficulties in applying deep learning in the domain of water
crystal. The main constraints is Lack of training data. To train a deep learning model, it
requires a large size dataset with good quality. In general image classification problems,
training dataset can be download easily from the internet with good quality and quantity
(i.e. ImageNet, MNIST, satellite imagery, etc.). However, with water crystal, there
are many limitations on collecting dataset from many countries and resources to get a
diverse dataset. Therefore, it is hard to enrich the dataset. Besides, it is time and money
consuming for labeling because it requires special experts with domain knowledge.
However, none of the current approaches can solve these problems. Therefore,
special approaches are required to archive good results.
4
1.4
Common Approaches
From 1931, when Wilson Bentley created the first method of photographing snowflakes,
much research has been done in the classification tasks.
The most popular approach to classify crystal is manually classification, which
is based on human observation. In recent years, with the advent of deep learning, deep
learning-based classification was proposed. All of them are proven to be effective and
have different strengths by leveraging different types of linguistic knowledge, however,
also suffer from their own limitations.
From a physical point of view, Ta − s diagram (Nakaya’s classification) was proposed to classify snow crystals which are collected from Mount Takachi [23]. This
method is very simple and cannot be used for the irregular form of snow crystals, the
most popular form in nature. An improvement version of Nakaya’s classification was
proposed [22]. This method can describe the meteorological difference in the group of
asymmetric or modified types of snow crystals. However, the snow crystals were collected in a specific area. So, it reduces the diversity of the dataset. To overcome this
problem, a global classification was made to classify snow crystal, ice crystal, and solid
precipitation particles [16]. These observations were done from middle latitudes (Japan)
to polar regions. However, this classification takes time to classify with a large-scale
dataset.
Another approach using a deep learning-based method was proposed in recent
years. With the images collected by Multi-Angle Snowflake Camera (MASC) [7], some
research using a deep learning method was proposed. With supervised learning, a combination of convolutional neural network and residual network which pretrained with
ImageNet was used as a backbone for the classification model. This method provides
geometrics and the degrees of rimming classification. Another unsupervised learning
method was published to overcome the problem with the large-scale dataset and human
intervention. GAN and K-medoids are used to classify MASC dataset into 16 hierarchical clustering groups. Even that it can automatically classification the snowflakes type,
but this model just fits with the MASC snowflake dataset only. The detail and overview
of related work will be stated in Chapter 2.
5
1.5
Contributions and Structure of the Thesis
Up to now, working with a natural material like water still attract the interesting of
many researchers in the world. Especially with classification problems, not many deep
learning-based methods are applied to this problem. In our knowledge, most previous
researches often focus on classifying water crystals based on their knowledge base or
human knowledge. Considering these problems as motivation to improve, in this paper,
we present a deep learning-based method to solve that problem.
In this work, we focus on building a basic definition based on EPP dataset. Based
on that definition, a deep learning model is used to automatically classify the labeled
dataset.
Consider the limitations of a small and imbalanced dataset, we analyze the results
and fine-tune the parameters after each training stage.
The main contributions of our work can be concluded as:
• We proposed a new definition for water crystal structure based on previous related
research, especially in [16]. This definition can be known as the first one in water
crystal classification.
• We introduce a new data science dataset in water crystal structures, which was
collected by Emoto laboratory and labeled based on our new definition. We named
that it 5K EPP dataset.
• We proposed an end-to-end trainable model to extract meaningful features from a
high-resolution water crystal dataset. The model is inspired by the Autoencoder
model and residual neural network.
• We proposed a deep learning model to classify the 5K EPP dataset. We overcome
the problem when training the model with a small and imbalanced dataset. We
also make a comparison between multiple deep learning networks and find the
best solution.
My thesis includes five main Chapters and one Conclusions, as follow:
Chapter 1: Introduction. This Chapter is an introduction to the water crystal
problem, an overview of common approaches to classification problems. We present the
motivations and the difficulties and challenges of Relation Extraction as well.
Chapter 2: Related Work. We introduce relevant related work shared among
all the methods in this thesis. This chapter introduces the history and development of
6
crystal dataset and related research on classification tasks, from the traditional methods
to the deep learning method.
Chapter 3: The 5K EPP dataset. The 5K EPP dataset is described in this Chapter.
A fully description text and diagram are provided in this Chapter for a better understanding of our new definition.
Chapter 4: Materials and Methods. Chapter 4 begins by providing an overview
of our deep learning background used in this thesis. Next, we will introduce how we
build the Residual Autoencoder model to extract features from the EPP dataset. Then,
we present the classifier overview architecture. Finally, we conclude the chapter by
providing a brief introduction to how we improve our model’s performance with several
techniques.
Chapter 5: Experiments and Results. We provide an insight into the implementation of the models and discuss the hyper-parameter settings. Next, we evaluate our
model on the 5K EPP dataset with different backbone. The method introduced in Chapter 4 are compared to find the best architecture with this dataset. Finally, we analyze the
output and the error for better insight into our models.
Conclusions. This chapter concludes the thesis by summarizing the important
contributions and results. Also, we highlight the limitations of our models and point out
some further extensions in the future work.
7
Chapter 2
Related Work
With a research focus to improve precipitation measurement and forecast for over 50
years, the scientific study of meteorology and weather includes the study of snowflakes,
ice crystals, and water crystals. Snowflake studies provide some of the most detailed
evidence of climate change. It impacts atmospheric science. We categorize approaches
to crystals classification into two main categories: Manually Approaches (Section 2.1)
and Deep Learning-Based Approaches (Section 2.2).
2.1
Manually Approaches
One of the first attempts to catalog snowflakes was made in the 1930s by Wilson Bentley
who created a method of photographing snowflakes in 1931, using a microscope attached
to a camera. The Bentley Snow Crystal Collection [3] includes about 6125 items.
A general classification of snow crystals Ta − s diagram was proposed by Nakaya
[23], which provides the most perfect classification from a physical point of view, with
7 categories. These categories include needles, columns, fern-like crystals developed
in one plane, combination of column and plane crystals, rimed crystals, and irregular
crystals. The crystal images were collected from a slope of Mount Takachi, near the
center of Hokkaido Island.
Magono [22] published an improvement version of Nakaya’s classification, with
the modification and supplement for Nakaya’s classification of snow crystals. The results got by laboratory experiments and meteorological observation. The new classification provides the temperature and humidity conditions, which can describe the meteorological difference in the group of asymmetric or modified types of snow crystals. It
8
provides 80 categories, which has some modification from Nakaya’s categories and add
some new categories. Thirty thousand microscopic photographs of snow crystals taken
by the Cloud Physics Group were used in their research.
Kikuchi and his team [16] proposed a new classification with 121 categories to
classify snow crystal, ice crystal, and solid precipitation particles. They qualified its
classification ”global scale” or ”global” because their observations were done from middle latitudes (Japan) to polar regions. This classification consisted of three levels: general, intermediate, and elementary - which are composed of 8, 39, and 121 categories,
respectively. Especially, this classification can be used not only for snow crystals but
also for ice crystals.
Radin et al. published two studies related to the effects of distant intention on
water crystal formation [27, 28]. In these research, they did the experiments on how
a group of people’s intentions can affect the water samples located inside a far-away
laboratory. They put the positive intentions to all the samples, send the water bottles to
Emoto Laboratory in Tokyo to get the crystals from them. A double and triple-blind test
was done respectively.
2.2
Deep Learning-Based Approaches
The deep learning method has been widely applied in many research fields, especially
with image dataset. But it faces the problem of the dataset’s limitation. Fortunately,
with the advent of image collection methods, a method to collect snowflake images was
proposed: the Multi-Angle Snowflake Camera (MASC) [7]. It was developed to address
the need for high-resolution multi-angle imaging of hydrometeors in freefall and has
resulted in datasets comprising millions of images of falling snowflakes. Therefore,
there is many research have been published.
A new method to automatically classify solid hydrometeors based on MASC images is presented by Praz et al. [26]. In this research, they proposed a regularized
multinomial logistic regression (MLR) model to output the probabilistic information of
MASC images. That probability is then weighed on the three stereoscopic views of the
MASC to assign a unique label to each hydrometeor. MLR model is trained over more
than 3,000 MASC images labeled by visual inspection. This model achieved very high
performance with 95% accuracy.
Hicks et al. [12] published an automatic method to classify snowflakes, collected
9
by Multi-Angle Snowflake Camera (MASC). The training data set contains 1,400 MASC
images. They used ResNet, which is a residual network pretrained with ImageNet, as
a backbone for their model. Snowflakes are sorted by geometrics and divided into 6
distinct classes. Then, the degrees of rimming is decided by another training process,
which has there distinct classes. Even the accuracy of this research is only 93.4%, but it
provides a new way to classify snowflakes or nature structures automatically.
Another research with the MASC dataset was proposed by Leinonen et al. [20]. In
this research, they aimed to classify large-scale MASC dataset by unsupervised learning
method, using generative neural network (GAN) [9] and K-medoids [15]. With the features extracted from the discriminator part of the GAN model, they used the K-medoids
algorithm to cluster all the image (data points) into 16 classes/categories. This method
not only shows the hierarchical clustering groups but also requires no human intervention with such a large dataset. They calculate distance inside and outside the cluster as
the metric to compare with other classification method.
10
Chapter 3
The 5K EPP dataset
3.1
Data collection
The water crystals are provided by Emoto Peace Project (EPP) laboratory. Water crystals
are collected from many countries and sources, with the help of scientists all around the
world. Water samples from each bottle are produced by the same procedure in [28]:
• From each bottle, a drop (approximately 0.5 ml) of water was placed into each of
50 Petri dishes. So that, there are 50 waterdrops from each bottle.
• Those dishes are then placed on a tray in a random position in a freezer maintained
at -25 to -30◦ C. The random placements helped to ensure that potential temperature
differences within the freezer would be randomized among the dishes.
• The dishes then are removed from the freezer, and in a walk-in refrigerator (main-
tained at -5◦ C). The water crystal photo is taken on the top of each resulting ice
drop using a stereo optical microscope at either 100X or 200X, depending on the
presence and size of a crystal.
In the past, those images were captured and stored as paper photos. The Emoto
laboratory used them to research human influence on the shape of crystals. In this research, we encourage them to store crystal images as digital images, so that, it reduces
the chance of losing data. In total, the dataset contains more than 20,000 images, that
have different memories or different intentions.
11
3.2
Water crystal definition
Previous studies proposed many definition for snowflake categories [16, 22, 23]. They
started from a very simple definition and tried to improve it through human observation.
The most complete one can be mentioned as Kikuchi’s definition, which is called ”global
classification”.
There are some differences between snowflakes and water crystal images. With
snowflake images, the photo was taken during the fall of snowflakes in the wild. While,
water crystal images were taken in the laboratory, under strict control over temperature
and humidity. Therefore, it would be better to have a separate definition of the water
crystal. In this research, we build a new definition for water crystal based on Kikuchi’s
study and our observation in our dataset.
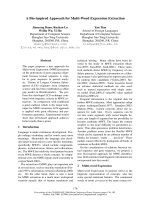
Figure 3.1: A tree-like diagram to demonstrate the water crystal categories with 5K EPP
dataset.
We hierarchically define data. The 3 largest groups are Singular, Multiple, and Undefined, respectively. The Singular group contains only images with a singular crystal.
Its position can be anywhere in the photo. The Multiple often includes images of more
than 2 objects. Those objects should be a group of crystals that have a strong connection.
The final group, Undefined, includes abnormal crystals that we can not define its shape
and sometimes captures only the water surface.
Within each group, we split crystal into smaller categories. In total, the new definition has 12 categories. We use a tree-like diagram in Figure 3.1 to demonstrate the
way we build the definition and the relationship among categories. Each leaf of the tree
is corresponding to the category in the definition. We also provided a text definition in
Table 3.1.
12
Table 3.1: The definition for water crystal classes based on the knowledge from [16]
classification.
Category
Example
Definition
A singular plate is a hexagonal plate,
the most basic snow crystal geometry.
Depending on how fast the different
facets grow, it can appear as thin hexag-
Singular plate
onal plates, slender hexagonal columns
(shaped a lot like wooden pencils), or
anything in between.
They are capped columns with an especially short central column. The plates
are so close together that inevitably one
Double plate
grows out faster and shields the other
from its source of water vapor. The result is one large plate connected to a
much smaller one.
These common crystals are thin, platelike crystals with six broad arms that
Stellar Plates
form a star-like shape. Their faces are
often decorated with amazingly elaborate and symmetrical markings.
Dendritic means ”tree-like”, so stellar
dendrites are plate-like water crystals
that have branches and side-branches.
Stellar Dendrites
These are fairly large crystals, typically
2-4 mm in diameter, that are easily seen
with the naked eye.
13
Category
Example
Definition
Though looking like stellar crystals, but
they have so many side-branches, look a
Fern-like
bit like ferns. These are the largest wa-
Stellar
ter crystals. In spite of their large size,
Dendrites
these are single crystals of ice – the water molecules are lined up from one end
to the other.
Plates sometimes grow as truncated triangles when the temperature is near 2 Celsius degree. If the corners of the
Triangular plate
plates sprout arms, the result is an odd
version of a stellar plate crystal. These
crystals are relatively rare.
Needles are slender, columnar ice crys-
Columns/ Needles
tals. Columns includes hexagonal column and capped column.
This type of crystals include asymmetric
Irregular plate
crystals or crystals that cannot complete
the process of crystal formation.
These are forms of double plates, except
Complex
Split
Plates
plate/
that part of one plate grows large along
and
with part of the other plate. Split plates
Stars
and stars, like double plates, are common but often unnoticed.
They are most common type of water
crystals by far. These are small, usu-
Combination
ally clumped together, and show little of
the symmetry seen in stellar or columnar
crystals.
14