Factors affecting customers purchasing decision for consumer goods brands in ho chi minh city in the integration competition
Bạn đang xem bản rút gọn của tài liệu. Xem và tải ngay bản đầy đủ của tài liệu tại đây (1.8 MB, 134 trang )
MINISTRY OF EDUCATION AND TRAINING STATE BANK OF VIETNAM
BANKING UNIVERSITY HCMC
NGUYEN TRAN MAI VY
FACTORS AFFECTING CUSTOMER’S PURCHASING DECISION
FOR CONSUMER GOODS BRANDS IN HO CHI MINH CITY
IN THE INTEGRATION COMPETITION
BACHELOR THESIS
MAJOR: BUSINESS ADMINISTRATION
CODE: 52340101
INSTRUCTOR: M.S. DANG TRUONG THANH NHAN
Ho Chi Minh City, 2018
2
ABSTRACT
The purpose of this research is to analyze the factors affecting customer‟s
purchasing decision for consumer goods brands in Ho Chi Minh City in the
integration competition, also help Ho Chi Minh City business owners orient and
define the strategy and competitiveness of their brands and find solutions to
promote the brand and develop the business.
This study collected data from the survey of the factors affecting customer‟s
purchasing decision for consumer goods brands in Ho Chi Minh City in integration
competition. After the data being analyzed by concurrent data on SPSS software,
the main objectives of this study are to:
First, identify the factors affecting customer‟s purchasing decision for
consumer goods brands in HCMC in integration competition.
Second, determine the priority order of the impact level these factors
affecting customer‟s purchasing decision for consumer goods brands
in HCMC in integration competition.
Third, propose solutions to improve Ho Chi Minh City consumer
goods brands in integration competition
BACHELOR THESIS
NGUYEN TRAN MAI VY
3
COMMITMENT AND THANKS
This thesis is the researcher's own work, the research result is honest, in
which no previously published content or content of other researchers are presented,
except for citations are fully cited in the thesis.
After a period of time studying, the researcher was helped by all the teachers
and friends in support of implementing the knowledge more and more abundant.
With deepest gratitude, the researcher would like to sincerely thank all the
teachers of the Business Administration Department who use their knowledge and
enthusiasm to convey the precious knowledge to students during the study period at
Banking University HCMC. In particular, the researcher would like to give a special
thank to Ph.D. Dang Truong Thanh Nhan for spending time in guidance and support
for the researcher‟s bachelor thesis.
Due to the researcher‟s limited knowledge and many more, the researcher
will not be able to avoid the shortcomings. Consequently, the researcher would like
to receive valuable comments from teachers and classmates so that the knowledge
in this field will be enhanced and improved.
BACHELOR THESIS
NGUYEN TRAN MAI VY
4
IMPLEMENTATION SCHEDULE
Table 1. Implementation schedule
From Jan / 2018
To Dec / 2018
1
3
5
7
9
11
+
+
+
+
+
+
2
4
6
8
10
12
Expect the content
Develop thesis outline
Collecting materials for basic definitions,
literature review, and survey building
Develop questionnaire surveys, complete the
questionnaire and collect information from experts
and people
Processing and analyzing survey information
Essay writing
Ask for guidance from instructors, complete thesis
Thesis defense
BACHELOR THESIS
NGUYEN TRAN MAI VY
5
TABLE OF CONTENTS
LIST OF ACRONYMS ........................................................................................... 8
LIST OF TABLES AND FIGURES ........................................................................ 9
CHAPTER I.
INTRODUCTION....................................................................... 13
1.1.
The urgency of the research: ..................................................................... 13
1.2.
Purpose and target of the research: ........................................................... 17
1.2.1.
Purpose: ............................................................................................. 17
1.2.2.
Target: ............................................................................................... 17
1.3.
Object and scope of the research: ............................................................. 17
1.3.1.
Object of study: ................................................................................. 17
1.3.2.
Scope of study: .................................................................................. 17
CHAPTER II.
2.1.
LITERATURE REVIEW ............................................................ 18
Overview of the brand: ............................................................................. 18
2.1.1.
History of the brand: (Matt, 2014) ................................................ 18
2.1.2.
Definition of the brand: ...................................................................... 19
2.1.3.
Component of the brand:.................................................................... 19
2.1.4.
Scale of the brand: ............................................................................. 20
2.2.
Overview of the consumer goods industry in Vietnam: ............................. 25
2.3.
Overview of marketing: ............................................................................ 38
2.4.
Overview of brand marketing: .................................................................. 44
2.4.1. Definition of brand marketing: (Kotler, Armstrong, Trifts, Peggy,
2004) 44
2.4.2.
2.5.
Using marketing in establishing and developing business's brand: ..... 45
Overview of customer: (Hitesh, 2018) ................................................. 46
2.5.1.
Starting point ..................................................................................... 48
2.5.2.
Focus ................................................................................................. 48
2.5.3.
Means ................................................................................................ 48
2.5.4.
Ends................................................................................................... 48
2.6.
Consumer behavior: ................................................................................. 49
2.7.
The decision to buy from consumers: ....................................................... 51
BACHELOR THESIS
NGUYEN TRAN MAI VY
6
2.7.1.
The progress of decision to buy from consumers: .............................. 51
2.7.2.
The factors affect the decision to buy from consumers: ...................... 53
2.8.
2.7.2.1.
Factors of cultural level: .............................................................. 54
2.7.2.2.
Elements of social nature: ........................................................... 54
2.7.2.3.
Factors of a personal nature: ........................................................ 55
2.7.2.4.
Factors of psychological nature: .................................................. 56
The views of researchers on perceived value: ........................................... 57
2.9. Proposed model about factors affecting customer‟s purchasing decision to
consumer goods brand in Ho Chi Minh City: ..................................................... 64
CHAPTER III. RESEARCH METHODOLOGY ................................................ 68
3.1.
Overview:................................................................................................. 68
3.2.
Research Design: ...................................................................................... 69
3.3.
Research Methodology: ............................................................................ 70
3.3.1.
Methodology of theoretical research: ................................................. 70
3.3.2.
Practical research method: ................................................................. 71
3.4.
Determination of the sample selection method: ........................................ 79
3.5.
Build the scale: ......................................................................................... 80
3.5.1.
Scale of Quality Value: ...................................................................... 81
3.5.2.
Scale of Price Value:.......................................................................... 81
3.5.3.
Scale of Social Value: ........................................................................ 82
3.5.4.
Scale of Emotional Value: ................................................................. 82
3.5.5.
Scale of Personnel Value: .................................................................. 83
3.5.6.
Scale of Distribution Density: ............................................................ 83
3.5.7.
Scale of customer‟s purchasing decision to consumer goods brand: ... 84
3.6.
Data processing methods: ......................................................................... 85
3.6.1.
Cronbach‟s Alpha analysing: ............................................................. 85
3.6.2.
EFA Analysing: ................................................................................. 86
3.6.3.
Regression and ANOVA analysing: ................................................... 87
CHAPTER IV. THE RESEARCH RESULT ....................................................... 89
4.1.
Samples descriptions: ............................................................................... 89
4.2.
Reliability coefficients Cronbach‟s Alpha: ............................................... 92
BACHELOR THESIS
NGUYEN TRAN MAI VY
7
4.2.1.
Quality Value (QV): .......................................................................... 92
4.2.2.
Price Value (PCV): ............................................................................ 93
4.2.3.
Social Value (SV): ............................................................................. 94
4.2.4.
Emotional Value (EV): ...................................................................... 95
4.2.5.
Personnel Value (PV): ....................................................................... 96
4.2.6.
Distribution Density (DD): ................................................................ 97
4.2.7.
Customer‟s purchasing decision to consumer goods brand: ................ 98
4.3.
EFA Analysing (Exploratory Factor Analysis): ........................................ 99
4.3.1.
EFA Analysis result of independent variables: ................................... 99
4.3.2.
EFA analysis result of dependent variables: ..................................... 102
4.4.
Comparative Analysis: ........................................................................... 104
4.5.
Analyze Regression model: .................................................................... 106
4.6.
Determining the difference by the characteristics of the research object: 109
4.6.1.
Gender Differences: ......................................................................... 109
4.6.2.
Age Differences: .............................................................................. 111
4.6.3.
Educational Level Differences: ........................................................ 113
4.6.4.
Income Differences: ......................................................................... 115
4.6.5.
Residence Differences: .................................................................... 117
CHAPTER V.
CONCLUSION ......................................................................... 120
BIBLIOGRAPHY ............................................................................................... 127
REFERENCES 130
BACHELOR THESIS
NGUYEN TRAN MAI VY
8
LIST OF ACRONYMS
ADB
Asian Development Bank
ANOVA
Analysis of Variance
CFA
Confirmatory Factor Analysis
CRPs
Consumer Reach Points
CSR
Corporate Social Responsibility
EFA
Exploratory Factor Analysis
Etc.
Et Cetera
FMCG
Fast Moving Consumer Goods
GRI
Global Reporting Initiative
HCMC
Ho Chi Minh City
HDI
Human Development Index
IUCN
International Union for Conservation of Nature
and Natural Resources
KPIs
Key Performance Indicators
SPSS
Statistical Package for Social Sciences
SWOT
Strengths–Weaknesses–Opportunities–Threats
USP
Unique Selling Proposition
WIPO
World Intellectual Property Organization
BACHELOR THESIS
NGUYEN TRAN MAI VY
9
LIST OF TABLES AND FIGURES
TABLES:
Table 2.1.4a. Scale of Lacoeuilhe (2000)
Page 21
Table 2.1.4b. Scale of Thomson and partner (2005)
Page 23
Table 2.1.4c. Research sample statistics
Page 24
Table 2.3. Top 10 most-purchased manufacturers in 4 main cities
and rural areas in Vietnam
Page 27
Table 2.3a. Brand ranking by Health and Beauty
Page 29
Table 2.3b. Brand ranking by Family care
Page 31
Table 2.3c. Brand ranking by Foods
Page 33
Table 2.3d. Brand ranking by Beverages
Page 35
Table 2.3e. Brand ranking by Diary and Dairy products
Page 37
Table 3.3.2b Relationship between the hypothesis and the customers‟ decision
to choose consumer goods brands
Page 78
Table 3.4. The list of urban and suburbs has been investigated
Page 79
Table 3.5.1. Scale of Quality Value
Page 81
Table 3.5.2. Scale of Price Value
Page 81
Table 3.5.3. Scale of Social Value
Page 82
Table 3.5.4. Scale of Emotional Value
Page 82
Table 3.5.5. Scale of Personnel Value
Page 83
BACHELOR THESIS
NGUYEN TRAN MAI VY
10
Table 3.5.6. Scale of Distribution Density
Page 83
Table 3.5.7. Scale of customer‟s purchasing decision to consumer goods brand
Page 84
Table 4.2.1a. Reliability Statistics of Quality Value (QV)
Page 92
Table 4.2.1b. Item-Total Statistics of Quality Value (QV)
Page 92
Table 4.2.2a. Reliability Statistics of Price Value (PCV)
Page 93
Table 4.2.2b. Item-Total Statistics of Price Value (PCV)
Page 93
Table 4.2.3a. Reliability Statistics of Social Value (SV)
Page 94
Table 4.2.3b. Item-Total Statistics of Social Value (SV)
Page 94
Table 4.2.4a. Reliability Statistics of Emotional Value (EV)
Page 95
Table 4.2.4b. Item-Total Statistics of Emotional Value (EV)
Page 95
Table 4.2.5a. Reliability Statistics of Personnel Value (PV)
Page 96
Table 4.2.5b. Item-Total Statistics of Personnel Value (PV)
Page 96
Table 4.2.6a. Reliability Statistics of Distribution Density (DD)
Page 97
Table 4.2.6b. Item-Total Statistics of Distribution Density (DD)
Page 97
Table 4.2.7a. Reliability Statistics of Customer‟s decision (CD)
Page 98
Table 4.2.7b. Item-Total Statistics of Customer‟s decision (CD)
Page 98
Table 4.3.1a. KMO and Bartlett‟s Test
Page 99
Table 4.3.1b. Total Variance Explained
Page 100
Table 4.3.1c. Rotated Component Matrix
Page 101
Table 4.3.2a. KMO and Bartlett‟s Test
Page 102
Table 4.3.2b. Total Variance Explained
Page 102
BACHELOR THESIS
NGUYEN TRAN MAI VY
11
Table 4.5a. Model Summary
Page 106
Table 4.5b. ANOVA Analysis
Page 107
Table 4.5c. Linear Regression Result
Page 108
Table 4.6.1a. Compare differences in gender
Page 109
Table 4.6.1b. ANOVA Comparing Differences by Gender
Page 110
Table 4.6.2a. Compare differences in age
Page 111
Table 4.6.2b. ANOVA Comparing Differences by Age
Page 112
Table 4.6.3a. Compare differences in educational level
Page 113
Table 4.6.3b. ANOVA Comparing Differences by educational level Page 114
Table 4.6.4a. Compare differences in income
Page 115
Table 4.6.4b. ANOVA Comparing Differences by income
Page 116
Table 4.6.5a. Compare differences in Residence
Page 117
Table 4.6.4b. ANOVA Comparing Differences by Residence
Page 118
FIGURES:
Model 2.5. The stages of customer concept
Page 47
Figure 2.6. Consumer Behaviors Model
Page 50
Figure 2.7.1. Buyer‟s Decision Progress Model
Page 51
Figure 2.8a. Sweeney and Soutar‟s customer perceived value measurement models
Page 59
Figure 2.8b. Sanchez et al.‟s customer perceived value measurement models
Page 61
Figure 2.8c. Five values affecting customer‟s choice behaviors
Page 62
Figure 2.8d. Affecting of perceived value on customer‟s purchasing decision –
Research‟s Chang & Hsiao
Page 63
Figure 2.9. Proposed Research Model (Theoretical Model)
Page 65
BACHELOR THESIS
NGUYEN TRAN MAI VY
12
Chart 3.2. Research Design
Page 69
Figure 3.5. Proposed Research Model (Official Model)
Page 80
Chart 4.1a. Statistics by gender
Page 89
Chart 4.1b. Statistics by age
Page 90
Chart 4.1c. Statistics by education level
Page 90
Chart 4.1d. Statistics by income
Page 91
Chart 4.1e. Statistics by residence
Page 91
BACHELOR THESIS
NGUYEN TRAN MAI VY
13
CHAPTER I. INTRODUCTION
1.1. The urgency of the research:
Prior to the global economic integration trend, Vietnamese businesses paid
more attention to establishing and developing their brand. Business owners
understand the importance and value of the brand for competitiveness in the market.
Brand is no longer just a sign to identify and distinguish the product of this
business towards other businesses, but much higher, is very valuable assets, is the
prestige of the business and expressed the belief of consumers of the business‟s
product. Building a brand is not just about putting a name on it and signing up for
that, it's a synthesis of activities to create a "clear and distinct" image of the
enterprise. (Haskins, 2015)
Brands are now paying attention by many businesses, even small and
medium enterprises. The brand is a vital factor for businesses, especially in the
context of deepening international and regional integration. Brand is considered as
an intangible asset, very valuable of the business. (Laura, 2018)
A brand is a sign that a consumer chooses the goods and services of the
business in a variety of other goods. Brand name contributes to maintaining and
expanding the market for businesses, improving commercial civilization and
preventing unfair competition among enterprises. In the trend of internationalization
and globalization of economic life, with the harsh competition conditions at present,
Vietnamese businesses in general and Ho Chi Minh City businesses in particular,
must build their own and good brands. Only building brand, business is not afraid of
being slammed on the yard as well as when entering the world market. ( Laura,
2018)
First of all, through the brand, consumers are more confident, more
reassuring and have the desire to select and purchase products and services of
enterprises. Brand building is to build credibility of the business for consumers.
BACHELOR THESIS
NGUYEN TRAN MAI VY
14
A successful brand, known and loved by consumers will bring great benefits
to the business. The value of a brand is the profit outlook that the brand brings to
the business in the present and in the future.
In addition, when having the famous brand, investors are not afraid to invest
in business. Business partners will also be willing to cooperate with business,
supplying raw materials and goods to the business. Brands are always intangible
and valuable assets of the business. These things have prompted Vietnamese
enterprises, even small and medium enterprises in building and developing the
brand. Branding is not just about getting your target market to select you over the
competition. It's also about getting your prospects to see you as the sole provider of
a solution to their problem or need. In its essence, branding is a problem-solver.
(Laura, 2018)
It can be said that: "Branding is a long way for Vietnamese businesses”.
BACHELOR THESIS
NGUYEN TRAN MAI VY
15
In fact, there are quite few researches, papers, and evaluations mention about
customer‟s purchasing decision for brands, typically the research “Consumer
Purchasing Decision for Fashion Luxury Brands in Dubai: The Case of Armani” of
02 authors Mohammad Obeidat and W. Daniel Young from American University in
Dubai. This paper aims to analyze consumer preference for fashion luxury brands,
the effect of the branded items on the status of people in Dubai, the shopping
culture in Dubai, the cultural factors that affect the purchasing behavior of the
consumers and most importantly the factors that have an impact on purchasing
decision of the consumers in choosing fashion luxury brands. Mixed methods of
research discussed in the research model „Onion‟ are used for the study. The data is
collected in two steps using interview technique and through survey questionnaire.
Interview of 25 consumers brought out 4 factors (price, quality, loyalty and
customer service) that impact the purchasing decision on the brand. Based on this, a
structured questionnaire was designed and placed on the website „survey monkey‟.
Total of 129 responses were received and analysis was carried out with the help of
SPSS. Results showed that all the four factors influence the consumer‟s decision in
choosing a brand. The case of the famous brand „Armani‟ has also been studied and
suggestions made for improving its strategy for future.
The small limitation of the topic is that due to limited time, the author has
chosen quite few interviewees with little samples of N = 129.
BACHELOR THESIS
NGUYEN TRAN MAI VY
16
However, there is no research about the factors affecting customer‟s
purchasing decision for consumer goods brand until now. Thanks to this research,
the researcher believes that, it will somehow contribute to the Ho Chi Minh City
entrepreneur‟s decisions of making their consumer goods brand strategies
effectively and sustainably. Building a strong brand name can increase the
competitive position between enterprises producing consumer goods and is the key
to its development and sustainability.
Furthermore, this research can help orientate enterprise marketing
proficiency. Entrepreneurs, R&D or Marketing managers can make their
recommendations about managing their business and future plans by establishing a
famous and reliable brand that not only express exactly their corporate culture, but
also attract customers.
That‟s the reason why the researcher choose the topic: “Factors affecting
customer‟s purchasing decision for consumer goods brands in Ho Chi Minh City in
the integration competition” to investigate and evaluate with the desire to contribute
a small part to the economy and the direction of consumer goods brands in the
future.
BACHELOR THESIS
NGUYEN TRAN MAI VY
17
1.2. Purpose and target of the research:
1.2.1. Purpose:
-
Identify the factors affecting customer‟s purchasing decision for consumer
goods brands in Ho Chi Minh City in the integration competition.
-
Determine the priority order of the impact level these factors affecting
customer‟s purchasing decision for consumer goods brands in Ho Chi Minh
City in the integration competition.
-
Propose solutions to improve consumer goods brands in Ho Chi Minh City in
the integration competition and to promote the brand for developing business
in particular, and the consumer goods industry in general.
1.2.2. Target:
-
Measure the level of consumer goods industry in Ho Chi Minh City today.
-
Find out and measure the factors that affect customer‟s purchasing decision
for consumer goods brands in Ho Chi Minh City.
-
Understand the brand value of Vietnamese enterprises producing consumer
goods.
-
Learn how to build and develop an effective brand.
1.3. Object and scope of the research:
1.3.1. Object of study:
-
R&D managers and Marketing managers of enterprises producing consumer
goods in Ho Chi Minh City.
-
People using consumer goods in Ho Chi Minh City.
1.3.2. Scope of study:
Ho Chi Minh City.
BACHELOR THESIS
NGUYEN TRAN MAI VY
18
CHAPTER II. LITERATURE REVIEW
& REVIEW RESEARCH MODELS
2.1. Overview of the brand:
2.1.1. History of the brand: (Matt, 2014)
Before the 1980s, the brand concept was completely alien to the business
world as well as to business valuation experts. They look at the assets of the
business as tangible objects such as factories, machines, equipment, etc.
In the 1980s, after a series of mergers, people began to realize the "brand" is
a worthwhile asset. This is evidenced by the transaction prices of mergers and
acquisitions on the market at that time: Nestle Group bought Rowntree at a price
three times the value of the Company on the stock market and 26 times for the
company‟s profit; the Builton Group is sold for 35 times its profit.
Since then, the process of brand valuation has become more evident. So far,
the existence of brand value in the business world is indispensable. Administrators
as well as experts have acknowledged that the power of the company does not
simply contain processing methods, formulas or technological processes, but also
the way people want to use them. That is "Brand". (Brian, 2016)
BACHELOR THESIS
NGUYEN TRAN MAI VY
19
2.1.2. Definition of the brand:
Any big or small business has a name or a logo, which is the brand of the
business. A brand is a special (visible and invisible) sign that identifies a product or
service that is produced, or provided by an individual or organization (World
Intellectual Property Organization (WIPO)).
According to Philip Kotler, brand may be construed as names, terms,
symbols, drawings or combinations used to endorse the seller's product and to
distinguish it from the other competitors. It is also intangible and priceless assets of
the enterprise (Kotler, 2011). That means it is the proprietary visual, emotional,
rational and cultural image that you associate with a company or a product (David,
1995). The brand is also a trusted promise of Quality, Service and Value,
established over time and proven by the test of operated use and satisfaction (Jack,
1995).
2.1.3. Component of the brand:
Branding is a set of components with the aim of providing both functional
and psychological benefits to the target consumer. As such, the brand may include
the following components:
Functional Component:
This component is intended to provide the functional benefits of the brand to
the target customer. It is a product, including functional attributes such as product
usability, product quality, and additional features.
Emotional Component:
This component includes symbolic value elements that give target customers
psychological benefits. These factors may be brand personality, symbol, or value
proposition, or USP (unique selling proposition), country of origin, domestic or
international company, etc.
BACHELOR THESIS
NGUYEN TRAN MAI VY
20
2.1.4. Scale of the brand:
Below is an example of the brand scale, which contributes a small part to
setting up survey questionnaires and identifying observation variables of this
research.
There are two scales which were public by Lacoeuilhe and Thomson and his
partner in 2000 and 2005 respectively:
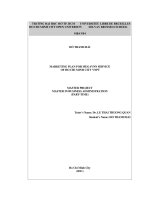
Scale of Lacoeuilhe (2000):
The scale of Lacoeuilhe (2000) is built based on Churchill's process in 1979.
After qualitative research towards consumers, the author has found 40 observed
variables. After the discussion with three experts about brand, only 25 observed
variables are retained. To filter and evaluate the scale, the author has done
Exploratory Factor Analysis (EFA) with 120 customers, both male and female, and
Confirmatory Factor Analysis (CFA) with 311 female customers.
Result of exploratory factor analysis retained 5 observed variables which
converge into one factor and gain the total deviation of 56.8%. Measuring scale
achieves high reliability with Cronbach's Alpha at 0.83 and the Joreskog value is
0.89. Factor analysis result affirms the scale suitable with market research data. The
scale is checked to be distinguished with: brand sensitivity, and risk of feeling
BACHELOR THESIS
NGUYEN TRAN MAI VY
21
I have a lot of love with this brand (GK1)
Buying products of this brand bring me so much joy and satisfaction (GK2)
I feel secure when buying products of this brand (GK3)
I have a strong attachment to this brand (GK4)
I am very attracted by this brand (GK5)
1- Absolutely Disagree
7 – Absolutely Agree
Table 2.1.4a. Scale of Lacoeuilhe (2000)
BACHELOR THESIS
NGUYEN TRAN MAI VY
22
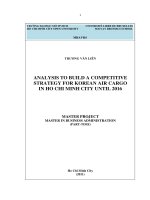
Scale of Thomson and partner (2005):
To determine the observed variables, Thomson and his partner conducted the
qualitative survey with 68 university students. The questionnaire consisted of 39
adjectives. Students are asked to rate accuracy adjectives that show the match of
them with the brand they choose.
A scale of 7 points from 1 “Absolutely not correct” to 7 “Absolutely correct”
is used. As a result, there are only adjectives which have the average score of 4 or
more are retained. Then list of 35 adjectives have been used for the next step. To
sort out the scale, Thomson and partner conducted the survey with 120 university
students. Students are asked to think about a brand that they have strong feeling to,
and determine which adjectives express most of their emotions, using a scale of 7
points (from 1 “Absolutely not correct” to 7 “Absolutely correct”).
Adjectives have the average score under 3.5 and deviation less than 1.5 are
eliminated. Similarly, adjectives, which are not rated by more than 10% of
participants, are also eliminated. As a result, 10 adjectives represent for 10 observed
variables were took to further analyze. The result shows that 10 adjectives are
divided into three factors, named: Affection, Passion, and Connection. Affection
expresses love and emotions that a customer gives for a brand. Passion expresses
the passionate of a customer towards a brand. Connection expresses the harmony in
feeling, and the relationship between customers and the brand. The scale achieves
high reliability with Cronbach's Alpha = 0.77.
Because of multi-factor scale, designing from qualitative method, and being
limited about theory, the authors used the second level model (CFA second order)
to test the factors. The results show that the scale is suitable with the market
research data. The scale is checked to be distinguished with: positive attitude, and
satisfaction.
BACHELOR THESIS
NGUYEN TRAN MAI VY
23
Affectionate (A1)
Affection
Friendly (A2)
Loved (A3)
Peaceful (A4)
Passionate (P1)
Passion
Delighted (P2)
Enthralled (P3)
Connected (C1)
Connection
Linked (C2)
Attached (C3)
1 - Absolutely not correct
7 – Absolutely correct
Table 2.1.4b. Scale of Thomson and partner (2005)
BACHELOR THESIS
NGUYEN TRAN MAI VY
24
Statistics that describe the research sample when comparing two scales:
Stage Stage
Feature
1
2
14,95
10,15
%
%
Civil
22,89
17,61
Servant
%
%
Office
30,37
48,66
Worker
%
%
28,66
Shopkeeper/
22,44
13,73
%
%
Manager
%
%
High
15,89
21,49
4,21
1,49
School
%
%
%
%
19,16
34,33
5,14
8,36
%
%
%
%
55,14
37,61
%
%
Post
9,81
6,57
Graduate
%
%
Male
1
2
44,86
45,97
%
%
55,14
54,03
%
%
54,21
71,34
%
%
45,79
Worker/
Manual
Worker
Female
23 – 35
Age
36 – 50
College
level
University
Occupation
Gender
Education
Stage Stage
Feature
Farmer
Others
Table 2.1.4c. Research sample statistics
BACHELOR THESIS
NGUYEN TRAN MAI VY
25
2.2. Overview of the consumer goods industry in Vietnam:
By the third largest population in Southeast Asia, nearly 70% of the workingage population (16- 60 years old), Vietnam is a major market for Consumer Goods
industry. The progress of international economic integration has become
increasingly widespread and income per capita has been improved, driving the
consumer goods to develop.
In the period of 2010 - 2014, Vietnam's economy has a high and stable
growth rate (around 5-7% per year), which leads to a stable growth of consumer.
In the period of 2014-2015, the beverage segment continued to grow at 38%
in total sales of the whole Consumer Goods sector and achieved the highest growth
rate of 6.7%. The development of beverage products mainly comes from beer,
energy drink and beverage. Milk and dairy products are increased by 12% in urban
areas and 20% in rural areas. In contrast to the beverage product market, the market
for the remaining product groups still faces many difficulties, especially for
household care items such as detergents, packaged foods, etc.
Total sales of consumer goods sectors in Vietnam are projected to increase to
$ 140 billion by 2016. This is a great opportunity for consumer goods firms in
production, market expansion, seeking growth opportunities.
The Brand Footprint board is based on consumer behavior rather than the
taste or attitude of the brand as in other rankings. The rankings are based on
the Consumer Reach Points (CRPs). This is an innovative scale to measure how
many households in the world have chosen to buy a brand (the percentage of
households buying) and the frequency of purchase (frequency of purchase). This
measure is the true representation of the choice of consumers.
BACHELOR THESIS
NGUYEN TRAN MAI VY