Để đạt được mục tiêu tối đa hoá giá trị doanh nghiệp thì cấu trúc vốn của ngành điện niêm yết Việt Nam nên điều chỉnh như thế nào
Bạn đang xem bản rút gọn của tài liệu. Xem và tải ngay bản đầy đủ của tài liệu tại đây (327.14 KB, 10 trang )
INTERNATIONAL CONFERENCE FOR YOUNG RESEARCHERS IN ECONOMICS & BUSINESS 2020
ICYREB 2020
HOW THE CAPITAL STRUCTURE OF LISTED ELECTRICITY
INDUSTRY SHOULD BE IMPROVED FOR REACHING
MAXIMIZATION OF FIRMS’ VALUE?
ĐỂ ĐẠT ĐƯỢC MỤC TIÊU TỐI ĐA HỐ GIÁ TRỊ DOANH NGHIỆP
THÌ CẤU TRÚC VỐN CỦA NGÀNH ĐIỆN NIÊM YẾT VIỆT NAM
NÊN ĐIỀU CHỈNH NHƯ THẾ NÀO?
Assoc., Prof.Dr. Truong Thi Thuy - Dr. Hoang Trung Duc
Academy of Finance
;
Abstract
The decision of capital structure plays significant role in the maximization of firms value
due to its’ influence on financial risks, return on equity, cost of capital. Vietnam listed industry,
the sector with a strategic position for the nation’s development has been faced with some of is-
sues consisting of financial leverage ineffective, risks of exchange rate with foreign loans, lack
of diversification in capital mobilization, no optimal capital structure constructed. From the men-
tioned reasons, the authors from Academy of Finance, Ha Noi choose the article “How should
the capital structure of listed electricity industry be improved for reaching maximization of firms’
value?” for the purpose of finding solutions to complete capital structure of listed electricity in-
dustry and construct optimal capital structure to maximize firms value.
Keyword: Academy of Finance, Capital structure, Listed electricity industry.
Tóm tắt
Quyết định về cấu trúc vốn đóng vai trị quan trọng trong việc tối đa hóa giá trị doanh
nghiệp do ảnh hưởng của nó đến rủi ro tài chính, tỷ suất sinh lợi trên vốn chủ sở hữu, chi phí sử
dụng vốn. Ngành niêm yết Việt Nam, ngành có vị trí chiến lược đối với sự phát triển của đất nước
đang gặp phải một số vấn đề như đòn bẩy tài chính kém hiệu quả, rủi ro tỷ giá với vốn vay nước
ngoài, huy động vốn thiếu đa dạng, cơ cấu vốn chưa tối ưu. Từ những nguyên nhân đã nêu, nhóm
tác giả Học viện Tài chính Hà Nội chọn bài viết “Cải thiện cơ cấu vốn ngành điện niêm yết như
thế nào để đạt tối đa hóa giá trị doanh nghiệp?” nhằm tìm ra giải pháp hồn thiện cơ cấu vốn
của ngành điện niêm yết và xây dựng cơ cấu vốn tối ưu nhằm tối đa hóa giá trị doanh nghiệp.
Từ khóa: Học viện Tài chính, Cơ cấu vốn, Niêm yết ngành điện.
The differnet pointviews of capital structure and the authors attitude
Currently, in scientific research projects, there are still different views on the capital struc-
ture and those difference refer to whether or not short-term debt should be an integral part of the
capital structure.
1005
INTERNATIONAL CONFERENCE FOR YOUNG RESEARCHERS IN ECONOMICS & BUSINESS 2020
ICYREB 2020
According to Ing. Petr Jiricek, Mgr. Zdenka Dostalova: “The capital structure of enter-
prises is distinguished from the financial structure of businesses. The main difference is that the
capital structure is concerned only with long-term capital, while the financial structure is con-
cerned with both short-term capital and long-term capital. ”
According to Tran Thi Thanh Tu (2006):” The capital structure is a proportional relation-
ship between long-term debt and equity.”
According to Ing. Petr Jiricek, Mgr. Zdenka Dostalovam, Tran Thanh Tu: short-term debts
refer to temporary nature, not long- term nature, should not affect the right management and su-
pervision of financial activities’ business. In addition, short term debts have not been influenced
significantly by inside and outside firms’ factors, mainly used to meet the needs of working capital
and with low cost of capital, short-term debts don’t meet the target of setting strategy of capital
mobilization for the maximization of firms’ value.
According to Klayman (1994), Stephen A. Ross, Randolph W. Chesterfield, Bradford D.
Jordan (2008): “The capital structure is the combination of liabilities and equity that an enterprise
uses to finance the assets with the aim of maximizing enterprise value ”
According to Doan Huong Quynh (2010): “ The capital structure is the proportion of cap-
ital sources in the total value of capital resources which enterprises mobilize for the businesses’
activities and capital structure is assessed by debt ratio, equity ratio ”
According to the pointviews of Klayman, Stephen A.Ross and Doan Huong Quynh: Viet-
nam capital market has been gradually improved, short-term debt still has been played an impor-
tant role in business activities: short-term debt are supplemented regularly to meet the needs of
regular working capital, payment of principal and interest of long-term debts. Therefore, short-
term debts contain similar characteristics to long-term debts and have the purpose of capital mo-
bilization plans’ construction.
From the mentioned research, the authors give owns attitude on capital structure: “The
capital structure of business refer to the correlation ratio between short-term debts, long term
debt and equity that enterprises mobilize for the use of production with the aim of maximization
of firms’ value”
Features of listed electricity industry in term of businesses’ activities:
- Vietnam’s listed electricity industry is considered as one of the attractive industries with
high growth prospects, attracting large domestic and foreign investment .The listed electricity
industry has a high transparency index .
- Large structure of investment in long-term assets from total capital of listed electricity
industry. The input factors of listed electricity industry depend largely on natural conditions with
an increasingly difficult trend
- The output products of listed electricity industry are of strategic materials directly affect1006
INTERNATIONAL CONFERENCE FOR YOUNG RESEARCHERS IN ECONOMICS & BUSINESS 2020
ICYREB 2020
ing the socio-economic development and national securities. The production process of electrical
products is highly concentrated.
The current situation of capital structure of listed electricity industry
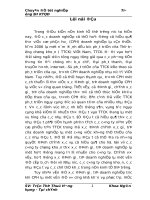
Figure 1 shows that the debt tends to decrease , the equity tends to increase gradually during
the research period. The debt decreased from 23,342,650 million VND in 2012 to 7,977,720
million VND in 2014, maintaining a stable level of 18,082,910 million VND during 2014-2016
and sharply decreasing to 10,014,094 million VND in 2017. The quity increased from 17,289,350
million VND in 2012 to 22,224,119 million VND in 2014 and remained stable at an average of
22,712,456 million VND during the period 2014-2017. The debt ratio decreased from 57.54% in
2012 to 44.72% in 2014, remained stable at 44.40% in the period of 2014 - 2016 and decreased
to 30.40% in 2017.
(Source: Authors’ synthesized from financial statements of listed electricity industry)
Figure 1: Capital structure of the listed electricity industry
The current situation of debt structure of listed electricity industry
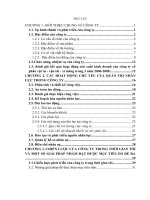
The Figure 2 shows that total debt is tending to decrease, short-term debt is stable and
the decline of long-term debt is mainly due to the decline of total debt, the average long-term
debt during period 2012-2017 is accounted for 86.62% of the total debt. The long-term debts
have been decreased sharply in the period of 2012-2014 (decreased from 20,176,758 million
VND to VND 15,505,200 million VND), remained stable in the period of 2014-2016 (15,558,995
million VND), plummeted to 10,014,094 million VND in 2017.
1007
INTERNATIONAL CONFERENCE FOR YOUNG RESEARCHERS IN ECONOMICS & BUSINESS 2020
ICYREB 2020
(Source: Authors’ synthesized from financial statements of listed electricity industry )
Figure 2: The current situation of debt structure of listed electricity industry
The current situation of equity structure of listed electricity industry
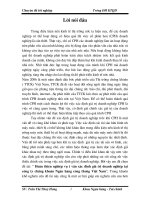
Figure 3 shows the stable size of paid-in capital, slightly increasing from 13,957,318 million VND in 2012 to 14,985,619 million VND in 2017; retained earnings have been risen sharply
in the period 2012-2014 from 3,099,269 million VND to 7,711,803 million VND, stabilizing at
the average level of 7,953,296 million VND in the period 2015-2017.
(Source: Authors’ synthesized from financial statements of listed electricity industry )
Fiugre 3: The current situation of equity structure of listed electricity industry
From above analysis, estimation and evaluation of the current situation of capital structure, debt structure, equity structure of listed electricity industry, the authors have reached some
important conclusions as follows:
1008
INTERNATIONAL CONFERENCE FOR YOUNG RESEARCHERS IN ECONOMICS & BUSINESS 2020
ICYREB 2020
Firstly, the debt of listed electricity industry has been decreasing, the equity tends to increase sharply. This will help listed electricity industry minimize the risk of insolvency, thereby
reducing bankruptcy costs, reducing large costs and increasing financial flexibility in the future;
but reducing the debt has caused the following disadvantages: reduction of the “tax savings” for
businesses, reducing the pressure for the board to operate more efficiently , minimizing the amplification of return on equity.
Secondly, long-term debts from foreign sources have a very low-interest rate, accounting
for a large proportion of the debt will reduce the cost of capital . Long - term debts of listed electricity industry have largely from concessional loans which have been guaranteed by Vietnam
Government (approximately 0.04%/ year to 4% / year) will have benefit of reducing the WACC
of enterprieses.
Thirdly, long term debt of listed electricity industry lacks diversity. Long-tern debts of
listed electricity industry mainly came fromdebt from commercial banks, debt from foreign
sources which will cause risks for businesses if creditors claim to recover capital early for economic - political reasons, and do not create motivation for enterprises to self-help. However, long
term debt of the electricity industry enterprises listed exchange rate risk affecting the operational
efficiency of enterprises.
Fourthly, retained earnings tend to increase, helping to increase the level of financial independence. The theory of pecking-order in capital structure mentioned that the retained earnings
convey a very positive signal to investors in the stock market about the financial situation and
production capacity.
How to construct optimal capital structure for the purpose of maximization of firm value?
Introduction of Cost-of-Capital Approach to construct optimal capital structure
The cost-of-capital (COC) approach helps with construction of optimal capital structure
and contains 3 main steps:
First, Estimation of the cost of debt in each debt ratio, the cost of debt in each debt ratio
is constructed based on the credit rating system.
Second, Estimation of the cost of equity in each debt ratio, the cost of equity in each debt
ration is constructed by the estimation of beta when fully funded by equity (βU);then, this task
is followed by the estimation of the beta when debt was used (βL). The application of CAPM
model for the estimation of cost of equity at each debt ration is performed.
Third, Estimation of the average cost of capital used for each debt ration for the determination of the optimal debt ratio. This formula is used for the estimation of average cost of capital
used in each debt ration. Hence, the optimal debt ratio is the minimal average cost of capital
Application of COC for constructing optimal capital structure of Nhon Trach 2 Petroleum
Joint Stock Company – (NT2)
Determination of elements/factors in the model:
- Determination of Risk-free rate (Rf): Risk-free rate is determined by rate of 10-year Government bond issued by National Treasury in 2017. Risk-free interest rate is 5.38% per year.
1009
INTERNATIONAL CONFERENCE FOR YOUNG RESEARCHERS IN ECONOMICS & BUSINESS 2020
ICYREB 2020
- Determination of Equity Risk Preminum (ERP): Equity Risk Premium is determined by
the differential parts between the rate of return of the market portfolio and the risk-free market.
ERP is the basic foundation for the decision of the cost of equity and weighted average cost of
capital. ERP reflects the degree to which risk is offset by the fact that investments in equity assets
have a higher level of risk than investment in non-riskier assets such as government bonds. If the
level of risk compensation is not large enough to meet the expectations of investors, investment
decisions will not be made. The author collects data on the risk premium from Prof. Aswath
Damodaran’s calculations. The results show that the ERP of Vietnam in 2017 is 10.27%.
- Determining the capital structure of Nhon Trach Thermal Power Joint Stock Company at
market price: The structure of capital at market price reflects the level and proportion of each
source of capital (debt, equity) according to market value. For the determinantion of the capital
structure at market prices, the market value of debt is determined based on book value and market
value of equity determined by the number of shares held. at the end of 2017 multiplied by the
closing price of that stock at the end of 2017.
Table 1.1: Capital structure of NT2 by market value in 2017
Capital structure
The volume of stock
in circulation
Closing price of NT2 at the Market Value
end of the year (VND)
(Trillion dong)
Propotion
Short-term Debt
1.066.152
Total Debt (D)
4.763.924
Long-term Debt
Equity (E)
Total Capital
2.631.620
287.876.000
D/E
31,39
9.026.428
13.790.352
0,5277
34,55%
65,45%
52,77%
(Source: Author’s estimatios from financial statements of JSCs)
- Determination of enterprise income tax rate: The enterprise income tax rate applicable to
NT2 is 20%.
- Determine the beta coefficient of the stock NT2: The beta coefficient of the stock NT2
collected by the author (source) is 0.47. Beta without financial leverage is determined by the following formula: βU = βL / {[1+(1-Tc)]*D/E} = 0,47/{[1+(1-20%)]*52,77%} = 0,33
Determine the cost of equity using the different capital structures
- Leverage factor leverage (βL): determined by the following formula: βL = βU * [1+(1Tc)*D/E]
- Cost of equity (Re): determined according to the following formula under CAPM asset
pricing model: Re = Rf + βL* (Rm-Rf) = Rf + βL*ERP
1010
INTERNATIONAL CONFERENCE FOR YOUNG RESEARCHERS IN ECONOMICS & BUSINESS 2020
ICYREB 2020
Table 1.2: Cost of Equity atthe level of capital structure
Debt ratio Total capital
0%
13.790.352
15%
13.790.352
10%
20%
25%
30%
34,55%
35%
40%
45%
50%
55%
60%
65%
70%
75%
80%
85%
90%
95%
100%
Debt
-
Equity
13.790.352
13.790.352
1.379.035,2 12.411.316,8
13.790.352
2.758.070,4 11.032.281,6
13.790.352
2.068.552,8 11.721.799,2
3.447.588
10.342.764
13.790.352
4.137.105,6 9.653.246,4
13.790.352
4.826.623,2 8.963.728,8
13.790.352
13.790.352
13.790.352
13.790.352
6.895.176
13.790.352
8.963.728,8 4.826.623,2
13.790.352
10.342.764
8.274.211,2 5.516.140,8
9.653.246,6 4.137.105,4
3.447.588
13.790.352 11.032.281,6 2.758.070,4
13.790.352 11.721.799,2 2.068.552,8
13.790.352 12.411.316,8 1.379.035,2
13.790.352 13.100.834,4
13.790.352
0,18
0,38
10,11%
0,11
0,25
0,33
0,43
0,66
7.584.693,6 6.205.658,4
13.790.352
9,51%
5.516.140,8 8.274.211,2
6.895.176
13.790.352
689.517,6
-
Re
0,33
0,527
6.205.658,4 7.584.693,6
βL
0
4.764.566,6 9.025.785,4
13.790.352
13.790.352
D/E
0,53
0,81
1,00
1,22
1,5
1,85
2,33
3
4
5,66
9
19
-
0,36
9,88%
0,40
10,35%
0,44
10,95%
0,42
10,62%
0,47
11,28%
0,50
11,72%
0,47
0,36
11,29%
9,85%
0,59
12,86%
0,73
14,54%
0,65
0,82
0,95
1,12
1,39
1,82
2,71
5,35
-
13,60%
15,71%
17,32%
19,57%
22,92%
28,49%
39,69%
73,21%
-
(Source: Author’s estimatios from financial statements of JSCs)
Determine the cost of debt at different levels of capital structure
To determine the cost of debt use at different levels of capital structure, the author collected
data on rankings to determine the bankruptcy risk premium of Professor Aswath Damodaran.
The rating is based on the solvency of non-financial corporations with a market capitalization of
more than $ 5 billion and less than $ 5 billion. Table 1.3 describes the bankruptcy risk rating of
Prof. Aswath Damodaran.
1011
INTERNATIONAL CONFERENCE FOR YOUNG RESEARCHERS IN ECONOMICS & BUSINESS 2020
ICYREB 2020
Table 1.3: Bankruptcy Risk Rating Chart of Professor Aswath Damodaran
Source:
The authors of this rating system for Nhon Trach Thermal Power Joint Stock Company
- NT2 will be suitable for market capitalization of less than US $ 5 billion. The solvency ratio is
measured by taking pre-tax profit and interest divided by the amount of interest payable. Pretax
profit and interest of NT2 in 2017 is 853,439 million dong; The average lending rate in Vietnam
in 2017 is 6.25% [29]. The cost of using debt at different levels of capital structure is shown in
the following table:
Table 1.4: Cost of debt use at different levels of capital structure
Debt
ratio
Total
capital
Debt
0%
13.790.352
15%
13.790.352 2.068.552,8 129.284,55
10%
20%
25%
30%
-
Amount of Interst cov- Credit ratloan interst erage ratio
ing
13.790.352 1.379.035,2
Rd
Rdt
9.90
AA
0.70%
5,38% 6,08% 4,86%
13.790.352 2.758.070,4 172.379,40
4.95
A-
1.20%
5,38% 6,58% 5,26%
13.790.352
3.447.588
215.474,25
13.790.352 4.137.105,6 258.569,10
35%
13.790.352 4.826.623,2 301.663,95
45%
13.790.352 6.205.658,4 387.853,65
50%
Rf
86.189,70
34,55% 13.790.352 4.764.566,6 297.785,41
40%
ERP
13.790.352 5.516.140,8 344.758,80
13.790.352
6.895.176
430.948,50
6.60
AA
1.00%
3.96
BB+
2.87
B+
4.00%
B
5.00%
3.30
2.83
2.48
2.20
1.98
1012
BB
B+
B
B-
2.75%
3.25%
4.00%
5.00%
6.00%
5,38% 6,38% 5,10%
5,38% 8,13% 6,50%
5,38% 8,63% 6,90%
5,38% 9,38% 7,50%
5,38% 9,38% 7,50%
5,38% 10,38% 8,30%
5,38% 10,38% 8,30%
5,38% 11,38% 9,10%
INTERNATIONAL CONFERENCE FOR YOUNG RESEARCHERS IN ECONOMICS & BUSINESS 2020
ICYREB 2020
55%
13.790.352 7.584.693,6 474.043,35
1.80
B-
6.00%
5,38% 11,38% 9,10%
65%
13.790.352 8.963.728,8 560.233,05
1.52
B-
6.00%
5,38% 11,38% 9,10%
60%
70%
75%
80%
85%
90%
95%
100%
13.790.352 8.274.211,2 517.138,20
13.790.352 9.653.246,6 603.327,90
13.790.352 10.342.764 646.422,75
13.790.352 11.032.281,6 689.517,60
13.790.352 11.721.799,2 732.612,45
13.790.352 12.411.316,8 775.707,30
13.790.352 13.100.834,4 818.802,15
13.790.352 13.790.352
861.897
1.65
B-
1.41
CCC
1.24
CCC
1.32
1.16
1.10
1.04
0.99
CCC
CC
CC
CC
CC
6.00%
7%
7%
7%
8%
8%
8%
8%
5,38% 11,38% 9,10%
5,38% 12,38% 9,90%
5,38% 12,38% 9,90%
5,38% 12,38% 9,90%
5,38% 13,38% 10,70%
5,38% 13,38% 10,70%
5,38% 13,38% 10,70%
-
(Source: Author’s estimatios from financial statements of JSCs)
- Determination of optimal capial structure
WACC in particular capital structure was indicated in Table 1.5 in the following
demonstration
Debt ratio
0%
10%
15%
20%
25%
30%
34,55%
35%
40%
45%
50%
55%
60%
65%
70%
75%
80%
85%
90%
95%
100%
Table 1.5: Optimal capital strucutre of NT2
Equity ratio
100%
90%
85%
80%
75%
70%
65,45%
65%
60%
55%
50%
45%
40%
35%
30%
25%
20%
15%
10%
5%
0%
Rdt
4,86%
5,10%
5,26%
6,50%
6,90%
7,50%
7,50%
8,30%
8,30%
9,10%
9,10%
9,10%
9,10%
9,90%
9,90%
9,90%
10,70%
10,70%
10,70%
Re
9,51%
9,88%
10,11%
10,35%
10,62%
10,95%
11,28%
11,29%
11,72%
9,85%
12,86%
13,60%
14,54%
15,71%
17,32%
19,57%
22,92%
28,49%
39,69%
73,21%
-
WACC
9,51%
9,38%
9,36%
9,33%
9,59%
9,74%
9,97%
9,96%
10,35%
9,15%
10,98%
11,13%
11,28%
11,41%
12,13%
12,32%
12,50%
13,37%
13,60%
13,83%
-
(Source: Author’s estimatios from financial statements of JSCs)
1013
INTERNATIONAL CONFERENCE FOR YOUNG RESEARCHERS IN ECONOMICS & BUSINESS 2020
ICYREB 2020
The target capital structure is the level of capital structure that results in the lowest average
cost of capital (WACC). By setting the level of target capital structure for Nhon Trach 2 Petroleum
Electricity Joint Stock Company with the debt ratio ranging from 0% to 100%, the analysis shows
that the WACC has fluctuated from 9,15% to 13.83%. The lowest average cost is 9.15%, corresponding to the capital structure ratio of 45% for debt and 55% for equity. Thus, with the current
funding structure (34.55% of debt, 65.34% of equity), the WACC of 9.97% is not the level of the
target capital structure. Thus, through the formulation of target capital structure for NT2, it has
been recommended that NT2 be adjusted to 45% of debt and 55% of equity to minimize cost of
capital and maximize cost. corporate governance.
REFERENCES
1. M. Amidu (2007), “Determinants of capital structure of banks in Ghana: An empirical
approach”, Baltic Journal of Management. 2, tr. 67-69.
2. P Marsh (1982), “The Choice between Equity and Debt: An Empirical Study”, The Journal of Finance,, tr. 121-144.
3. Fauziah Mohamad Yunus Mazila Md-Yusuf, and Nur Zahraatul Lail Md Supaat (2013),
“Determinants of Capital Structure in Malaysia Electrical and Electronic Sector”, World Academy
of Science, Engineering and Technology International Journal of Economics and Management
Engineering. 7(6), tr. 1514.
4. K. Mazur (2007), “The determinants of capital structure choice: Evidence from Polish
companies”“, International Advances in Economic Research. 13, tr. 195-514.
5. Mutwiri (2015), The effect of capital structure decision on financial performance of
firms listed under energy and petroleum sector at the nairobi securities exchange., University of
Nairobi.
6. N. A. Sheikh and Z. Wang (2011), “Determinants of capital structure: An empirical study
of firms in manufacturing industry of Pakistan”, Managerial Finance. 37, tr. 117-133.
7. A. Mazhar and M. Nasr (2010), “Determinants of capital structure decisions case of Pakistani government owned and private firms”, International Review of Business Research Paper.
6, tr. 40-46.
8. 42. O. M and Emeni Ogbulu, F. K (2012), “Capital Structure and Firm Value: Empirical
Evidence from
9. Nigeria”, International Journal of Business and Social Science. 3(19), tr. 252-261.
10. Paul A. and Sipahioglu Phillips, Mehmet A (2004), “Performance implications of capital
structure: evidence from quoted UK organisations with hotel interests”, Service Industries Journal. 24(5), tr. 31-35.
1014