Dữ liệu thời tiết Tân Sơn Nhất Tp.HCM
Bạn đang xem bản rút gọn của tài liệu. Xem và tải ngay bản đầy đủ của tài liệu tại đây (93.17 KB, 2 trang )
10/2/2020
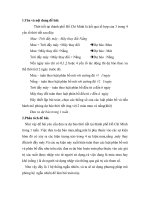
2017 ASHRAE Handbook - Foundamentals (SI)
HO CHI MINH TAN SON NHAT INTL, VIET NAM (WMO: 489000)
Lat:10.819N
Long:106.652E
Elev:10
StdP: 101.2
Time zone:7.00
Period:90-14 WBAN:99999
Annual Heating and Humidification Design Conditions
Humidification DP/MCDB and HR
Coldest month WS/MCDB MCWS/PCWD
Coldest Heating DB
to 99.6% DB
99.6%
99%
0.4%
1%
Month
99.6% 99%
DP
HR MCDB DP
HR MCDB WS MCDB WS MCDB MCWS PCWD
12
20.0
21.1
15.0
10.7
25.7
16.4
11.7
26.6
8.3
28.2
7.2
27.7
1.7
0
Annual Cooling, Dehumidification, and Enthalpy Design Conditions
Hottest
Cooling DB/MCWB
Evaporation WB/MCDB
MCWS/PCWD
Hottest Month
to 0.4% DB
0.4%
1%
2%
0.4%
1%
2%
Month DB
DB
MCWB DB MCWB DB MCWB WB MCDB WB MCDB WB MCDB MCWS PCWD
Range
4
8.7
35.6
25.8
34.8
25.8
34.0
25.7
28.0
31.7
27.6
31.3
27.3
31.0
4.1
160
DP
Dehumidification DP/MCDB and HR
0.4%
1%
HR MCDB
DP
HR MCDB DP
Enthalpy/MCDB
Extreme
2%
0.4%
1%
2%
Max
HR MCDB Enth MCDB Enth MCDB Enth MCDB WB
27.1
22.9
21.7
29.6
26.8
22.5
29.4
26.2
29.0
89.9
31.7
88.1
31.8
86.8
31.5
30.1
Extreme Annual Design Conditions
Extreme Annual WS
1%
2.5%
5%
9.6
7.7
6.5
DB
WB
Extreme Annual
Temperature
Standard
Mean
deviation
Min Max Min Max
Min
18.1
16.0
37.2
29.1
1.2
1.4
0.9
0.7
Monthly Climatic Design Conditions
Annual Jan Feb Mar Apr
DBAvg
28.2 26.9 27.9 29.2 30.1
DBStd
1.57 1.38 1.13 1.08 1.09
0
0
0
0
0
Temperatures, HDD10.0
0
0
0
0
0
Degree-Days HDD18.3
and Degree- CDD10.0 6639
523 501 596 604
Hours
CDD18.3 3598
264 267 337 354
CDH23.3 37115 2471 2676 3814 4330
CDH26.7 14903 954 1118 1691 2066
Wind
WSAvg
PrecAvg
PrecMax
Precipitation
PrecMin
PrecStd
Monthly
Design Dry
Bulb and
Mean
Coincident
Wet Bulb
Temperatures
0.4%
2%
5%
10%
n-Year Return Period Values of Extreme Temperature
n=5 years
n=10 years
n=20 years
n=50 years
Max
Min
Max
Min
Max
Min
Max
17.2
15.0
37.9
29.6
16.5
14.2
38.4
29.9
15.8
13.5
38.9
30.3
14.9
12.5
39.6
30.8
May
29.7
1.40
0
0
612
353
4127
1889
Jun
28.7
1.18
0
0
561
311
3329
1336
Jul
28.1
1.05
0
0
561
303
2981
1093
Aug
28.1
1.07
0
0
562
304
3025
1087
Sep
27.9
1.02
0
0
537
287
2755
948
Oct
27.6
1.00
0
0
544
286
2634
896
Nov
27.4
1.16
0
0
522
272
2587
949
Dec
26.7
1.40
0
0
517
258
2386
877
3.0
2.6
3.2
3.6
3.5
3.0
3.2
3.3
3.6
3.0
2.3
2.4
2.3
1666
2027
1095
186
11
85
0
18
5
53
0
10
20
116
1
27
56
218
5
52
184
296
28
68
231
390
62
80
241
522
100
85
249
383
74
78
269
493
135
74
257
370
138
61
116
299
2
66
27
87
1
23
DB
MCWB
DB
MCWB
DB
MCWB
DB
MCWB
34.1
23.9
33.0
23.9
32.1
23.7
31.2
23.6
34.9
23.6
33.9
23.8
33.0
23.9
32.1
23.7
36.1
24.5
34.9
24.9
34.0
24.8
33.1
24.7
36.5
25.8
35.2
25.9
34.5
25.8
33.8
25.8
36.3
26.5
35.3
26.4
34.2
26.5
33.2
26.5
35.1
27.0
34.0
26.8
33.1
26.6
32.2
26.5
34.1
26.9
33.1
26.6
32.4
26.4
31.8
26.4
34.1
26.6
33.1
26.5
32.2
26.3
31.8
26.3
33.7
26.7
32.9
26.6
32.1
26.3
31.2
26.3
33.2
26.0
32.2
25.9
31.9
25.9
31.0
25.9
33.5
25.1
32.7
25.2
32.0
25.3
31.1
25.2
33.2
24.3
32.5
24.2
31.8
24.2
31.0
24.2
1/2
10/2/2020
Monthly
Design Wet
Bulb and
Mean
Coincident
Dry Bulb
Temperatures
0.4%
2%
5%
10%
WB
MCDB
WB
MCDB
WB
MCDB
WB
MCDB
MDBR
Mean Daily 5% DB MCDBR
Temperature
MCWBR
Range
MCDBR
5% WB
MCWBR
Clear Sky
Solar
Irradiance
taub
taud
Ebn,noon
Edn,noon
All-Sky Solar
Radiation
RadAvg
RadStd
26.3
30.8
25.6
30.1
25.0
29.6
24.5
28.9
26.4
31.3
25.7
30.6
25.2
30.1
24.7
29.5
27.2
32.2
26.6
31.5
26.1
30.9
25.6
30.3
28.1
32.4
27.5
31.7
27.0
31.1
26.6
30.8
28.4
32.3
27.8
31.6
27.4
31.3
27.0
31.0
28.2
32.0
27.7
31.5
27.3
31.0
26.9
30.6
28.1
31.5
27.5
31.0
27.1
30.6
26.7
30.0
28.1
31.6
27.5
30.9
27.0
30.4
26.6
29.9
27.9
31.5
27.4
30.8
27.0
30.2
26.5
29.6
27.7
30.7
27.2
30.2
26.7
29.8
26.3
29.2
27.4
30.5
26.7
30.0
26.2
29.6
25.9
29.2
26.7
30.4
26.1
29.7
25.6
29.2
25.0
28.6
9.8
10.3
3.4
9.2
3.4
10.0
10.5
3.2
9.3
3.3
9.4
9.9
2.8
8.9
2.9
8.7
9.1
2.6
8.5
2.9
8.4
9.0
2.9
8.4
3.3
8.1
8.9
3.2
8.2
3.5
7.7
8.6
3.4
7.9
3.6
7.5
8.4
3.2
7.7
3.4
7.4
8.3
3.3
7.6
3.3
7.6
8.5
3.3
7.7
3.3
8.3
9.0
3.2
8.1
3.2
9.0
9.7
3.4
8.5
3.4
0.461
2.314
839
128
0.461
2.276
835
132
0.488 0.513 0.551 0.530
2.157 2.078 2.012 2.093
819 813 788 797
151 168 183 167
0.461 0.452 0.452 0.455 0.460 0.495
2.335 2.382 2.372 2.356 2.331 2.219
838
836
839
848
852
818
128
121
123
127
131
144
5.04
0.22
5.33
0.35
5.75
0.24
5.86
0.24
CDDn
Cooling degree-days base n°F, °F-day
Lat
CDHn
Cooling degree-hours base n°F, °F-hour Long
DB
Dry bulb temperature, °F
DP
Dew point temperature, °F
Ebn,noon
Edh,noon
Clear sky beam normal and diffuse
horizontal irradiances at solar noon,
Btu/h/ft2
5.78
0.24
4.98
0.27
Latitude, °
Longitude, °
Mean coincident
dry bulb
temperature, °F
Mean coincident
MCDBR dry bulb temp.
range, °F
Mean coincident
MCDP dew point
temperature, °F
Mean coincident
MCWB wet bulb
temperature, °F
Mean coincident
MCWBR wet bulb temp.
range, °F
Mean coincident
MCWS
wind speed, mph
Elevation, ft
Enth
Enthalpy, Btu/lb
HDDn
Heating degree-days base n°F, °F-day
PCWD
Prevailing coincident wind direction, °,0
WS
= North, 90 = East
MDBR
4.87 4.73 4.80
4.86
4.67
0.34 0.31 0.30
0.25
0.33
Years used to calculate the design
Period
conditions
Standard deviation of daily average
Sd
temperature, °F
StdP
Standard pressure at station
elevation, psi
taub
Clear sky optical depth for beam
irradiance
taud
Clear sky optical depth for diffuse
irradiance
Tavg
Average temperature, °F
Time
Zone
Hours ahead or behind UTC
WB
Wet bulb temperature, °F
Mean dry bulb
temp. range, °F
Hours
8/4 &
55/69
Wind speed, mph
HR
Number of hours between 8 a.m.
and 4 p.m with DB between 55 and
69 °F
Humidity ratio, grains of moisture
per lb of dry air
MCDB
Elev
4.84
0.22
2/2