Some structural characteristics by timber classes and diameter classes of evergreen broadleaf forest in dakrong natural reserve quang tri province
Bạn đang xem bản rút gọn của tài liệu. Xem và tải ngay bản đầy đủ của tài liệu tại đây (523.86 KB, 32 trang )
MINISTRY OF AGRICULTURE AND RURAL DEVELOPMENT
VIETNAM FORESTRY UNIVERSITY
GRADUATION THESIS
SOME STRUCTURAL CHARACTERISTICS BY TIMBER CLASSES AND
DIAMETER CLASSES OF EVERGREEN BROADLEAF FOREST IN DAKRONG
NATURAL RESERVE, QUANG TRI PROVINCE
Major: Natural Resources Management
Code: D850101
Faculty: Forest Resources and Environmental Management
Student
: Nguyen Thi Minh Tu
Student ID : 1453090734
Class
: K59B - Natural Resources Management
Course
: 2014 - 2018
Advanced Education Program
Developed in collaboration with Colorado State University, USA
Supervisor: Dr. Cao Thi Thu Hien
Ha Noi, September 24th, 2018
ACKNOWLEDGEMENT
During months of conducting this working, I gained a variety of encouragements and
assistance from many people without whom this thesis would have never been conductable.
First and foremost, I would like to express my such gratefulness to Dr. Cao Thi Thu
Hien for constant support to each step of my thesis working, giving me motives and
enthusiasm as well as a wealth of knowledge. The guidance was really clear with vivid
images and detailed illustration, which facilitated me a lot in thesis project. In another place, I
would like to thank the Administration of Vietnam Forestry University, Faculty of Forest
Resources and Environmental Management, Department of Environmental with sincere
gratitude for enabling us all best to complete theS graduation thesis.
Also, I sincerely express my thankfulness to many local people and authorities, both of
whom untoldly assist me in collecting data and many other related procedures. In which, I am
espicially thank Mr.Bui Kim Thai – Manager of Dakrong Nature Reserve, Quang Tri
Province and all forest rangers in the same office for supplying me with credible data,
concrete and vivid images as well as encouraging me untoldly. All above, I would like to give
respectful gratitude to Dakrong Residential Commune for accomodating me during the
process of practicing in Dakrong Nature Reserve.
Finally, I also thank my family and all friends, partners for best effort to give me the
best facilitations to accomplish the thesis within expectations.
Thank you!
Hanoi, September 24th, 2018
Nguyen Thi Minh Tu
TABLE OF CONTENTS
ACKNOWLEDGEMENT .......................................................................................................... 1
TABLE OF CONTENTS ........................................................................................................... 2
LIST OF TABLES ..................................................................................................................... 4
LIST OF FIGURES .................................................................................................................... 5
ABSTRACT ............................................................................................................................... 1
CHAPTER 1 ............................................................................................................................... 2
INTRODUCTION ...................................................................................................................... 2
CHAPTER II .............................................................................................................................. 4
GOAL, OBJECTIVES, STUDY SITE METHODOLOGY ....................................................... 4
2.1. Goals .................................................................................................................................... 4
2.2. Objectives ............................................................................................................................ 4
2.3. Methods ............................................................................................................................... 4
2.3.1. Study site .......................................................................................................................... 4
2.3.2. Data collection .................................................................................................................. 4
2.3.3. Data analysis ..................................................................................................................... 5
CHAPTER III ............................................................................................................................. 8
RESULTS AND DISCUSSION ................................................................................................. 8
3.1. Descriptive statistics ............................................................................................................ 8
3.2. Frequency distributions ....................................................................................................... 9
3.2.1. Distribution of diameter frequency................................................................................... 9
3.2.2. Distributions of height frequency ................................................................................... 11
3.3. Species composition .......................................................................................................... 13
3.4. Number of trees per diameter classess .............................................................................. 17
The number of trees over 4 diameter classes are listed in the Table 3.5. ................................. 17
3.5. Number of trees per timber classess .................................................................................. 18
The number of trees per timber classes was presented in the table 3.6 .................................... 18
3.6. Total basal area per DBH classes ...................................................................................... 18
The total basal area per DBH classes of three forest states was shown in the Figure 3.3. ....... 18
3.7. Total basal area per timber classes .................................................................................... 19
CHAPTER IV ........................................................................................................................... 21
CONCLUSION ........................................................................................................................ 21
4.1. Descriptive statistics .......................................................................................................... 21
4.2. Frequency distributions ..................................................................................................... 21
4.3. Species composition .......................................................................................................... 22
4.4. Number of trees per diameter classes ................................................................................ 22
4.5. Number of trees per timber classes ................................................................................... 23
4.6. Total basal area per DBH classes ...................................................................................... 23
4.7. Total basal area per timber classes .................................................................................... 23
REFERENCES ......................................................................................................................... 24
LIST OF TABLES
Table 01. Tree measurement records .......................................................................................... 5
Table 3.1. Descriptive statistics of 30 sample plots ................................................................... 8
Table 3.2. Estimated parameters and Kolmogorov-Smirnov test ............................................... 9
Table 3.4. Density and species composition by diameter classes ............................................ 14
Table 3.5. Number of trees per diameter classess .................................................................... 17
Table 3.6. The number of trees per timber classess.................................................................. 18
LIST OF FIGURES
Figure 3.1. Frequency distributions of diameter for 3 forest states .......................................... 11
Figure 3.2. Frequency distributions of height for 3 forest states .............................................. 13
Figure 3.3. Total basal area per DBH classes of three forest states ......................................... 19
Figure 3.4. Total basal area per timber classes of three forest states ....................................... 20
ABSTRACT
This study has aimed to show some structural characteristics by timber classes and
diameter classes of evergreen broadleaf forest in Dakrong Nature Reserve, Dakrong district,
Quang Tri province. The results showed that the density of the forest state IIIA1 ranged from
570 stems/ha to 1030 stems/ha, mean diameter breast height varied from 11.1 cm to 15.0 cm,
mean height was 7.1 m to 11.0 m, the total basal area and volume were respectively 7.1 m –
11.0 m2/ha to 19.89 m2/ha and 28.91 m3/ha to 59.3 m3/ha. These number for two forest states
IIIA2, IIIB were successively: 807 stems/ha - 1330 stem/ha, 13.9 cm to 17.2 cm, 9.7 m to
12.3 m, 17.26 m2/ha - 34.23 m2/ha, 102.53 m3/ha – 191.78 m3/ha (for forest state IIIA2) and
280 stems/ha - 580 stems/ha, 18.44 cm – 24.32 cm, 0.57 m – 11.39 m, 24.31 m2/ha – 39.97
m2/ha, 247.14 m3/ha – 293.83 m3/ha (for forest state IIIB). The forest state IIIA1 leaded in the
number of species with 68 tree species per hectar, followed by the forest state IIIB with 62
tree species per hectar. The number of tree species of forest state IIIA2 went down to the last
place with only 35 tree species. The number of dominant tree species among 4 diameter
classes of the forest state IIIA1, IIIA2 and IIIA3 was successively 5,7,6,0 tree species, 4,5,5,6
tree species and 7,6,5,7 tree species. The number of trees per diameter classes of the two
forest states IIIA1 and IIIA2 concentrated mostly on diameter of 6 -15 cm and the density of
forest state IIIB concentrated mostly on diameter within 15-30 cm. In all forest states, the
number of trees concentrated on timber class VIII reflexes that a majority of trees in Dakrong
Nature Reserve is lowly-qualified for economic and utilization use. The total basal area of
forest state IIIA1 and IIIA2 concentrated on the first DBH class (6 cm
the forest state IIIB concentrated on the second DBH class (15 cm
D
D
15 cm) and of
30 cm). For the
forest state IIIA1, the total basal area mainly focused on two timber classes VII. For the forest
state IIIA2, the total basal area was the largest on the last timber class (VIII), followed by
timber class II, IV, VI. For the forest state IIIB, the total basal area of timber class VIII and V
was the highest.
Key words: timber classes, diameter classes, evergreen broadleaf forest, species composition,
1
CHAPTER 1
INTRODUCTION
According to inventory results in May 2018, the total area of forested land in Quang
Tri Province is 254.000 ha, in which the coverage accounts for 50% (MARD, 2018). Until
now, there are 3 natural reserves established in districts, in which Dakrong Natural Reserve
located in Dakrong District was discovered leading 3 nature ones of the whole province in the
capacity of natural resources including forests.
Bordering on Phong Dien Natural Reserve in Thua Thien Provinve, Dakrong Natural
Reserve in Quang Tri Province has an area of 40.526 ha, including regional part of 6
communes: Ba Long, Hai Phuc, Trieu Nguyen, Ta Long, Huc Nghi, Hong Thuy in Dakrong
district. With variety and diversity of forest ecosystems and limestone, watersheds here are
home to many species of fauna and flora. In addition, Dakrong reserve is also “The important
Green Corridor” connecting the network of the north of Bach Ma – Hai Van, Bach Ma Phong Dien, Phong Nha – Ke bang, Vu Quang, Pu Mat and other natural reserves of Eastern
Phu Rieng, Hin Nam No of neighboring country – Laos. Moreover, Dakrong reserve also
provides people with spectacular landscape and many attractive sites for ecotourism.
Dakrong natural reserve is in the low mountainous region, with sharp separation and
high slope. Now, it is reported that 1412 species of flora have been found, 24 species of them
are listed in the Red Book. There are 2 types of forests in this vegetational cover: closed
evergreen sub-tropical broadleaf forest and closed evergreen tropical broadleaf forest
rainforest. In which, the former one possesses the greatest area of the same type in the central
provinces.
In terms of closed evergreen broadleaf forest in Dakrong, it owns an area of 5000
hectares, accounting for 12% of total reserve area, distributed in the height from 800 m to
1400 m above sea level, mainly in mountain range from Pa Le to A Doa, with mass of A Pong
cave mountain. This is the forest type that is not muchly affected and basically still maintains
its primitiveness. Its coverage reaches 70%. Vegetation cover mostly grows broadleaf species
belonging to Fagaceae, Loraceae, Euphorbiaceae, Fabaceae, Sapotaceae, ect. In which,
there are some trees playing the key role in setting up main communities such as Castanopsis
tonkinensis, Lithocarpus dinhensis, Quencus fleuryi, Archidendron tonkinensis, and some
species of Cinnamonum genus of Lauraeae family. From the height of 1200 m above sea
level, there are some other species as Archidendron tonkinensis, Michelia tonkinensis, ect.
Especially Dacrycarpus imbricatus, Dacrydium elatum, Podocarpus neriifolius, 3 of which
2
occupying the emergent layer of stand, leading to formation of some mixed stands with
broadleaf and needleleaf forest. Tree species belonging to this type of forest own diameter of
25-30 cm, height of 20m, some others’ diameter is even up to 50-100cm.
Despite great effort in management, protection and research investigation on
biodiversity in this area, there are still drawbacks on the work of managing and protecting
until now, scientific data have not been completed yet, biodiverisity has yet to be investigated
adequately and systematically. Besides, living condition of ethnic minorities is still very
difficult, especially Van Kieu, Pa Co.
In order to provide a scientific basis for proposing solutions to sustainable managing
natural forest in general and natural evergreen broadleaf in Dakrong nature reserve – Quang
Tri Province in particular, it is necessary to study “Some structural characteristics by timber
classes and diameter of evergreen broadleaf forest in Dakrong nature reserve, Quang Tri
province”.
3
CHAPTER II
GOAL, OBJECTIVES, STUDY SITE METHODOLOGY
2.1. Goals
The goal of this study is to analyze some structural characteristics by timber classes
and diameter classes of evergreen broad-leaved forest in Dakrong nature reserve, Quang Tri
Province.
2.2. Objectives
- To provide some statistic characteristics of natural forests in the research area
- To analyze forest structural characteristics of overstorey in the research area
- To find species composition in the study area
- To find number of trees by diameter classes and timber classes
- To find the total basal area by diameter classes and timber classes
2.3. Methods
2.3.1. Study site
Dakrong Nature Reserve is located in the southern part of the Dakrong district of
Guizhou Province, and has a geographical coordinates of 16023 '- 16009' north latitude106052’
– 107009 east longitude. Dak Krong Nature Reserve covers an area of 40,526 ha, including
part of 6 communes of Ba Long, Hai Phuc, Trieu Nguyen, Ta Long, Huc Nghi and Hong
Thuy of Da Krong district.
The annual average temperature is from 22 to 23 degrees Celsius, the average annual
rainfall is from 2500 mm to 3000 mm, the average humidity is from 85% to 87%
2.3.2. Data collection
In this study, 3 forest states namely IIIA1, IIIA2 and IIIB were selected. 30 sample
plots were established, 10 sample plots in each forest state. Each plot covers 1000m2 (40m of
length x 25m of width).
For trees in overstorey: In each plot, all of the individual trees found in diameter at
breast height (D1.3) greater than or equal to 6cm was marked, local and scientific names
identified, their diameter was measured at 1.3 m from the ground. All trees in each plot were
measured total tree height by Blumeleiss.
All data will be recorded on the field forms as the following:
4
Table 01. Tree measurement records
Group number:
N0.
Date:
Vegetation type:
Location:
Sample plot number:
Slope:
Sample plot area:
Aspect:
Altitude:
DBH
Species
E-W
S-N
Height
Note
2.3.3. Data analysis
SPSS, Excel and XLSTAT Softwares were used for analyzing the data.
a. Descriptive statistics
- Tree density (Trees/ha):
N/ha = (trees/ha)
(2.1)
- Mean Diameter (cm) and Height (m)
̅ =∑
(2.2)
Where: ̅ is the mean of X (diameter or height)
Xi is the numeric value of ith observation of X
n is the number of observations
- Basal area (m2)
The basal area of all trees in the sample plots were calculated using the formula:
BA = π x
(2.3)
Where BA = Basal area (m2), D = Diameter at breast height (cm), л = 3.1416
The total BA for each plot was obtained by adding all trees BA in the plot.
- Volume: V = G.H.F with form factor F equals to 0.5
b. Structural analysis
10 sample plots in each forest states was combined into one plot to analyze forest
structure.
Forest structure was analyzed as follows:
5
- Frequency distributions of number of trees per DBH class
- Frequency distributions of number of trees per height class
In this study, Weibull function with three parameters was used to modelize absolute
frequency distributions of the DBH.
There are a number of well-known methods which can be used to estimate distribution
parameters based on available sample data. For every supported distribution, the following
parameter estimation methods:
(1) Method of moments (MOM);
(2) Maximum likelihood estimates (MLE);
(3) Least squares estimates (LSE);
(4) Method of L-moments.
In XLSTAT software, the parameters of the distribution are estimated by maximizing
the likelihood of the sample.
XLSTAT offers two goodness of fit tests, namely the Chi-square goodness of fit test
and the Kolmogorov-Smirnov goodness of fit.
In this research, for goodness of fit, the Kolmogorov - Smirnov test was employed.
Hypothesis Testing
The null and the alternative hypotheses are:
H0: the data follow the specified distribution;
HA: the data do not follow the specified distribution.
The hypothesis regarding the distributional form is rejected at the chosen significance
level ( ) if the test statistic, D, is greater than the critical value obtained from a table. The
fixed values of
(0.01, 0.05 etc.) are generally used to evaluate the null hypothesis (H0) at
various significance levels. A value of 0.05 is typically used for most applications, however,
in some critical industries, a lower
value may be applied. In this study, we used the
value
of 0.05.
P-Value
The P-value, in contrast to fixed α values, is calculated based on the test statistic, and
denotes the threshold value of the significane level in the sense that the null hypothesis (H0)
will be accepted for all values of α less than the p-value. For example, if p = 0.025, the null
hypothesis will be accepted at all significance levels less than p (i.e. 0.01 and 0.02), and
rejected at higher levels, including 0.05 and 0.1.
6
XLSTAT displays the p-values based on the Kolmogorov-Smirnov test statistics (D)
calculated for each fitted distribution
c. Species composition
To find the species composition in the research area, 3 plots were combined into one
large plot, then IVI% of each species was computed.
Important Value Index (IVI%) describes how dominant one species is in a certain
forested area. IVI% was calculated by adding Relative density and Relative basal area as
follows:
Relative density N% =
x 100
Relative basal area G% =
x 100
IVI% =
(2.4)
(2.5)
(2.6)
The IVI% varies from 0% to 100%. The larger the importance value is, the more
important a species is within one particular community. Trees with IVI% ≥ 5% are important
species.
d. The number of trees and the total basal area by diameter classes
All trees in each plot forest state was classified into 4 diameter classes as follows
(refered from author group of Pham Thi Hanh, Nguyen Thi Yen, Pham Tien Dung in an
article with the similar topic in Tam Dao National Park, Vinh Phuc province):
6 cm
DBH
15 cm
15 cm
DBH
30 cm
30 cm
DBH
45 cm
DBH > 45 cm
e. The number of trees and the total basal area by timber classes.
Trees in plots were classified into 8 timber classes based on Decision No. 2198 /
CNR-BLN dated 26/11/1977 of the Ministry of Forestry on the promulgation of temporary
classification of timber used in the country.
7
CHAPTER III
RESULTS AND DISCUSSION
3.1. Descriptive statistics
Descriptive statistics of 30 sample plots was summarized in Table 3.1.
Table 3.1. Descriptive statistics of 30 sample plots
Plot
number
1
2
3
4
5
6
7
8
9
10
1
2
3
4
5
6
7
8
9
10
1
2
3
4
5
6
7
8
9
10
N
(trees/ha)
950
980
980
1030
570
810
580
880
570
580
1280
1300
1000
1180
930
1220
1330
990
1310
870
380
490
480
360
450
410
580
280
560
380
̅̅̅̅̅̅̅
(cm)
13.2
13.3
14.4
12.6
15.0
12.5
12.5
13.2
11.1
11.4
14.7
16.2
17.2
17.1
15.8
14.8
14.4
18.4
13.9
16.6
18.63
19.61
18.44
19.30
20.33
19.78
23.70
24.32
22.09
22.63
̅ (m)
9.9
9.9
11.0
10.0
10.3
8.9
7.1
8.7
6.6
7.1
10.1
11.1
11.3
11.8
12.3
11.4
10.7
12.0
9.7
10.7
8.38
8.33
6.73
6.67
7.22
8.37
6.30
0.57
9.34
11.39
8
Basal area
(m2/ha)
15.30
16.69
19.89
15.14
11.47
12.12
8.75
14.73
7.00
7.37
19.47
17.59
17.26
18.35
17.71
19.22
34.23
19.07
29.71
18.74
32.50
37.28
32.00
39.96
24.31
27.32
34.46
39.97
33.71
28.58
Volume
(m3/ha)
54.32
58.82
57.07
57.70
59.30
56.64
57.89
58.63
52.48
28.91
140.12
133.96
106.85
102.53
137.22
150.97
134.52
127.38
191.78
142.15
253.29
293.83
269.39
254.94
260.93
292.10
287.40
260.40
262.22
247.14
Forest
state
IIIA1
IIIA1
IIIA1
IIIA1
IIIA1
IIIA1
IIIA1
IIIA1
IIIA1
IIIA1
IIIA2
IIIA2
IIIA2
IIIA2
IIIA2
IIIA2
IIIA2
IIIA2
IIIA2
IIIA2
IIIB
IIIB
IIIB
IIIB
IIIB
IIIB
IIIB
IIIB
IIIB
IIIB
The density per ha (N), ranged from 870 to 1330 trees/ha. Forest state IIIA2 had the
highest number of trees per hectar (from 807 stems/ha to 1330 stems/ha) (Table 3.1). This was
closely followed by forest state IIIA1 with 570 stems/ha - 1030 stems/ha. The third place was
forest state IIIB with 280 stems/ha - 560 stems/ha.
Forest state IIIB had the largest mean diameter at breast height (dbh) (from 18.44 cm
to 24.32 cm) while the smallest mean dbh (from 11.1 cm to 15.0 cm) was recorded for forest
state IIIA1 (Table 3.1).
In terms of the total tree height, the highest mean tree height belonged to the forest
state IIIA2 (ranged from 9.7 m to 12.3 m), meanwhile, the shortest mean height of trees was
found in the forest state IIIB, lied between 6.30 m and 11.39 m.
The total basal area per hectare in forest state IIIB was the highest (24.31 m2/ha –
29.97 m2/ha), this was followed by forest state IIIA2 with basal area per ha of 17.26 m2/ha 34.23 m2/ha. The lowest basal area per ha of forest state IIIA1 was 7.00 m2/ha – 19.89 m2/ha.
The similar trend to volume, the volume of three forest states IIIB, IIIA2, and IIIA1
was 247.14 m3/ha – 293.83 m3/ha, 102.53 m3/ha – 191.78 m3/ha, 28.91 m3/ha – 59.30 m3/ha,
respectively.
3.2. Frequency distributions
3.2.1. Distribution of diameter frequency
Weibull function with 3 parameters was used to fit distribution of diameter frequency.
Null hypothesis and alternative hypothesis were set:
Ho: The distribution of diameter frequency follows a Weibull distribution
Ha: The distribution of diameter frequency does not follow a Weibull distribution
The null hypothesis should be accepted if the p-value of D is higher than the
significance level.
Table 3.2. Estimated parameters and Kolmogorov-Smirnov test
for diameter distribution of 3 forest states
Forest state
D
p-value Significance level
IIIA1
1.331
8.000
5.662
0.071
0.065
0.05
IIIA2
1.109
10.960
5.244
0.099
0.544
0.05
IIIB
1.597
17.346
5.333
0.129
0.152
0.05
The Kolmogorov smirnov test indicated that the Weibull (3) distribution can provide
good fit for the diameter data, because its calculated D-values with p-value was higher than
9
0.05 in all 3 forest states. This implies the null hypothesis was accepted for the Weibull (3)
distribution, meaning the data followed the specified distribution.
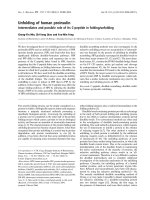
Figure 3.1 showed the diameter size class distribution of 3 forest states in the study
area. Higher number of the trees were in the smaller diameter classes. In other words, there
was a decline in the number of stems with increasing size classes. The implication of this is
that the forests are still undergoing regeneration and recruitment, which are vital indicators of
forest health and vigour.
There was virtually no difference in the frequency distributions of the DBH across the
three forest states. In addition, forest state IIIA1 was lacked of large stems. Trees with a DBH
greater than 70 cm were only found in two forest states IIIA2 and IIIB.
Forest state IIIA1
No. trees
350
Frequency (fact)
Frequency (theoretical)
300
250
200
150
100
50
DBH (cm)
0
8
12
16
20
24
28
32
36
40
44
Forest state IIIA2
No. trees
500
450
400
350
Frequency (fact)
300
Frequency (theoretical)
250
200
150
100
50
DBH (cm)
0
8 12 16 20 24 28 32 36 40 44 48 52 56 60 64 76 80 84
10
Forest state IIIB
No. trees
140
Frequency (fact)
Frequency (theoretical)
120
100
80
60
40
20
DBH (cm)
0
8
12 16 20 24 28 32 36 40 44 48 52 56 60 64 72
Figure 3.1. Frequency distributions of diameter for 3 forest states
as fitted by Weibull (3) distribution
3.2.2. Distributions of height frequency
Results of simulation of a number of trees by size of height of 3 forest states are
summarized in Table 3.3.
Table 3.3 Estimated parameters and Kolmogorov-Smirnov test
for height distribution of 3 forest states
Forest state
IIIA1
IIIA2
IIIB
2.300
1.917
2.760
7.657
8.705
11.886
D
0.139
0.110
0.082
2.328
3.288
4.778
p-value
0.076
0.641
0.071
Significance level
0.05
0.05
0.05
From the comparing p-value based on the Kolmogorov-Smirnov test statistics (D)
calculated and significance level, we can see that the height distribution of three forest states
followed the three-parameter Weibull distribution (Table 3.3).
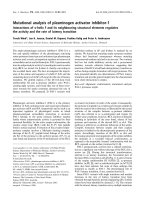
The shape of the frequency distribution of height in Figure 3.2 expresses the height
distributions of three forest states, where unimodality is obvious in the height distributions of
the two forest states IIIA2 and IIIB, the bimodality in the height distributions in the height
distributions of the forest states IIIA1.
On the whole, the height frequency distributions were skewed to the left of graph,
indicating that the plots had many young trees.
11
Forest state IIIA1
No. trees
140
Frequency (fact)
Frequency…
120
100
80
60
40
20
Height (m)
0
3
5
7
9
11
13
15
17
19
Forest state IIIA2
No. trees
180
160
140
Frequency (fact)
120
Frequency (theoretical)
100
80
60
40
20
Height (m)
0
3
5
7
9
11
13
15
17
Forest state IIIB
12
19
21
23
25
No. trees
45
40
Frequency (fact)
35
Frequency (theoretical)
30
25
20
15
10
5
Height (m)
0
5
7
9
11
13
15
17
19
21
23
25
27
Figure 3.2. Frequency distributions of height for 3 forest states
as fitted by Weibull (3) distribution
3.3. Species composition
Results of density and species composition in the study area are summarized in Table
3.4.
In view of the total, the number of trees per ha (No.trees/ha) of forest state IIIA2 was
the highest with 1141 individuals/ha (Table 3.4). While number of trees per ha of forest state
IIIB was the lowest with only 437 stems/ha, nearly three times as low as that of forest state
IIIA2 and twice as low as forest state IIIA1 with 793 trees/ha. However, forest state IIIA1
leaded in the number of species with 68 tree species per hectar, followed by the forest state
IIIB with 62 tree species per hectar. The number of tree species (No.species) of forest state
IIIA2 went down to the last place with only 35 tree species.
13
Table 3.4. Density and species composition by diameter classes
Forest
state
IIIA1
Variable
Total
6 cm < DBH < 15 cm
15 cm < DBH < 30 cm
30 cm < DBH < 45
cm
No.trees/ha
No.species
Dominant
species
793
68
Ficus religiosa,
Tapiscia sinensis,
Knema saxatilis,
Lithocarpus …
545
64
Tapiscia sinensis, Knema
saxatilis, hibbertia, Ficus
religiosa, Euphorbia
tirucalli,
Typha orientalis
226
50
Knema saxatilis,
Ficus religiosa,
Tapiscia sinensis,
Lithocarpus, Typha
orientalis
No.trees/ha
No.species
Dominant
species
1141
35
Cirsium japonicum,
Fagraea fragrans,
Hymenodictyon
excelsum, Cinnadenia
paniculata,
Burretiodendron
hsienmu
437
62
Gironniera
subaequalis Planch,
Eberhardtia Aurata,
Hydnocarpus nana,
Hydnocarpus obtusa,
Vatica odorata,
Peperomia obtusifolia
744
32
Cirsium
japonicum, Pseuderanthe
mum carruthersii
reticulatum, Diospyros
rubra, Cinnadenia
paniculata
235
35
Ficus religiosa,
Lithocarpus, Tapiscia
sinensis, Lysidice
rhodostegia Hance,
Vernicia montana,
Knema saxatilis
275
24
Fagraea fragrans,
Cinnadenia paniculata,
Hymenodictyon
excelsum, Nageia fleuryi,
Euphorbia tirucalli,
Burretiodendron hsienmu
IIIA2
No.trees/ha
No.species
Dominant
species
IIIB
168
48
Eberhardtia Aurata,
Vatica odorata,
Knema globularia,
Diospyros rubra,
Hydnocarpus obtusa,
Gironniera subaequalis
Planch, Hydnocarpus nana
14
213
40
Gironniera subaequalis
Planch, Eberhardtia
Aurata, Hydnocarpus
nana, Hydnocarpus
obtusa, Vatica odorata,
Peperomia obtusifolia
312
27
Cirsium japonicum,
Pseuderanthemum
carruthersii ,
Diospyros rubra,
Fagraea fragrans
Cinnadenia
paniculata
47
24
Peperomia
obtusifolia,
Gironniera
subaequalis Planch,
Hydnocarpus nana,
Cissa chinensis,
Eberhardtia Aurata
DBH > 45 cm
418
28
Fagraea fragrans,
Hymenodictyon
excelsum, Cinnadenia
paniculata,
Burretiodendron
hsienmu, Nageia fleuryi
20
13
Aphanamixis grandiflora
Blume, Cissa chinensis,
Vatica odorata,
Eberhardtia Aurata,
Canarium album
Raeusch, Physalis
angulata, Cinnamomum
parthenoxylon
The number of dominant species of the forest state IIIA2 was 5 out of 35 tree
species (Table 3.4), accounting for 14.3 % including: Gironniera subaequalis Planch,
Eberhardtia Aurata, Hydnocarpus nana, Hydnocarpus obtusa, Vatica odorata, and
Peperomia obtusifolia. In contrast, the number of dominant tree species in the forest state
IIIA1 was the lowest with 4 out of 68 tree species, accounting for 5.88 %, including: Ficus
religiosa, Tapiscia sinensis, Knema saxatilis, and Lithocarpus. The number of dominant
trees in the forest state IIIB species took up 9.6% with 6 out of 62 tree species, they are:
Gironniera subaequalis Planch, Eberhardtia Aurata, Hydnocarpus nana, Hydnocarpus
obtusa, Vatica odorata, and Peperomia obtusifolia.
For the forest state IIIA1, the number of trees per hectar gathers most highly on
diameter class of 6-15 cm with 545 individuals/ha. Meanwhile, there is no species owning
diameter over 45 cm. The number of trees within 15 cm - 30 cm and 30 cm - 45 cm in
diameter were closely equal with 235 and 226 stems/ha. Also, the number of tree species
was the highest at diameter class of 6 cm - 15 cm with 64 tree species and there was no tree
species owining diameter over 45 cm. Diamter class of 15 cm - 30 cm jumped up to the
highest at number of dominant tree species with 7 out of 35 tree species (accounted for
20%), including: Ficus religiosa, Lithocarpus, Tapiscia sinensis,
Lysidice rhodostegia
Hance, Vernicia montana, and Knema saxatilis. Going after is the number of dominant tree
species of 6 cm
D
15 cm and 30 cm
D
45cm with successively 5 species (10%)
and 6 species (9.3%). The number of dominant tree species over 45cm in diameter was 0,
the lowest of all. 3 dominant tree species that were distributed most in diameter classes are
Cirsium
japonicum, Pseudseranthemum
carruthersii
paniculata.
15
reticulatum
and
Cinnadenia
For the forest state IIIA2, diameter class of 6 cm - 15 cm kept leading in the
number of trees per hectar with 744 stems and standing in the least was number of trees of
15 cm - 30 cm in DBH with 275 trees, twice as high as than that of IIIA2. There were 418
trees over 45 cm in diameter (just going after the number of trees in diameter of 6 cm - 15
cm). The number of tree species within diameter class of 6 cm - 15 cm remained the
greatest with 32 tree species. However, the number of species in diameter class of 15 cm 30 cm, 30 cm - 45 cm and over 45 cm tended to be roughly equal with successively 24, 27
and 28 tree species. On the contrary, the number of dominant tree species among 4
diameter classes were just slightly fluctuating, with 4 tree species (accounting for 12.5%, 6
cm
D
(18.5%, 30
15 cm, the lowest one), 5 tree species (17.8%, D
D
45) and 6 tree species (25%, 15 cm
D
45 cm), 5 tree species
30 cm, the greatest one). In
which, Cinnadenia paniculata was mostly distributed in all 4 diameter classes.
For the forest state IIIB, there was a fluctation among the number of trees per ha of
4 diameter classes. Whereas there were up to 213 trees/ha within diameter class of 15 cm 30 cm (the highest of 4 DBH classes), there is only 20 trees/ha over 45 cm in diameter (the
lowest of 4 DBH classes). The number of trees per ha of 6 cm
D
D
15 cm and 30 cm
45 cm also strikingly fluctuated with successively 168 trees/ha and 47 trees/ha. The
number of tree species in 4 diameter classes are successively 48, 40, 24 and 13 tree
species. With respect to dominant tree species, there was 6, 7, 6,5 and 7 tree species from
the first to the fourth DBH class. Gironniera subaequalis Planch, Eberhardtia Aurata,
Hydnocarpus obtusa, Vatica odorata Peperomia obtusifolia were the four most-distributed
dominant species in all 4 diameter classes.
In general, the forest state IIIA2 tended to lead in the number of trees per hectar
and the forest state IIIA1 tended to lead in the number of tree species.
16
3.4. Number of trees per diameter classess
The number of trees over 4 diameter classes are listed in the Table 3.5.
Table 3.5. Number of trees per diameter classess
Forest state
DBH classess
IIIA1
IIIA2
IIIB
(no.trees/ha)
(no.trees/ha)
(no.trees/ha)
6 cm < DBH < 15 cm
545
744
168
15 cm < DBH < 30 cm
235
275
202
30 cm < DBH < 45 cm
13
98
47
DBH > 45 cm
0
17
15
The Table 3.5 illustrated that the density of the two forest states IIIA1 and IIIA2
tended to decrease gradually by the increase of diameter classes. Specifically, the number
of trees per hectar of the two forest states IIIA1 and IIIA2 concentrated mostly on diameter
of 6 -15 cm, with 545 stems/ha and 744 trees/ha. Successively going after was the number
of trees per hectar of 15 cm
D
30 cm, 30 cm
D
45 cm, D
45 cm with 235
(trees/ha, in forest state IIIA1) and 275 (trees/ha, in forest state IIIA2), 13 (trees/ha, in
forest state IIIA1) and 98 (trees/ha, in forest state IIIA2), 0 ( trees/ha, in forest state IIIA1)
and 17 (trees/ha, in forest state IIIA2). Particularly in the forest state IIIA1, there was no
tree with diameter over 45cm. So, it can be seen that the density of the forest state IIIA1
and IIIA2 concentrated highly on diameter within 6 -15 cm. This means the number of
young-aged trees of the two forest states IIIA1 and IIIA2 accounted for the largest percent
of all.
In contrast, the density of the forest state IIIB concentrated mostly on diameter
within 15-30cm with 202 trees/ha, followed by was the number of trees of 6 cm
cm with 168 trees/ha. The number of trees in DBH class
D
15
45cm kept the lowest with 15
cm (greater than that of forest state IIIA1 but smaller than that of forest state IIIA2).
To generalize, the majority of trees owned diameter of 6 cm - 15 cm and 15 cm - 30
cm, the number of trees per hectar in diameter of 30 cm - 45 cm and over 45cm of all three
forest states was still limited.
17
3.5. Number of trees per timber classess
The number of trees per timber classes was presented in the table 3.6
Table 3.6. The number of trees per timber classess
State
Timber classess
IIIA1
IIIA2
IIIB
(no.trees/ha)
(no.trees/ha)
(no.trees/ha)
I
2
1
3
II
0
160
34
III
15
0
29
IV
22
129
16
V
52
28
101
VI
61
97
52
VII
78
22
9
VIII
563
704
193
The density distribution of 3 forest states in timber class I, II and III (3 of which are
regarded as the most valuable) was rather little and even equal to 0 (in timber class II of
state IIIA1 and timber class III of state IIIA2, for example). Only the class II of forest state
IIIA2 owned more excessive density than other states in timber class I, II, III with 160
trees/ha.
In those timber classes which are listed in medium value as IV, V, VI and VII, the
number of trees per hectar were rather fluctuating, and not uniform among all 3 forest
states.
However, a majority of trees per hectar concentrated on timber class VIII (which
was considered low at economic and utilization values), successively with 563 (trees/ha, in
forest state IIIA1), 704 (trees/ha, in forest state IIIA2) and 193 (trees/ha, in forest state
IIIA3).
Clearly, that most density concentrated on timber class VIII reflexes that a majority
of trees in Dakrong Nature Reserve is lowly-qualified for economic and utilization use.
Meanwhile, the number of trees per hectar in timber class I, II and III were still limited in
comparison with that of timber class VIII.
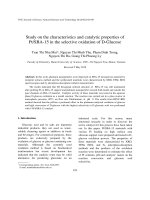
3.6. Total basal area per DBH classes
The total basal area per DBH classes of three forest states was shown in the Figure 3.3.
18
Total basal area
16
15
14
13
12
11
10
9
8
7
6
5
4
3
2
1
0
6 cm < DBH < 15 cm
IIIA1 (m2/ha)
IIIA2 (m2/ha)
IIIB (m2/ha)
DBH classes
15 cm < DBH < 30 cm
30 cm < DBH < 45 cm
DBH > 45 cm
Figure 3.3. Total basal area per DBH classes of three forest states
The total basal area of forest state IIIA1 concentrated on the first DBH class (6 cm
D
15 cm) with 8.83 m2/ha, followed by the second DBH class (15 cm
D
30 cm)
with 3.81 m2/ha and the third place was the third DBH class with 0.21 m2/ha. DBH class
over 45 cm equaled 0 m2/ha.
For the forest state IIIA2, the total basal area focused on the first DBH class with
13.87 m2/ha, the total basal area continuously showed a decrease trend from the second to
the fourth DBH class with 5.13 m2/ha, 1.83 m2/ha, 0.32 m2/ha, respectively.
The total basal of the forest state IIIB concentrated on the second DBH class (15
cm
D
30 cm) with 15.43 m2/ha, followed by the first DBH class with 12.84 m2/ha.
The total basal of the third and the fourth DBH class was 3.59 m2/ha and 1.15 m2/ha,
respectively.
3.7. Total basal area per timber classes
The total basal area per timber classes of three forest states was illustrated in the
Figure 3.4.
For the forest state IIIA1, the total basal area mainly focused on two timber classes
VII (1.26 m2/ha) and VIII (9.12 m2/ha) (Figure 4.4). The total basal area at timber classes I,
II accounted for a tiny number, even timber class II had no tree.
For the forest state IIIA2, the total basal area was the largest on the last timber class
(VIII) with 13.04 m2/ha, followed by timber class II (2.96 m2/ha), IV (2.39 m2/ha), VI
(1.80 m2/ha). The total basal area of timber class VII and V was 0.41 m 2/ha and 0.52
19