Research selection method to determine canopy coverage in luot mountain xuan mai chuong my ha noi
Bạn đang xem bản rút gọn của tài liệu. Xem và tải ngay bản đầy đủ của tài liệu tại đây (1.15 MB, 66 trang )
MINISTRY OF AGRICULTURE AND RURAL DEVELOPMENT
VIETNAM FORESTRY UNIVERSITY
***
STUDENT THESIS
RESEARCH SELECTION METHOD TO DETERMINE CANOPY
COVERAGE IN LUOT MOUNTAIN, XUAN MAI, CHUONG MY, HA NOI
Major: Natural Resources Management
Code: D850101
Faculty: Forest Resources and Environmental Management
Student: Hoang Thu Yen
Student ID: 1253090040
Class: K57 Natural Resources Management
Course: 2012 - 2016
Advanced Education Program
Developed in collaboration with Colorado State University, USA
Supervisor: Dr. Le Xuan Truong
Hanoi, Oct 2016
ACKNOWLEDGEMENTS
This study has been supported by VIETNAM NATIONAL UNIVERSITY OF
FORESTRY. I would like to express my sincere gratitude to my advisor Dr. Le Xuan Truong
for the continuous support of my student thesis study and research, for his motivation,
enthusiasm, and immense knowledge. He was always able to answer any questions that I had.
If I didn‟t understand something the first time, he would explain it to me again so I would
understand it. With his guidance helped me in all the time of research and writing of this thesis.
I wish to thank professor from Colorado State University, Prof. Dr. Lee Macdonald. A
special man that I was very impressed during the study here. He always smiling, patience, and
providing my class with an excellent atmosphere for my our lesson as well as for my research.
And for my friend, I would like to many thank Mr. Tran Thanh Quang, he very nice and so kind.
He helped me a lot during assisting in the field work, it's very difficult work to collect data.
And most of all, thanks to my university, help me get these favorable conditions and
suitable environment to complete my research.
2
ABSTRACT
Estimation of forest canopy cover has recently been included in many forest inventory
programmes. In this study, after discussing how canopy cover is defined, different groundbased canopy cover estimation techniques are compared to determine which would be the
most feasible for a large scale forest inventory. to quantify canopy cover and the estimates
they provide vary greatly. In this here, to collect the data we use three main method for
estimating canopy cover ratio (Differences in cover estimates among the ground-based
methods were not related to stand-structure type p = 0.33). As expected, estimates of cover
increased and stand-level variability decreased with increasing angle of view among
techniques.
The results indicate that different techniques yield considerably different canopy cover
estimates and through result of compare we can choose a suitable method and most accurate
for measuring forest cover.
3
TABLE OF CONTENT
ACKNOWLEDGEMENTS
ABSTRACT
TABLE OF CONTENT
LIST OF TABLES
LIST OF FIGURES
CHAPTER 1. INTRODUCTION ............................................................................................. 47
CHAPTER 2. LITERATURE REVIEW .................................................................................. 50
CHAPTER 3. STUDY GOAL, OBJECTIVES, SCOPE OF THE STUDY AND
METHODOLOGY ................................................................................................................... 53
3.1. STUDY GOAL, OBJECTIVES ........................................................................................ 53
3.1.1. Goals: .............................................................................................................................. 53
3.1.2. Specific Objectives: ........................................................................................................ 53
3.2. SCOPE OF THE STUDY ................................................................................................. 53
3.2.1. Geographical location, Topography in Luot mountain .................................................. 53
3.2.2. Terrain ............................................................................................................................ 54
3.2.3. Climate Conditions ......................................................................................................... 54
3.2.4. Soil Conditions ............................................................................................................... 55
3.2.5. Plot location, Maps ......................................................................................................... 55
3.3. CONTENTS AND METHODOLOGY ............................................................................ 55
3.3.1. Research Content ............................................................................................................ 55
3.3.2. Methodology................................................................................................................... 56
CHAPTER 4. RESULTS AND DISCUSSION ....................................................................... 65
4.1. SURVEY RESULT AND DISCUSSION OF PLANTATIONS IN LUOT MOUNTAIN,
XUAN MAI, CHUONG MY, HA NOI ................................................................................... 65
4
4.1.1. Diameter and Height Frequency distributions ................................................................ 65
4.1.2. Comparison of tree growth between sample plot 1, plot 2 and plot 3 ............................ 67
4.2. THE RESULT AND DISCUSSION COMPARISON OF THREE METHODS TO
DETERMINE CANOPY COVERAGE IN LUOT MOUNTAIN, XUAN MAI, CHUONG
MY, HA NOI. ........................................................................................................................... 69
4.2.1. The result and discussion comparison of three methods. ............................................... 69
4.2.2. Compare, selectection and explain why choose method to determine canopy coverage
in Luot Mountain, Xuan Mai, Chuong My, Ha Noi ................................................................. 76
CHAPTER V. GENERAL CONCLUSION AND RECOMMENDATION............................ 79
5.1. Conclusion ......................................................................................................................... 79
5.2. Recommendation ............................................................................................................... 80
REFERENCES
5
LIST OF TABLES
Table 3.2.4. List of the coordinates of three sample plot by GPS
Table 4.1.1. List of the results of the plot data collection of three sample plot in Luot
mountain, Xuan Mai, Chuong My,Ha Noi
Table 4.2.1. List of the results of the Canopy Coverage and standard error of three methods in
Luot mountain, Xuan Mai, Chuong My,Ha Noi
6
LIST OF FIGURES
Picture 3.2.1: 1st Intersection in Luot mountain, Vietnam national university of forestry
Figure 3.2.5: Map of three sample plot location in Luot mountain, Xuan Mai, Chuong My,Ha Noi
Figure 3.3.2.3.1: Plot establishment
Figure 3.3.2.3.2: Profile diagram pattern
Picture 3.3.2.3.3: Sequence of steps during field image analysis.
Picture 4.2.1.3.1: Vertical and Cross profile in sample plot 1
Picture 4.2.1.3.2: Vertical and Cross profile in sample plot 2
Picture 4.2.1.3.3: Vertical and Cross profile in sample plot 3
Appendix A: Table
Appendix B: Figure
7
CHAPTER 1
INTRODUCTION
Have you ever thought about of how forests have affected your life today: Have you
had your breakfast? Read a newspaper? Switched on a light? Travelled to work in a bus or
car? Signed a cheque? Made a shopping list? Got a parking ticket? Blown your nose into a
tissue? Forest products are used in our daily lives and, all the activities listed above directly or
indirectly involve forests. The importance of forests cannot be underestimated. We depend on
forests for our survival, from the air we breathe to the wood we use. Besides providing
habitats for animals and livelihoods for humans, forests also offer watershed protection,
prevent soil erosion and mitigate climate change. So, how do you know about the forest?
First of all, we need to know the concept of forest. According to the international
definition of a forest is based on canopy cover: the United Nations Food and Agricultural
Organization (FAO) has defined forest as land of at least 0.5 ha with potential canopy cover
over 10% and potential tree height of at least five meters. According to the United Nations
Food and Agriculture Organization, forests covered an four billion hectares (16 million square
miles) or approximately 30 percent of the world's land area in 2006.
To control and protect the forest, firstly we must always understand data on forests
that mean the canopy coverage of forest is large or small, to say that the current situation as
well as the risk that forests are encountered. So, what is the canopy cover ratio?
Canopy coverage, defined here as the proportion of the forest floor covered by the
vertical projection of the tree crowns, should be distinguished from canopy closure, which is
defined as the proportion of sky hemisphere obscured by vegetation when viewed from a
single point.
Estimation of forest canopy cover has recently become an important part of forest
inventories. Throughout history there have been very many methods from handmade to
modern to measuring canopy cover ratio, depending on the environment, climate or
topography around to provide the best measurement method. For example handmade methods
such as measuring 100 points, profile diagram or ocular estimation methods until modern
methods such as estimates as used fisheye or satellite to determine canopy coverage. Each
method has advantages and disadvantages different, such as ocular estimation methods of
canopy cover, ocular estimates are always subjective, and the results can vary even with
changing weather. Objectivity can be increased in the process by dividing the plot into smaller
sections and counting the average of estimates made for each section. Especially especially
depends very much on the observer or the external factors (wind, clouds or the height of the
observer ..) or a method for high accuracy but high cost such as using Fisheye to determine
canopy coverage. This method is modern, but this tools is hard to find because very expensive so
its very few in Vietnam. Moreover, its very big, cumbersome to bring on forest to determine.
In this my research, I would like to introduce three methods to determine canopy
coverage including handmade method and morden method, which is using GLAMA (Gap
light analysis mobile app), 100 point, profile diagram methods.
The first method is a using 100 points to determine canopy coverage. Based on the
sample plots have been established earlier, we will measure exactly 100 points is divided
equally on this sample plot. Total points measured we will have the results of the canopy
coverage and based on criteria about canopy cover ratio, we will assess the extent of closed
canopy (or vice versa is the level of broken forest canopy). Through that we can be used as a
basis to make decisions when choosing silvicultural practices. This methods is handmade,
relatively safe, with high accuracy, but waste time and effort to complete measurement process.
A simple method is applied extensively to determine and indicate second floor of
forest is Cross sectional profile of David and Richards (1952). This is also handmade method
and quite simple, based on trees data collection was gathered, we observe and simulation on
grid paper, from which we get the canopy coverage.
The last method that I want to mention that is using sofware GLAMA ( Gap light
analysis mobile app) on cell phone. The first method was conducted measurement on a
cellphone used android OS. A program for calculation of the Canopy Cover Index estimating
canopy cover from hemispherical photographs. The program, which is freely accessible from
the Google Play website, can be used for hemispherical, wideangle and standard photographs
(with known lens angle of view). The program was primarily designed for use in the field, but
can also analyse hemispherical photographs saved onexternal storage. The Canopy Cover
Index is a quick and robust method for precise canopy cover estimation comparable to visual
canopy cover estimation but unaffected by observer bias. Not only can it be used on alreadycaptured photographs, but the index can also be employed on smartphones by using the GAP
LIGHT ANALYSIS MOBILE APP (glama) Android application to rapidly capture
hemispherical photographs and immediately calculate their index values directly in the field.
In this paper, i will determine canopy coverage in Luot mountain, Xuan Mai, Chuong
My, Hanoi. In this study area, i will establish 3 sample plot and measure all three methods on
each sample plot. From 3 as a result of that approach, I will compare the data on the
implementation process as well as to introduce to people from all their research will be to
select the best method as well as handy to measure forest canopy cover. From the result of
three method that i mention, i will compare the data collection as well as the implementation
process measurement to select the best method as well as most convenient to determine
canopy coverage.
CHAPTER 2
LITERATURE REVIEW
Forests cover about 30% of the earth‟s mainland, and the surfaces of forest canopies
are the main gateways regulating the exchange of energy, carbon and water vapour between
terrestrial ecosystems and the atmosphere (FAO 2001; Law et al. 2001; Parker et al. 2004).
The structure of a forest canopy influences the quantity, quality and spatial and temporal
distributions of light in the stand, which in turn affects the presence or absence of ground
vegetation and influences temperature, relative humidity, and the physiological activity of tree
organs (leaves, fruits, woody organs) and many other organisms within a forest (Jennings et
al. 1999; Kobayashi and Iwabuchi 2008).
Forest canopy plays an important part in forest stand dynamics and wildlife
habitability (Reid 1964, Hendrick et al 1968, and Pase 1958), yet the determination of its
condition is often confusing and misinterpreted, even among professionals. Sunlight reaching
the forest floor is an important component of forest microhabitat. There is a relationship
between tree overstory and herbaceous production (Jameson 1968). These forest floor
characteristics are important to wildlife and general forest biodiversity.
To date, Vietnam has more than 13 million ha of forest, 10 million of which is natural
forest and 3 million is plantation forest. Its forest cover amounts to 40.2% (2011), classified
into three categories: production forest (6.3 million ha), protection forest (4.8 million ha) and
special-use forest (almost 2 million ha); (Forest Trends Information Brief 2012).
The terms “canopy cover” and “canopy closure” are two common terms used to
describe forest canopy conditions. Although these two terms are implying distinct
characteristics of forest canopy, they are often used synonymously and incorrectly. Canopy
closure is defined as the proportion of the sky‟s hemisphere obscured by vegetation when
viewed from a single point (Jennings et al 1999; Zhu et al 2003) and canopy cover is
understood to be the vertical projection of the forest floor that is obscured by forest canopy
(Jennings et al 1999; Zhu et al 2003)
Currently there are many study authors about methods of measuring forest canopy.
Such as the price of a LAI information for a forest plot, would not be useful. First, the
different resolutions of the instruments would have to be brought in conformity, which is very
difficult. Secondly, the price of time and work needed to gain the data differs with the
operator‟s qualification and boundary conditions, such as carrying cost and the consumption
of expendable materials. Instrument prices are subject to change, but using relative price
classes will help get an overview of the necessary investments (Dominik Seidel & Stefan
Fleck 2011) The most inexpensive instruments are the Moosehorn (Smith et al. 2008),
densiometers (Englund et al. 2000), the cameras for the photographical approaches (Englund
et al. 2000), the equipment for the point quadrat methods (Aber 1979) and allometric
approaches especially for large areas using formulas from the literature (Botkin et al. 1993).
Using litter traps is already more expensive, not because of the material needed to construct
them but due to the fact that they require inspection and service by an employee throughout
the year. The harvest approaches are expensive more due to their laborious character than
because of the instruments needed. The instrument price increases in relation to the
employee‟s wages when using the MVI, DEMON, TRAC or the instruments measuring the
radiation. Even more expensive is the LAI-2000. By far, the biggest investment is the TLS,
which is about 50–80 times the price of a hemispherical camera.
Depending on the aim of the study, different compromises concerning the used
methods appeared to be inevitable. Each method has been proven to be useful and has shown
its advantages and disadvantages. The demand for new methods is always connected with
open research questions, new fields of investigation or new findings (Dominik Seidel &
Stefan Fleck & Christoph Leuschner & Tom Hammett 2011). The increasing relevance of the
3D structure of forest canopies for current research tasks, especially in ecology, generates a
rising need for instruments offering detailed spatial information (Lovell et al. 2003; Parker et
al. 2004; Takeda and Oguma 2005; Pretzsch and Schütze 2005).
During recent years much methods has existed among technicians concerning the use
of different methods in research selection method to determine canopy coverage. These
methods have been developed to minimize personal error and cost of application. However, it
appears that many have minimized cost of operation at the expense of accuracy and others
have over-emphasized accuracy. A method suitable to measure some characteristics of
vegetation may be totally inadequate to measure others. Therefore, the method must
frequently be modified to obtain maximum accuracy with reasonable cost.
CHAPTER 3
STUDY GOAL, OBJECTIVES, SCOPE OF THE STUDY AND METHODOLOGY
3.1. STUDY GOAL, OBJECTIVES
3.1.1. Goals:
Additional knowledge about forest cover and proficient use methods to
measurement of canopy cover ratio.
Knowed about the condition of forests and forestry in the dusty mountains (Review
process and the formation of sub-level forest conditions. in nature canopy affect the number
(of species , density ...) and quality of regeneration (ratio tree good / bad, regeneration rate
prospects, composition purpose trees ...)
Recommend some appropriate solutions to increase forest cover than before
3.1.2. Specific Objectives:
Objective 1: Try to understand what is forest cover and additional knowledge about
forest cover
Objective 2: proficient use three methods and pointed out the advantages and
disadvantages of using three method to determine canopy coverage in Luot mountain.
Objective 3: Propose the most appropriate method from 3 methods previously
measured and explain why choose this method in study areas.
Objective 4: propose appropriate solutions to increase the canopy cover ratio in
plantations forest in Luot mountain through the results collected.
3.2. SCOPE OF THE STUDY
3.2.1. Geographical location, Topography in Luot mountain
This plantation forest is located in the Xuan Mai town, Chuong My district, Ha Noi.
Xuan Mai town is the cross section of Road No.6 and Road No. 21A. The West and the North
site near Luong Son district, Hoa Binh Province; The East and the South site near Thuy Xuan
Tien town, Chuong My district.
Geographic coordinates:
20o50‟30” North latitude
105o30‟45” East longitude
The total area of Luot mountain forest is about 133 hectares. It is the experimental
forest of Vietnam National University Forestry.
3.2.2. Terrain
Luot mountain includes 2 low hills with the highest peak is 133m, another peak is
76m above the sea.
The average slope is 15o and the most slope area is about 27o and do not have any
stream found in this area.
3.2.3. Climate Conditions
The average precipitation in Luot mountain is 146mm. The rainfall disposes
unsteadily in one year.
The average air temperature is 23.2oC and different in 4 seasons: Spring, Summer,
Autumn and Winter.
The humidity is different in each season, it‟s dry in Winter and wetter in Summer.
The average humidity is 84%
3.2.4. Soil Conditions
The main kind of soil in Luot mountain is Ferralsols soil with the pH <7. The structure
of soil in here is very tight, especially in the surface.
3.2.5. Plot location, Maps
Investigated three location in this study area in Luot mountain corresponding to three
standard plots. each plot has an area of 500 square meters and take the coordinates of each
plot by GPS and the results are shown in the table below:
Plot
1
2
3
X
20.54509
20.54503
20.54525
Y
105.34208
105.34125
105.34232
Table 3.2.4. List of the coordinates of three sample plots by GPS
3.3. CONTENTS AND METHODOLOGY
3.3.1. Research Content
Objective 1: Investigation the data collection in Luot mountain include: The number
and the name of the species, diameter at breast height (towards East-West and North-South),
Total height of trees, under height of trees, crown diameter (towards East-West and NorthSouth), and quality of trees. Which have the bole is large than 6 cm.
Objective 2: Using three method: software Glama, 100 point method and Draw
measures method to determine the canopy cover ratio in Luot mountain.
Rated canopy cover rate and compare in each standards plot
Statistical canopy cover rate via the results of three methods
Overall assessment of the situation plantation in Luot mountain through
achievements and explain why
Objective 3: Propose the most appropriate method from 3 methods previously
measured and demonstrate why choose this method in study areas.
Pointing out the most accurate method from 3 methods above (via data previously
collected)
Stating the usability of selected methods and explain why choose this method.
Objective 4: propose appropriate solutions to increase the canopy cover ratio in
plantations forest in Luot mountain through the results collected.
Strive to increase canopy cover ratio than the previous by: actively protect crops,
planting more trees, keep the plants in good environment, environmental protection, disaster
prevention, regulating water sources, conservation of genetic resources and biological
diversity of forests. To the forest is more lush not only in terms of area covered but also the
quality of forests, there should be effective measures. appropriate new policies to promote
forest conservation and sustainable development, while raising awareness about the value of
forests for life to actively participate in forest protection and reforestation.
3.3.2. Methodology
3.3.2.1. Prepare fieldwork area
Selecting the survey area on the map and in the field.
Divide the region chose to several key habitats
Make some online-survey, surveillance in the region.
3.3.2.2. Prepare tools and materials
- Using some tools to collect data:
Diameter measurement: Calipers
Calipers are the tools to measure diameter of the tree. Each caliper have 2 arms: Fixed
arm and moveable arm. We set the calipers perpendicular to the stem axis, change the
moveable arm suitably and read the results (to ensure that the 2 side of caliper are tight
against the stem). We measured 2 directions: West – Easth and South – North and took the
average.
Height measurement: Blume Leiss
Blume leiss is the tools to measure the height of the tree. In Blume Leiss, we had 15,
20, 30 or 40 meters horizontal distance from the base of the tree.
First, we select the suitable distance (about 15 – 20 meters) where we can see both top
of the tree and base of that tree.
Second, we use Blume leiss to measure the top of the tree. Release the pointer by
pressing small button in the side of Blume leiss. Sight at top of the tree, wait for moment to
ensure that the pointer stop moving and pull the triggle. Read the result.
We measure the base of the tree with the similar way above and read the result.
If two results that the pointer pointed in the same side. We subtract two results. The
final number is the height of that tree.
If two results that the pointer pointed in two side. We plus two results. The final
number is the height of that tree.
Measure crown diameter: 50 meter linear tape
We use linear tape to estimate the crown diameter of the tree. 2 persons hold 2 sides of
linear tape and standing parallel with the crown in West – East direction and read the results.
Do again with South – North direction. The crown diameter is the average of 2 gained results.
Linear tape can be used in the circumstance that we do not have any calipers to
measure the diameter of the tree. We can roll the tape to the stem, take the results and devide
that results by π (3.1416) The final results is the diameter of tree.
- With method using software: Program GLAMA (Gap Light Analysis Mobile App )
of smartphone has Android Operating System
3.3.2.3 Data collection method:
Field work:
Set up plots on survey line:
Set up sample plot
Number of plot: 3
Shape: Rectangular
Size: 500 square meter (20x25)
Location: Luot mountain
In this study area choose three different location in Luot mountain corresponding to
selected 3 typical locations in the study area to set up 3 standard plots corresponding to plots
(Plot 01; Plot 02; Plot 03).
The typical sample plot is 500 square meter, the plot size is rectangular with the size is
20x25m. The longer size is parallel with the contour line. The plot are established by using
polyme tapes.
Measured 2 tapes with the size 20m and 2 tapes with the size 25m. After that, made
the plot with four 90 degrees corners. After setting up plot, set up 5 subplots with the size is
2x2m in this study area. Boundaries of plot are defined by 4 wood stakes at 4 corner of each
plot and after that stretched a cord around 4 stakes to recognize each plot.
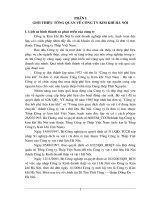
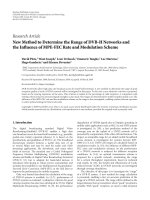
Figure 3.3.2: Plot establishment
In each plant community I set up 3 plots and determined the species component, the
number of each species and total number of trees. The information was recorded:
+) Number of sample plots, the area of survey plots, and date of investigation,
investigator and distance to edge (m)…
+) Measuring trees density (trees/plot), tree height, canopy height, canopy diameter of
all wood trees having D1.3≥ 3cm and location of trees in plots.
Marking point by GPS
We use GPS to take the location of the point by longitude and latitude. After marking
point, we can add to ArcGis and get the clear data in the satellite map images.
For three method:
Using 100 point method:
In each sample plots is divided into 10 different transect and parallel with the contour
line, in each transect separated by 2 meter. On each transect is divided into 10 point and each
of point separated by 2.5 meter.
At each measurement point, using A4 paper. Curled paper A4 with diameter is 3
centimeters and looked up at the trees:
Note 1 if seen purely canopy
Note 0.5 if seen one half of the canopy and one half is space
Note 0 if seen absolutely no canopy
Profile diagram method:
In each sample plots, chooses one typical forest strip to draw. Area‟s strip is 10m x
25m (25m is length of plot paralleling with the contour line and 10m is depth) with the rate of
1/100. Profile diagram is drawn based on method of Richards P.W and Davis T.A.W (1952).
All of the tree has their diameter breast height greater than or equal to 6cm are
determined original coordinates with forest range, these plants is measured: diameter at breast
height (towards East-West and North-South), Total height of trees, under height of trees,
crown diameter (towards East-West and North-South). All locations of the tree, the total
height and under crown height, the crown diameter (attach name of species) are taken on a
vertical plane on Grid paper at the rates 1/200 and was painted simulation at the scene.
Standing profile: draw the near trees first and the far trees after, the trees in front are
drawn solid lines and the trees in behind are drawn disjointed lines.
Cross profile: draw tree canopy on all plot area, the highest trees are drawn solid lines
and shorter trees are drawn disjointed lines.
To draw profile diagram, we need to measure tree index as trees height, trees canopy
in 2 directions (South North- East West), coordinate trees (distance between stumps with 2
sides of plot) and shape of trees. Name of trees drawn on profile diagram should be noted on
tree canopy (note if name of trees abbreviate).
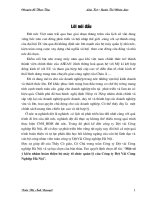
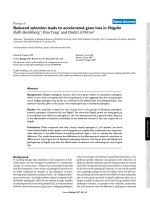
H, m
20
Vertical section
10
The origin
25 m
0m
4.0 m
Pinus
15m
Acaia
Cross section
Figure 2. The vertical and horizontal method of charting which areas of forest plantation in
Luot mountain.
Tree symbol name: Acacia (Acacia mangium), Pinus (Pinus kesiya) ...
Take photograph and collect necessary specimens in investigation process in order to
analysis and assess scientific name.
Using Glama software:
In this method, each sample plots is divide 5 transect parallel with the contour line,
and each transect spaced 5m. In each transect, divided 6 point, each point spaced 3.3m.
I will measure 30 points in each sample plots, so with three sample plot, and total, i
will measure 90 points on this method.
About instrument, with smartphones by using the GLAMA Android application to
rapidly capture hemispherical photographs and immediately calculate their index values
directly in the field.
How to install the applicationinstalled applications:
Android Operating System: Open the official Google Play web address:
and install the program
automatically to your device.
WINDOWS Operating system: If using a PC operating in Windows, this Android
application should be installed to any Android emulator. Of these, I have had experience
using BlueStacks, which supports running the program directly on a PC for a posteriori
analysis of photographs captured by a camera in the field.
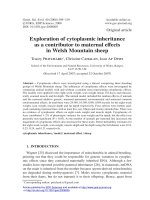
Manual
The process of image analysis in the field starts after selection of the From camera
button (Fig. 3A) – the photograph is then taken (Fig. 3B and 3C). The camera must be held in
the horizontal position, pointed upwards. Most smartphones have a built-in camera both on
front and rear side of the phone. It does not matter which camera will be selected. It is then
possible to rotate or flip the taken photograph (Fig. 3D). On photographs taken with a narrowangle lens the definition of the hemispherical border has not relevant (Fig. 3E). The
hemisphere centre and diameter are usually defined using the first photograph (Fig. 3F). Also,
lens projection is important for correct estimation of the Canopy Cover Index (Fig. 3G).
Lenses of built-in cameras usually have a polar projection (the shortest distance between two
different angles is the same in each part of the photograph), while external fisheye lenses can
have angular projection (the shortest distance between two different angles is smaller at
higher zenith angles). A defined artificial mask (in our example 69°) helps to make the
photograph independent from camera orientation (Fig. 3H), because the photograph uneven
width and height is restricted by a circle with the same distance from its centre. This page also
supports a selection of the level of precision (how many pixels from the photograph will be
analysed) and colour channels (red and blue colours do not penetrate through the vegetation).
Final definition of light gaps (Fig. 3I) depends on the proper selection of a cut level between
„white‟ and „black‟ pixels. The final result is presented in the Results page (Fig. 3J).
Fig. 3.3.2.3.3: Sequence of steps during field image analysis.
In this work is very easy to do. You can go to the Forest and take photograph and then
analyze the result were obtained in your phone
Note:
Remember or record hemisphere diameter and recommended angle of horizon mask
for their next use in the calculation process. The hemisphere diameter can be defined using
either of two display layouts: 1) In the page with definition of hemisphere borders, the central
”X” button must be pressed. The circle will be centred and a query will ask for the circle
diameter; or 2) the second option is in the page with the definition of the horizon mask, where
hemisphere diameter can also be edited.
Moving between pages is also possible in both directions by moving a finger
through the display to the left or right.
Should be measured when the weather is more sun to achieve high accuracy
3.3.2.4. Data analysis methods:
Descriptive Statistical table about the data collection include: tree data collection,
glama and 100 point measured on the three sample plot.
Assessing scientific name: by the method of morphological comparisons between
specimens collected with documents related to plant such: Vegetation of Vietnam (Pham
Hoang Ho, 1999-2000), Forest tree name of Vietnam (Vu Van Dung, 1996), Plants in
mongroves of Vietnam (Nguyen Hoang Tri, 1996)...
Analyze and evaluate the data obtained, compare the results with each other base on
the targe of canopy coverage:
Through these values denote canopy coverage can assess the extent of closed canopy
(or vice versa is the level of broken forest canopy) which can serve as basis to make decisions
when choosing the solution silviculture . Indicators of canopy coverage is divided as follows:
Canopy cover ratio has :
From 0,9 to 1: Is very high, has light-tight canopy
From 0,7 to 0,8: Has high canopy cover ratio
From 0,5 to 0,6: Has medium canopy cover ratio
From 0,3 to 0,4: Is low canopy cover ratio
Canopy cover smaller than 0,3: Mean the forest is broken canopy and broken forest
conditions
Analyze data by excel 10.0 software
To calculate the canopy of coverage
With profile diagram we have:
With: C is blanks were counted in picture, are conventional as follows: 1 grid in paper = 1cm
Two remaining methods we use Excel functions to calculate the canopy cover ratio.