Remote sensing and gis application for forest change detection in kim tien commune kim boi district hoa binh province
Bạn đang xem bản rút gọn của tài liệu. Xem và tải ngay bản đầy đủ của tài liệu tại đây (1.02 MB, 72 trang )
MINISTRY OF AGRICULTURE AND RURAL DEVELOPMENT
VIETNAM NATIONAL UNIVERSITY OF FORESTRY
STUDENT THESIS
REMOTE SENSING AND GIS APPLICATION FOR FOREST CHANGE
DETECTION IN KIM TIEN COMMUNE, KIM BOI DISTRICT, HOA
BINH PROVINCE
Major: Natural Resources Management
Code: D850101
Faculty: Forest Resources and Environmental Management
Student: Nguyen Thi Hue
Student ID: 1453091261
Class: K59B Natural Resources Management
Course: 2014 – 2018
Advanced Education Program
Developed in collaboration with Colorado State University, USA
Supervisor: Assoc. Prof. Tran Quang Bao
Hanoi, 2018
TABLE OF CONTENTS
ACKNOWLEDGEMENT ......................................................................................................... 3
ABBREVIATIONS ................................................................................................................... 4
LIST OF TABLES ..................................................................................................................... 5
LIST OF FIGURES ................................................................................................................... 6
ABSTRACT ............................................................................................................................... 1
Chapter I..................................................................................................................................... 1
INTRODUCTION ..................................................................................................................... 1
Chapter II ................................................................................................................................... 3
LITERATURE REVIEW .......................................................................................................... 3
2.1 General information ......................................................................................................... 3
2.2 Development of remote sensing and GIS ........................................................................ 4
2.3 Features of Landsat images .............................................................................................. 5
2.4 Remote sensing and GIS application ............................................................................... 8
2.4.1 Agriculture ................................................................................................................ 8
2.4.2 Forestry ..................................................................................................................... 9
2.4.3 Urban planning........................................................................................................ 10
2.4.4 Land cover mapping ............................................................................................... 10
Chapter III ................................................................................................................................ 11
OBJECTIVES AND METHODOLOGY ................................................................................ 11
3.1 Objectives ...................................................................................................................... 11
3.2 Methodology .................................................................................................................. 11
3.2.1 Study site ................................................................................................................. 11
3.2 Methodology .................................................................................................................. 12
3.2.1 Data sources ............................................................................................................ 12
3.2.2 Interviewed data ...................................................................................................... 13
3.2.3 Data processing ....................................................................................................... 14
3.2.4 Image classification using NDVI ............................................................................ 16
3.2.5 Field survey............................................................................................................. 17
Chapter IV ................................................................................................................................ 20
NATURAL AND SOCIAL-ECONOMIC CONDITION ....................................................... 20
4.1 Natural condition ........................................................................................................... 20
4.2 Social-economic condition............................................................................................. 23
Chapter V ................................................................................................................................. 30
RESULT AND DISCUSSION ................................................................................................ 30
5.1 Forest cover in Kim Tien in the period 1995 – 2018 ..................................................... 30
5.1.2 NDVI of study area ................................................................................................. 30
5.1.3 Forest Cover in Period 1995 - 2018 ........................................................................ 31
5.1.4 The accuracy of classified forest map ..................................................................... 33
5.2 Forest cover change detection in study site from 1995 to 2018 .................................... 38
5.2.1 Forest change detection from 1995 to 2002 ............................................................ 38
5.2.2 Forest change detection from 2002 to 2011 ............................................................ 40
5.2.3 Forest change detection from 2011 to 2018 ............................................................ 42
5.2.4 Forest change detection from 1995 to 2018 ............................................................ 44
5.3 Driving forces of forest cover change ............................................................................ 46
5.3.1 Forest increase ........................................................................................................ 46
5.3.2 Forest decrease ........................................................................................................ 47
5.4 Solutions for forest protection and management ........................................................... 49
5.4.1 Strengthen forest management and protection ........................................................ 49
5.4.2 Support local people on forest plantation and improving their livelihoods ............ 49
5.4.3 Raise awareness of local people in forest protection .............................................. 50
5.4.4 Increase investment on forest protection and afforestation projects ....................... 50
5.4.5 Enhance technological application in forest protection and management .............. 51
Chapter VI................................................................................................................................ 52
CONCLUSION, LIMITATION, FURTHER STUDY ............................................................ 52
6.1 Conclusion ..................................................................................................................... 52
6.2 Limitation and further study .......................................................................................... 53
APPENDIX 1 ............................................................................................................................. 1
APPENDIX 2 ............................................................................................................................. 4
REFERENCES .......................................................................................................................... 1
ACKNOWLEDGEMENT
This thesis would not have been possible without the support and help from several
people. I would like to express our special appreciation of following people who supported
me with my sincere gratitude:
I would like to express my sincere thanks and appreciation to my supervisor Dr. Tran
Quang Bao for his encouragement untiring and excellent guidance, valuable suggestions in
my thesis. His comments and advices have helped me to finish my thesis.
I would like to thank the teachers in Vietnam National University of Forestry who
have imparted us the knowledge to perform this topic.
I am also thankful to Prof. Lee MacDonald for his enthusiasm in guiding me to
construct thesis proposal.
I would like to express my gratitude to the Head of commune for support and giving
me chance to study in commune. Besides, I also thank the local authorities, people for
providing me valuable time and information for my study.
Last but not least, I want to give my gratitude to my parents who always encourage
and support me.
Hanoi, 5 October 2018
Hue
Nguyen Thi Hue
ABBREVIATIONS
CGIS
Canadian Geographic System
ERS
European Radar Satellite
ERTS
Earth Resources Technology Satellite
ESRI
Environmental Systems Research Institute
ETM+
Enhanced Thematic Mapper Plus
GIMMS
Geographic Information Mapping Manipulation System
GIS
Geographic Information System
GPS
Geographic Position System
MSS
Multispectral Scanner System
MTL
Metadata
NASA
National Aeronautics and Space Administration
NDVI
Normalized Difference Vegetation Index
OLI
Operational Land Imager
SPOT
Satellite Pour l’Observation de la Terre
SYMAP
Synagraphic Mapping System
TIRS
Thermal Infrared Sensor
TM
Thematic Mapper
LIST OF TABLES
Table 5.1: The categories classification framework ................................................................ 35
Table 5.2: The accuracy of classification method in 1995 ...................................................... 35
Table 5.3: The accuracy of classification method in 2002 ...................................................... 36
Table 5.4: The accuracy of classification method in 2011 ...................................................... 36
Table 5.5: The accuracy of classification method in 2018 ...................................................... 37
Table 5.6: Forest cover change in the period 1995-2002......................................................... 38
Table 5.7: Forest cover change in the period 2002-2011......................................................... 40
Table 5.8: Area of forest cover change in the period 2011-2018 ............................................ 42
Table 5.9: Forest cover change in Kim Tien in the period 1995-2018 .................................... 44
LIST OF FIGURES
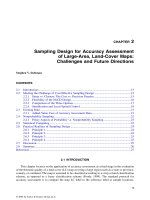
Figure 3.1: Map of study site ................................................................................................... 11
Figure 3.2: Landsat image of study site in 1995, 2002, 2011, 2018 ........................................ 13
Figure 3.3: Landsat processing and classification ................................................................... 15
Figure 5.1: NDVI classification of Kim Tien commune ......................................................... 31
Figure 5.2: Forest distribution in Kim Tien in 1995, 2002, 2011, 2018 .................................. 32
Figure 5.3: Chart of area of land use types in Kim Tien over period 1995-2018 .................... 33
Figure 5.4: Map of ground true points distribution in 2018 .................................................... 34
Figure 5.5: Map of forest cover change in Kim Tien in the period 1995-2002 ....................... 39
Figure 5.6: Chart of forest cover change in Kim Tien in the period 1995-2002 .................... 39
Figure 5.7: Map of forest cover change in Kim Tien in the period 2002-2011 ....................... 41
Figure 5.8: Chart of forest cover change in the period 2002-2011 .......................................... 41
Figure 5.9: Forest cover change in Kim Tien in the period 2011-2018 ................................... 43
Figure 5.10: Chart of forest cover change in Kim Tien in the period 2011-2018 ................... 43
Figure 5.11: Map of forest cover change in Kim Tien in the period 1995-2018 ..................... 45
Figure 5.12: Chart of forest cover change in the period 1995-2018 ........................................ 45
ABSTRACT
Remote sensing technology and GIS are considered as an effective and objective tool
in monitoring and evaluating environmental resources, especially in the determination of
forest area fluctuations. In this study, Landsat 5 TM satellite images in 1995, 2002, 2011 and
Landsat 8 OLI/TIRS in 2018 of Kim Tien, Kim Boi were used to classify and identify areas
of forest change, degraded forest and rehabilitated forest. NDVI (Normalized difference
vegetation index) method was chosen to classify the information from satellite image. The
accuracy of image classification method given 84.35% in 2018, 81.75% in 2011, 80% in
2002 and 75.65% in 1995. This result shows that, image classification using NDVI method
combined with field survey had provided high accuracy to construct forest change in case of
lacking of data to examine historical images. The study has constructed a database on forest
land and forest status maps for 1995, 2002, 2011, 2018; maps of forest change during periods
1995 – 2002, 2002 – 2011, 2011 – 2018 in Kim Tien commune. The result show that, from
1995 to 2018, an area of forest land had gone down about 208.17ha.
The study also shows that the difficulty of forest protection management in the
commune by poor people’s lives, people are not fully aware of the responsibility for forest
management and forest protection, the weakness in forest management network of the
commune. On this result, the study has recommended some solutions for better forest
management, include: Strengthening forest management and protection, raising awareness of
local people in forest protection and enhancing the applications of technology
Chapter I
INTRODUCTION
Forest plays a significant role in environmental protection. Forests are important
renewable natural resources and have an important role in preserving an environment suitable
for human life. It participates in air regulation, absorbs carbon dioxide and releases oxygen,
provides fresh air. Forest restricts flood, drought, prevent erosion and landslide. It also
provides shelter, food source of many wildlife animals. In Vietnam, forest represents the
characteristics of tropical rainforest. In the past, forest area was declined seriously. According
to the forest inventory and planning institute, from 1979 to 1990 natural forest declined 2.7
million hectares account for 1.7%/year. In period 1999- 2005, the area of rich natural forest
decreased by 10.2% and the medium forest decreased by 13.4% (Hanoi Association for forest
plantation and ecological protection, 2010). The main reasons of that status are, illegal
logging, conversion of forest to agricultural land. In recent years because of forest plantation
and protection policies of the government, forest cover has increased significantly. Forest
cover in 2016 is 41.19% (MARD, 2016).
Nowadays, the development of technology of earth observation satellite, remote
sensing imagery and geographic information systems have proposed applications in many
field of science and management. In natural resources and environmental management, they
support human in construction, management and storage database. Natural resource
management involved in forestry sector. Currently many state, and private forestry agencies,
governments are implemented Geographic Information Systems (GIS) and remote sensing
(RS) for various applications. Geographic data with spatial dimensions is useful for
understanding ground conditions, also useful for strategic decisions. Remote sensing
techniques used to investigate changes in land use land cover in the field of forestry. Remote
sensing technology is very useful for analyzing change detection and mapping of the land
1
cover of the forest, culture data extraction. Satellite data has multi-time, multi-resolution,
covers huge area quality to help us collect information quickly without directly contact. The
using of high resolution remote sensing images in resource management has been a new
direction for planning natural resource. Landsat program consists of a series of remote
sensing satellites developed by NASA which provide since 1972 for land monitoring. Since
1972, there has been eight Landsats were launched: Landsat-1, Landsat-2, Landsat-3,
Landsat-4, Landsat-5, Landsat-6, Landsat-7 and Landsat-8. Landsat acquisition over million
images of all place in the world, and millions of images were downloaded. Given the huge
availability of Landsat data, land cover monitoring is affordable and reliable.
GIS and remote sensing provide scientific and reliable data that traditional mapping
method can not do. With the requirement of updating quickly, high accurate information
about change of forest cover, the application of GIS and remote sensing is necessary for
today and the future. Besides that Kim Tien is a part of buffer zone of Thuong Tien Natural
Reserve that used to be a problem area about uncontrolled harvest forest, and now there is no
research about forest land in the area. Because of this reasons I have this study “Remote
sensing and GIS application for forest change detection in Kim Tien commune, Kim Boi
district, Hoa Binh province from 1995 to 2018”.
2
Chapter II
LITERATURE REVIEW
2.1 General information
Remote sensing is the science and art of obtaining information about an object, area
or phenomena through the analysis of data acquired by a device that is not in directly contact
with the object, area or phenomena. This process consists of making observations using
sensors mounted on platform (satellites, airborne,…). The nature of remote sensing is
technology that identifies and recognizes objects or environmental conditions through their
own reflective or electromagnetic characteristics. However, magnetic field and gravity field
are also used. Remote sensing uses aerial images or satellite images to collect information.
There are three common remote sensing methods are by airplane, satellite and drone. These
methods can provide detail information about Earth’s surface, natural resources as well as
environmental condition.
Geographic information system (GIS) is a computer application designed to perform a
wide range of operations on geographic information. Geographic information is defined as
information about locations on or near the surface of the Earth. A geographic information
system (GIS) is a framework for gathering, managing, and analyzing data. GIS integrates
many types of data. It analyzes spatial location and organizes layers of spatial information
into visualizations using maps and 3D scenes, it describes the spatial relationship between
them. GIS discovers deeper insights into data, such as patterns, relationships, and situations,
helping analyze and display spatial information from real world to solve the problem of
collecting information and support users in making decisions to better manage natural
resources.
Remote sensing data is the source of database for GIS on the basis of various
information classes. Thus, the combination of remote sensing and GIS has become an
3
effective integrated technology for collecting, updating and analyzing spatial data that serve
various fields.
2.2 Development of remote sensing and GIS
Remote sensing began in the 1840s when balloons were used to take pictures of the
ground. In 1909, the first aerial photograph was taken from an aero plane. Aerial photography
became a reconnaissance tool in the First World War for two purposes: spying and mapping.
In the Second World War aerial photos were used for military purposes: mapping of strategic
location, military targets, assessing damage. In 1957 Sputnik was invented, the putting
cameras on orbiting spacecraft was reliable. Two American satellites: Explorer I and II were
launched in 1958 and 1959. Remote sensing developed from 1970 when the first satellite
dedicated to monitoring land and ocean to map natural resources. In 1972 ERTS-I (Earth
Resources Technology Satellite) was launched in 1972. Then it was followed by ERTS-2 in
1975. Then their name were changed to LANDSAT-1, 2. The European Radar satellite (ERS1) was launched in 1991. USA, France and India have planned a series of satellites with
improvement in capability, so the users can get better resolution of aerial images.
GIS has been developed from mid 20th century. Roger Tomlinson-the father of GIS,
he worked to initiate the development of the Canadian Geographic System (CGIS) as the root
of Geographic Information System. This system was invented to collect, store, and analyze
data about land usage in Canada. In1964, SYMAP-the first compute mapping software was
created by Howard Fisher. Then in 1965 he constructed the Harvard Laboratory for Computer
Graphics, developed ODYSSEY GIS, GIMMS, GRID. Many of the early concepts for GIS
and its applications were created at the Lab. In the late 1980s, ESRI was found as one of GIS
software vendors, now it is the largest GIS software in the world. In the 1981, ESRI released
ARC/INFO-the first commercial GIS product and in 1992 it provided ARC View began the
evolution of ESRI into a software company. Along with the development of technology, GIS
4
helps people to create their own digital map to handle problems. It also becomes a computerbased tool for collecting, storing and manipulating map-based land data.
2.3 Features of Landsat images
Landsat is the general name for satellite system used for purpose of archive Earth
images. It is a satellite system that have become an international nature. The first Landsat
satellite was launched in 1972 by NASA and continuing with Landsat 7. Landsat program
was designed to collect data monitoring multi-spectral information from Earth’s surface helps
scientist to assess the change in Earth’s surface.
There are four sensors used in the Landsat program. The Multi Spectral Scanner
(MSS) was carried in Landsat 1-3. Landsat 2 was operated in 1975, Landsat 3 in 1978. There
three satellites image had four spectral bands covering green, red and near infrared band with
60 meters spatial resolution. Landsat 4 was launched in 1982 and Landsat 5 in 1984, both
satellites carried a new sensors was known as Thematic Mapper (TM). Thematic Mapper is
an advanced, designed to achieve higher image resolution. This sensor observe the Earth
under six spectral bands and one thermal band (band 6) with 30 meters spatial resolution.
Landsat 6 was launched in 1993 but it was lost just after not reaching the velocity to obtain
orbit. After that Landsat 7 was launched in 1999 and is equipped with sensor Enhanced
Thematic Mapper Plus (ETM+). The ETM+ sensor has the same spectral bands as the TM
sensor, with an addition of a 15 meters panchromatic band. Landsat 8 was launched to orbit
in 2013 and has two main sensors: the Operational Land Imager (OLI) and the Thermal
Infrared Sensor (TIRS). Images of Landsat 8 include nine spectral bands with 30 meters
spatial resolution for bands 1-7 and 9. Band 8 is panchromatic with 15 meters resolution.
Bands 10 and 11 are collected at 100 meters.
5
Table 2.1: Sensor feature of Landsat 4-5
Band number
Wavelength (µm)
Resolution (m)
Band 1-Visible blue
0.45-0.52
30
Band 2-Visible green
0.52-0.60
30
Band 3-Visible red
0.63-0.69
30
Band 4-Near-infrared
0.76-0.90
30
Band 5-Short-wave infrared
1.55-1.75
30
10.40-12.30
120*(30)
2.08-2.35
30
Band 6-Thermal
Band 7-Short-wave infrared
Source: Paul R.Baulmann (2010)
Table 2.2: Sensor features of Landsat 7
Band number
Wavelength (µm)
Resolution (m)
Band 1-Visible blue
0.45-0.52
30
Band 2-Visible green
0.52-0.60
30
Band 3-Visible red
0.63-0.69
30
Band 4-Near-infrared
0.77-0.90
30
Band 5-Short wavelength infrared 1
1.55-1.75
30
10.40-12.50
60*(30)
Band 7-Short wavelength infrared 2
2.09-2.35
30
Band 8-Panchromatic
0.52-0.90
15
Band 6-Thermal
Source: Paul R.Baulmann (2010)
Table 2.3: Sensor features of Landsat 8
Band number
Wavelength (µm)
Resolution (m)
Band 1-Coastal/Aerosol
0.435-0.451
30
Band 2-Visible blue
0.452-0.512
30
Band 3-Visible green
0.533-0.590
30
Band 4-Visible red
0.636-0.673
30
Band 5-Near-infrared
0.851-0.879
30
Band 6-Short wavelength infrared 1
1.566-1.651
30
6
Band 7-Short wavelength infrared 2
2.107-2.294
30
Band 8-Panchromatic
0.503-0.676
15
Band 9-Cirrus
1.363-1.384
30
Band 10-Thermal Infrared 1
10.60-11.19
100*(30)
Band 11-Thermal Infrared 2
11.50-12.51
100*(30)
Source: Department of the Interior U.S. Geological Survey (2016)
Landsat image is applied in many fields from studying the status to monitoring
fluctuation of land use/land cover. This following table presents the major applications of
Landsat images:
Table 2.4: The major application of Landsat image
Landsat
Wavelength
Application
band
Blue
0.45pm – 0.52pm
Used to investigate shoreline, distinguish
vegetation and soil, identify other objects.
Green
0.52pm – 0.60pm
Used to measure the maximum reflectance
spectrum of plant, identify vegetation state and
other objects.
Red
0.63pm – 0.69pm
Used to determine chlorophyll absorption zone to
help classify vegetation, identify other objects.
Near Infrared
0.76pm – 0.9-pm
Used to determine plant types, status and biomass,
soil moisture.
Short-wave
1.55pm – 1.75pm
Used to determine the moisture of vegetation and
Infrared
2.08pm – 2.35pm
soil, research mineral rock, separate snow and
cloud.
Thermal
10.4pm – 12.5pm
Infrared
Panchromatic
Used to determine time that vegetation is shocked,
soil moisture and temperature mapping.
0.53pm – 0.9pm
Low resolution and continuous spectrum, this band
is used to overlay with other bands, from that
measure objects exactly.
Source: Climategis.com
7
2.4 Remote sensing and GIS application
With the development of computer and modern technology, remote sensing is
becoming popular for resource management. The use of remote sensing and GIS has gained
mass momentum in recent years. It is used almost every field in social and natural sciences,
giving accurate, efficient methods for collecting, viewing and analyzing spatial data. In the
last few decades majority of work in remote sensing was mainly focused on environmental
studies. The implication of remote sensing and GIS to forest cover change and urban
planning is now getting attention and interest among GIS and Remote sensing professionals.
GIS provides foresters with powerful tools for recording, keeping, updating information,
supporting the decisions of manager and policy makers.
The applications of remote sensing and GIS have been widely applied in many field
from agriculture, forestry, land use land cover, natural disasters, geology and so on.
2.4.1 Agriculture
Agriculture plays an important role in economy of country. It provides food to
everyone and getting highest food productivities is the desire of the farmers and agricultural
agencies. In agricultural field, GIS can be used to manage and monitor farming practices at
different levels. Satellite data can help determine the location and extent of crop stress.
Remote sensing can be used to prepare maps of crop types. Satellites can provide information
about the health of vegetation. This information serves to predict grain crop yield, collecting
crop production, mapping soil productivity, identification factors that influences crop stress
(P K Kingra, 2016) and monitoring farming activity. Remote sensing and GIS is essential in
mapping areas that are vulnerable to natural disasters such as flood, drought.
Remote sensing imagery gives the general spatial information of land. It can identify
crops affected by natural condition: temperature, precipitation, humidity, nutrient or by
insect, weed (Menon Arr, 2012). Remote sensing is also a good method for mapping and
8
predicting soil degradation. Soil surface after erosion have different colors, tone and structure
than non-eroded soil, so that eroded parts can be identify by spatial images. Remote sensing
inputs are evolved for analyzing crop area and is a very useful tool in crop yield forecasting
(Menon Arr, 2012)
2.4.2 Forestry
Remote sensing forms a valuable tool in mapping and monitoring of biodiversity and
provides valuable information to quantify spatial patterns, biophysical patterns, ecological
patterns, determine species richness and factors affecting species richness and for predicating
response of species to global changes (Menon Arr, 2012).One of the basic applications of
GIS is forest cover typing and species identification. Forest cover typing consist of
investigation mapping over a large area, species inventories are measurement of stand
structure, characteristics. GIS gives geographic and spatial data that allows manager to
effectively manage planning process. Remote sensing and GIS can identify various forest
types that could be difficult to classify by traditional survey.
GIS provides useful tools in fire management. Forest fires significantly influence on
vegetation cover, animals, soil, air quality. Forest managers have used GIS to predict the
fires. Forest fire depends three elements: heat, fuel, and oxygen. GIS can be used for fuel
mapping, weather condition mapping and fire danger mapping. GIS provide information
about factors: slope, elevation, wind speed, relative humidity, cloud cover, temperature, dead
fuel moisture (Sonti SH, 2015). Forest fire managers can base on these data and develop
models to predict forest intensity.
Remote sensing and GIS help to make decision in harvest planning. Maps constitute a
planning tool for identification of felling direction, exploitation route, and depots. Users use
remote sensing to collect data for example, timber harvesting, silviculture, predicting fuel
wood, recreation opportunities and minimizing impacts of harvesting.
9
2.4.3 Urban planning
Urban area is complex combination of buildings, roads, garden, cemetery, and
sidewalk. Urban provides several of problems: resource allocation, employment level, traffic
congestion, infrastructure, GIS is a tool to manage the changing of urban area. Remote
sensing and GIS are useful tools to investigate and analyze city’s natural conditions, resource
distribution, geographical layout of towns, road network, urban expansion and the change of
urban area (Yinghui Xiao and Q.Zhan, 2009). Managers will use spatial data and maps to
decide how to manage the landscape. Remote sensing can identify traffic congestion, design
the right place to build a road to ensure maximum relief of the roads already full capacity, the
direction of the road, entry and exit junctions. The same data also is used to ensure the best
routes for public transport network.
2.4.4 Land cover mapping
Land cover mapping is a typical application of remote sensing. Land cover consists of
forest, grassland, concrete pavement, water. Land cover reflects human activities such as the
use of land for resident, agriculture, industry. GIS collects and updates data of land cover
maps. The change is detected by comparison between two multi-date images. Remote
sensing has an important contribution to make in documenting the change in land
use/land cover on regional and global scales from the mid-1970s (Lambin et al., 2003).
Map of land cover change is used to assess the external effects for example, human activities,
natural disasters on land cover types and give appropriate policies for sustainable
management.
10
Chapter III
OBJECTIVES AND METHODOLOGY
3.1 Objectives
To apply remote sensing and GIS to construct map and detect forest cover change in
Kim Tien commune, Kim Boi district, Hoa Binh province. From that, identify reasons of the
change detection and suggest solutions for effective forest management. The study includes
four specific objectives:
-
Objective 1: To investigate the status of forest cover in Kim Tien
-
Objective 2: To construct maps of forest cover change detection in Kim Tien
-
Objective 3: To identify key drivers of forest change detection in the period
-
Objective 4: To propose solutions for effective forest management
3.2 Methodology
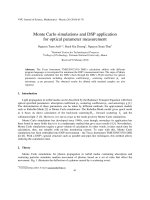
3.2.1 Study site
Figure 3.1: Map of study site
11
Kim Tien is a mountainous commune located in South-West of Kim Boi District (Hoa
Binh province), it is 4 kilometers far from Kim Tien to center of Kim Boi district, its
boundary is defined:
+ In the North and North-West, it is bordered by Ha Bi commune, Bo town and Vinh
Dong commune.
+ In the South, it is bordered by Quy Hoa commune (Lac Son district) and Kim Truy.
+ In the East, it is bordered by Kim Boi commune, Kim Binh commune.
+ In the West, it is bordered by Hop Dong and Thuong Tien commune.
Natural area of Kim Tien is about 2,178.79 ha
3.2 Methodology
3.2.1 Data sources
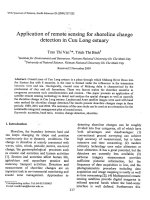
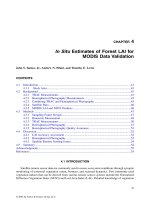
To track the change in the study site over period of time, the study tried to collect
Landsat images with different data acquired of period from 1995 to 2018:
Table 3.1: Landsat images used in the study
Image code
Satellite
Date
Pixel
Path/Row
instrument
acquired
LC81270462018158LGN00
Landsat 8
2018/06/07
30x30
127/46
LT51270462011187BKT00
Landsat 5
2011/07/06
30x30
127/46
LT51270462002290BJC00
Landsat 5
2002/10/17
30x30
127/46
LT51270461995175BKT00
Landsat 5
1995/06/24
30x30
127/46
Source: glovis.usgs.gov
12
Figure 3.2: Landsat image of study site in 1995, 2002, 2011, 2018
Besides that, the study collected documents related to forest land including: paper
map of topography, current land use. The study also inherited materials, reports about natural,
socio-economic condition in Kim Tien, document of forest protection, support program for
residents in study site.
3.2.2 Interviewed data
Interview is a good way to get information directly from people that live in the study
site. Because they understand clearly about the place where they live so collecting
information from them is very useful for research. From interview, we can know the current
status of land cover, forest cover change, management planning, as well as driving force of
land cover change.
Interview staff of management board to get information about the current forest cover
types of the area, as well as polices and regimes management which are implemented in Kim
Tien commune. Therefore, the research could get an overview about the processing of
formation and change in the area.
13
Local people play an important role in management of forest Kim Tien commune,
because they depend on and affect directly on the forest and land use. They understand about
the area better than anyone. Therefore, interview local people is the best way to have real and
accurate information about the area. The information of interview provides a basis for
assessing and monitoring local people’s impact on forest resources. The interview local
communities also can have an overview about effectiveness of management plan of the
commune. In this study, the interview local people to determine key driver of forest change
detection during research period. The interview is focus on old and middle-age people with
experience. So that, they could provide much more information about the area in many years
ago.
30 people belong to object of interview: staffs, authorities and residents of Kim Tien
commune. For the local people, the interview is focused on their purposed of using land,
planting forest tree and harvesting forest activities. Content of interviewing staff is focused
on the status of forest land, types of forest in the commune, plantation project was carried
out, and local forest management.
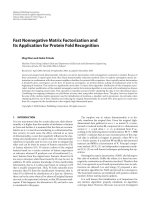
3.2.3 Data processing
The research used ArcGIS software to build map of the forest over the periods. Image
clustering channels were been collected including individual spectral channels due to needing
combination and composition to easy conduct steps later. After composition step, the study
site boundary was created and used to cut study site from Landsat image.
The process of interpretation and classification of images Landsat are presented in the
figure 3.3:
14
Landsat images
GPS field survey
1995, 2002, 2011, 2018
Boundary of
study area
Composite
Clip study
Band
bands
area
combination
Image Classification
NDVI
Accuracy assessment
Raster calculation
Forest cover in 1995,
2002, 2011, 2018
Forest change
Forest change
Forest change
1995 - 2002
2002 – 2011
2011 - 2018
Figure 3.3: Flowchart of Landsat images classification and change mapping
15
3.2.4 Image classification using NDVI
Vegetation index is used as an indicator to quantify the greenness of plants within
satellite image. The vegetation index is widely used to determine the density of the
vegetation, to assess the growth and development status of the plant, as the basis for data to
predict pests, droughts, area productivity and crop yields. The most used index is Normalized
Difference Vegetation Index (NDVI). NDVI is developed for estimating vegetation cover
from the reflective bands of satellite data. The method employs the multispectral remote
sensing data technique to find spectral signature of different objects such as vegetation index,
land cover classification, concrete structure, road, urban areas, rocky areas and remaining
areas. NDVI is useful to determine vegetation change detection. NDVI can be expressed as:
NDVI = (NIR – RED)/(NIR + RED)
Where: NIR is near infrared channel. RED is red channel
The NDVI is motivated by the observation vegetation, which is the difference
between the NIR and red band, it should be larger for greater chlorophyll density. In contrast,
bare land has higher reflectance at red wavelengths and lower reflectance at near infrared
wavelengths. Value of NDVI ranges from -1 to 1. Value of NDVI low represents where
vegetation cover is low. Value of NDVI high where vegetation cover is rich. Negative value
indicates non-vegetated surface features such as water, barren land, ice, snow, or clouds. If
there is a land cover change somewhere between two dates, the NDVI differentiated image
should have pixel value greater than or smaller than 0.
NDVI very low value of NDVI about 0.1 and below represent a area of snow, rock,
sand. Water like ocean, lakes, and rivers have a low reflectance in spectral channels that have
a negative NDVI value. Value from 0 to 0.5 is the area of spare vegetation, 0.5 to 1 shows
dense vegetation and value below 0 indicates no vegetation cover. Moderate values from 0.2
16
to 0.3 represent shrub and grassland. High values represent the temperate and tropical
rainforests from 0.6 to 0.8. While bare soil is represented with NDVI value close to 0.
3.2.5 Field survey
Field survey is conducted to collect ground control point with the help of Global
Positioning System (GPS). The survey arm is determining the land cover types, providing
data for classification image, and for accuracy assessment. The research selects 230 point in
the field, including forest and other land use types. The total number of selected points is
distributed evenly across the entire study site.
Table 3.2: The object-based classification framework
Satellite image
Field image
Description
3.2.6 Accuracy assessment
Accuracy assessment is used to evaluate the accuracy of image classification methods
or compare the reliability of the results of different remote sensing image classification
methods. The study could know how accurate the classification is by using selected points
from field survey and Google Earth. In this study, a total of 230 reference points include:
forest, agriculture and other were selected to serve as samples for the classification.
This accuracy assessment represents the relationship between the classes in the digital
map and field survey/Google Earth. This study assesses the accuracy of classification method
by using Kappa coefficient:
17