Raising awareness of local people in order to effectively implement eco city plan on solid waste clasification in hai phong city
Bạn đang xem bản rút gọn của tài liệu. Xem và tải ngay bản đầy đủ của tài liệu tại đây (741.46 KB, 44 trang )
ACKNOWLEDGEMENT
To complete the final thesis, firstly, I would like to express my sincere gratitude to
my advisor Dr. Tran Thi Thu Ha for the continuous support of my thesis, for her patience,
motivation, and immense knowledge. Her guidance helped me in all the time of research and
writing of this thesis. I could not have imagined having a better advisor and mentor for my
final thesis.
I sincerely thank to the leadership, corporate departments of Hai Phong urban and
environment one member limited company have created favorable conditions for me to
practice during an internship at the company.
Finally I would like say thanks to my school – Vietnam National University of Forest
has given me an opportunity to be practiced at my hometown to apply the knowledge I
learned from the school. Through this internship, I get much new and useful experience that
is helpful for my future work.
Because my knowledge is limited, this thesis may have some mistakes, I would like
to receive the comments from the teachers to help my thesis becoming more completed.
ABSTRACT
Solid waste treatment is one of the biggest challenges that people have to solve to
protect the environment. To save time in this process, solid waste classification is necessary
to be implemented at all the households. Solid waste classification at the source not only
reduces landfill area, reduces processing costs, but also has important implications in the
reuse – recycling. In Haiphong city, one project named “Eco City Plan”, which is about solid
waste classification, is carried out in the center of the city. This study was conducted to
support effectively implementation of Eco City Plan on solid waste classification in Hai
Phong city by assessing the awareness of local people on solid waste, determining factors
that affect to awareness of local people on solid waste and proposing solutions to raise
awareness of local people on Eco City Plan. Methods are used in this study are collecting
existed data, survey questionnaires and group discussion. The study found that there are
differences in knowledge about solid waste classification according to gender, age,
occupation and education level. The awareness is also affected by these factors. In general,
most of people assess solid waste classification as important and they recognized their role
as the key stakeholder to implement the project successfully. But the local people are not
prepared to implement classifying solid waste at home because most of them are confused
and do not want to waste their time. To solve these problems, The thesis proposes some
solutions as establishing environmental propaganda and education about solid waste
classification by social media, establishing solid waste practice course for local people,
adding solid waste classification as a criteria to assess the cultural family, guiding people to
classify solid waste by the guidance from project staffs, local authorities staffs and
volunteers, gathering and buying inorganic waste for recycling and educating young people
the importance of solid waste classification.
TABLE OF CONTENTS
ACKNOWLEDGEME
ABSTRACT
TABLE OF CONTENTS
LIST OF TABLES
LIST OF FIGURES
1. INTRODUCTION .....................................................................................................................1
2. GOALS AND (SPECIFIC) OBJECTIVES ...............................................................................3
2.1. General objective ....................................................................................................................3
2.2. Specific objectives...................................................................................................................3
3. SITE DESCRIPTION ................................................................................................................4
4. METHODS ................................................................................................................................5
4.1. Collecting data and information ..............................................................................................5
4.1.1. Secondary data collection .....................................................................................................5
4.1.2. Primary data collection .........................................................................................................5
4.2. Data analysis ...........................................................................................................................6
4.2.1. Accessing the awareness of local people ..............................................................................6
4.2.2 SWOT analysis ......................................................................................................................7
5. RESULTS ..................................................................................................................................9
5.1. The description of the respondents..........................................................................................9
5.2. Knowledge ............................................................................................................................10
5.2.1. Knowledge about solid waste classification by gender ......................................................10
5.2.2. Knowledge about solid waste classification by age............................................................11
5.2.3. Knowledge about solid waste classification by educational level ......................................12
5.2.4. Knowledge about solid waste classification by occupation ................................................13
5.3. Awareness .............................................................................................................................14
5.3.1. Assessing the quality of solid waste collecting services .....................................................14
5.3.2. Assessing the important level of solid waste classification by gender ...............................15
5.3.3. Assessing the important level of solid waste classification by age ....................................16
5.3.4. Assessing the important level of solid waste classification by educational level ...............17
5.3.5. Assessing the important level of solid waste classification by occupation ........................18
5.3.6. Assessing the important level of stakeholders in solid waste classification .......................19
5.3.7. Assessing the level of willingness to classify solid waste ..................................................20
5.4. Behavior ................................................................................................................................21
5.4.1. The number of households classifies solid waste at home .................................................21
5.4.2. The person usually classifies solid waste at home ..............................................................21
5.5. Factors that affect to the awareness of local people in solid waste classification .................22
5.5.1 Sources of information for households about solid waste classification ............................22
5.5.2. Reasons for non-classify solid waste ..................................................................................23
5.5.3. Reasons for classify solid waste .........................................................................................24
5.6. Assessing the status of project by strengths, weakness, opportunities and threats ...............24
5.7. Recommendations .................................................................................................................26
6. CONCLUSION .......................................................................................................................29
7. REFERENCES ........................................................................................................................30
APPENDIX
LIST OF TABLES
Table 4.1. SWOT analysis of the status of project ...................................................................................8
Table 5.1. Descriptions of respondents ....................................................................................................9
Table 5.2. Assessing the solid waste treatment form of households ........................................................9
Table 5.3. Knowledge about solid waste classification according to gender .........................................10
Table 5.4. Knowledge about solid waste classification according to age group ....................................11
Table 5.5. Knowledge about solid waste classification according to educational level .........................12
Table 5.6. Knowledge about solid waste classification according to occupation ..................................13
Table 5.7. Assessing the quality of solid waste collecting services in local area ...................................14
Table 5.8. Assessing the important level of solid waste classification according to gender ..................16
Table 5.9. Assessing the important level of solid waste classification according to ..............................16
age group ................................................................................................................................................16
Table 5.10. Assessing the important level of solid waste classification according to educational level 17
Table 5.11. Accessing the important level of solid waste classification according to occupation .........18
Table 5.12. Assessing the important level of stakeholders in solid waste classification .......................19
Table 5.13. Accessing the level of willingness to classify solid waste ..................................................20
Table 5.14. The person usually classifies solid waste at home ..............................................................22
Table 5.15. Sources of information for households about solid waste classification .............................22
Table 5.16. Reasons for non-classify solid waste at home .....................................................................23
Table 5.17. Reasons for classify solid waste ..........................................................................................24
Table 5.18. SWOT analysis of the project .............................................................................................25
LIST OF FIGURES
Figure 3.1. Hai Phong geographic map ...................................................................................... 4
Figure 4.1. Geographical location of Nguyen Duc Canh street and Quang Trung street ........... 5
Figure 5.1. The quality of solid waste collecting services in local area ................................... 15
Figure 5.2. The level of willingness to classify solid waste ..................................................... 20
Figure 5.3. The number of households classifies solid waste at home ..................................... 21
Figure 5.4. Some recycled products from inorganic solid waste ............................................. 28
1. INTRODUCTION
Environment plays an important role in human life. It assumes three main functions:
providing resources, providing a place to live and space containing garbage. Currently, the
speed of urbanization and industrialization in the country is growing rapidly and will
continue going up in the next several years. The exploitation and consumption of natural
resources by humans is also constantly increasing, raising environmental problems of gas
waste, liquid waste and solid waste.
The pollution of environment is not only a problem in the world, but also a big
challenge in Vietnam. One of the main causes lead to the pollution in Vietnam is solid waste.
According to Clause 10, Article 3 of the Environmental Protection Law, “Solid waste is
waste in form of solid, was discharged from production process, business, services, other
activities,...”. Currently, the average daily Vietnam generated 12 million tons of domestic
solid waste which means one Vietnamese emits about 200 kg of solid waste a year
averagely. The increasing of solid waste increases the pollution mainly because of lacking in
solid waste treatment, especially solid waste classification in the head source.
In recent years, along with the development of the country, Hai Phong city has
gained tremendous achievements. But these achievements also increased the amount of
waste that lead to serious impact on the lives of people as well as the region's environment.
Eco City Plan has aimed to classify, recycle waste into resources, recycled materials.
It was built with the goal of reducing household waste, industrial waste recycling into fuel
solid fuels (fuel bars), and energy recycling, plastic, promote resource circulation. The
International Cooperation Agency of Japan (JICA), the Company and the Group Forval JAC
jointly conducted “Survey the feasibility of the technical and technological classification,
processing, production of recycled product of Eco City Plan in Hai Phong. On July 2015,
Japan conducted field surveys on the situation in the Hai Phong garbage and construction
1
waste classification model watershed in Le Chan and Hong Bang – two districts in the central
of the city.
In order to implement Eco City Plan, the indispensable condition is that all the
government, implementing agencies and people of the city, especially people living in Le
Chan and Hong Bang districts, classify solid waste as well as how to focus collect the waste
that can be recycled into resources together. However, the awareness, the responsible
participation in environmental protection of the people of Hai Phong in general, as well as
people living in the two districts under Eco City Plan has not really become a habit in their life.
Therefore, I decided to conduct a thesis titled: “Raising awareness of local people in order to
effectively implement Eco City Plan on solid waste classification in Hai Phong city”.
2
2. GOALS AND (SPECIFIC) OBJECTIVES
2.1. General objective
The general objective of the research is to support effectively implementation of Eco
City Plan on solid waste classification in Hai Phong city.
2.2. Specific objectives
- To assess awareness of local people on Eco City Plan on solid waste classification
in Hong Bang and Le Chan districts in Hai Phong;
- To determine factors that affect to awareness of local people on Eco City Plan on
solid waste classification in Hong Bang and Le Chan district, Hai Phong city;
- To propose solutions to raise awareness of local people on Eco City Planand
effectively implement the Eco City Plan on solid waste classification in Hai Phong city.
3
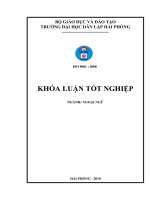
3. SITE DESCRIPTION
“Hai Phong is a harbor city – one of the industrial centers, the largest port in northern
Vietnam. It is also the center of economy, culture, health, education, science, business and
technology of the northern coastal areas. This is the third largest city of the country.. Hai
Phong is one of five municipalities in Vietnam, first class city, along with Da Nang and Can
Tho. As of 12/2015, Hai Phong has 2.1035 million people, of which the urban population
accounted for 46.1% and the rural population accounted for 53.9%, the third most populous
city in Vietnam.” (Wikipedia.com).
Figure 3.1. Hai Phong geographic map
(Source: investinvietnam.com)
“Hai Phong has many industrial areas and large commercial and service centers,
tourism, education, health and coastal fisheries of Northern Vietnam. Haiphong is a growth
pole of the northern economic triangle which includes Hanoi, Hai Phong and Quang Ninh."
(Wikipedia.com).
4
4. METHODS
4.1. Collecting data and information
4.1.1. Secondary data collection
- Hai Phong geographic condition, economic condition, social condition (especially
demographic data), solid waste (status and accessing process).
- Eco City Plan, including contents of the project and how it was implemented.
The data is mainly collected from Hai Phong Natural Resources and Environment
Department, JICA – The main sponsored project, and from other sources.
4.1.2. Primary data collection
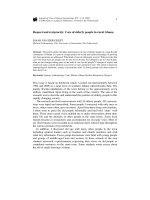
4.1.2.1. Sample description
In Hong Bang land Le Chan districts, I chose Nguyen Duc Canh and Quang Trung
streets as the study site because they are the main streets of the center of the city – which
contain the amount of stores, schools and important positions in transporting and trading
activities.
Figure 4.1. Geographical location of Nguyen Duc Canh street and
Quang Trung street
5
According to the demographic data of General Statistic Office of Hai Phong, Nguyen
Duc Canh street has 264 households, 1275 people; Quang Trung street has 287 households,
1328 people. Up to this day, solid waste collecting service in Nguyen Duc Canh and Quang
Trung streets is responsibility of Hai Phong urban and environment one member limiter
company.
4.1.2.2. Structured interview
A random sample of 100 households in Nguyen Duc Canh and Quang Trung streets
are selected in the survey. Questionnaires are prepared before going to the field to get
information on living area, gender, age, income, education level, occupation; their attitude
on the issues of solid waste management and classification.
4.1.2.3. Semi-structured interview
20 staffs in Hai Phong Natural Resources and Environment Department (who carry
out this project) were interviewed by using checklist to get information and data on the
issues:
- Understanding about Eco City Plan
- The effectiveness of Eco City Plan implementing
- The status of solid waste in study site
- The awareness of people in study site
4.1.2.4. Focus group discussion
Three focus group discussions (FGD) of 5 – 7 random people were used to get more
information in various sources by using prepared checklist, in which 2 groups of
households each district and 1 group of staffs each district.
4.2. Data analysis
4.2.1. Accessing the awareness of local people
There are many factors that affect to the awareness of local people such as living
6
area, gender, age, income, education level, and occupation.
Descriptive statistic were used to analyze the collected quantitative data, then, draw
charts, graphs, frequencies, and percentage
It contains analysis steps:
- Transcribe data (if audio taped)
- Read transcripts
- Highlight quotes and note why important
- Code quotes according to margin nots
- Sort quotes into coded groups (themes)
- Interpret patterns in quotes
- Describe these patterns
Quantitative and qualitative data after coding and analyzing are divided into 3 parts:
knowledge, awareness and behavior
4.2.2 SWOT analysis
SWOT tool was used to assess the status of project by strengths, weakness,
opportunities and threats, than propose the methods to reduce the weaknesses and threats.
- Step 1: Depending on collected data, I divide into groups: Location, Demographic,
Education level, Economy, Participation of local people.
- Step 3: List strengths
- Step 4: List weaknesses
- Step 5: List opportunities
- Step 6: List threats
- Step 7: Use the table below to analyze
7
Table 4.1. SWOT analysis of the status of project
Strengths
Opportunity
Weakness
Use strengths to take opportunity Overcome weakness that stopping us to
opportunity
Threat
Use strengths to reduce threat
8
Overcome weakness that can be threat
5. RESULTS
5.1. The description of the respondents
135 respondents participated in the interview, including local people and staffs.
They were chosen randomly to answer the prepared questions. The details of the
respondents are .shown in the table below.
Table 5.1. Descriptions of respondents
Demograph
ic
Respondents
Number
Percentage
Male
57
42.2%
Gender
Female
78
57.8%
Be able to read, write
6
4.44%
Educational level
Primary school
11
8.15%
Secondary school
16
11.9%
High school
41
30.4%
College/ University
61
45.2%
13 – 22
39
28.9%
Age group
23 - 40
29
21.5%
40 – 60
22
16.3%
> 60
45
33.3%
Government
25
18.5%
Occupation
Private
18
13.3%
Own bossiness
7
5.19%
Housewife
23
17.0%
Student
32
23.7%
Retirement, unemployment
30
22.2%
(Source: Results calculated by author based on data surveyed, 2016)
Table 5.2. Assessing the solid waste treatment form of households
The solid waste treatment form of households
N
%
Public wastebasket
10
7.41%
Freely waste
3
2.22%
Burry, burn waste
0
0.00%
Recycle
7
5.19%
Signup to People’s committee
115
85.2%
Release to the lake
0
0.00%
(Source: Results calculated by author based on data surveyed, 2016)
Most of people in the study area signs up to People’s committee for solid waste
treatment (85.2%). They pay environmental fee for solid waste collecting services. Only 10
people (7.41%) use public wastebasket, 7 people (5.19%) recycle waste and 3 people
(2.22%) are freely wasted.
The result is divided into 3 main groups: Knowledge, awareness and behavior of
local people about solid waste classification that are shown below.
In the study, I classify the knowledge into 4 levels: well, medium, weak and
unknown. People have well knowledge can distinguish organic and inorganic solid waste.
They also know to use the green – yellow waste bins in the right way. In general, the well
knowledge people have more than 80% about solid waste classification. The second level is
medium – including people who have knowledge about solid waste classification about
50% - 80%. People in this level basically know about inorganic and organic waste, but they
are confused to classify solid waste, neither in using green – yellow waste bins. The weak
level represents a group of people who have knowledge less than 50% about solid waste
classification. They difficulty classify either recognize the inorganic – organic waste. And
the last level is unknown – the group has people who know nothing about solid waste
definition and classification.
5.2. Knowledge
5.2.1. Knowledge about solid waste classification by gender
57 male and 78 female participated in the interview. There are the differences in
respondents from different gender. The study results are shown in the Table 5.3.
Table 5.3. Knowledge about solid waste classification according to gender
Gender
Knowledge level about solid waste classification
Well
Medium
Weak
Unknown
Male
N
27
14
11
5
%
47.4 %
24.6 %
19.3 %
8.80 %
Female
N
17
34
17
10
%
21.8 %
43.6 %
21.8 %
12.8 %
(Source: Results calculated by author based on data surveyed, 2016)
47.4% male participants have well knowledge about solid waste classification while
female participants have 21.8%. Most of female participants have medium knowledge about
this problem (43.6%). The same level medium knowledge in male gender is 24.6 %. The
weak and unknown rates in 2 genders are not much different (Weak: Male – 19.3 %,
Female - 21.8%; Unknown: Male - 8.80%, Female – 12.8%).
According to this result, we can clearly see that the knowledge of male gender is
higher than female gender. The reason is men have more opportunities to get the
information by reading newspaper, participating local meeting than women. Women have
less time to access news because they have to do housework, take care of children.
5.2.2. Knowledge about solid waste classification by age
Age is the factor that affects to the knowledge of people about solid waste
classification. In total 135 interviewed people, there are 39 people in 13 – 22 years old age
group, 29 people in 23 – 40 years old age group, 22 people in 40 – 60 years old and 45
people are more than 60 years old. The research result about solid waste classification
according to age group is shown in Table 5.4.
Table 5.4. Knowledge about solid waste classification according to age group
Age group
Knowledge level about solid waste classification
Well
Medium
Weak
Unknown
13 – 22
N
13
13
9
4
years old
%
33.3 %
33.3 %
23.1 %
10.3 %
23 – 40
N
7
9
5
8
years old
%
24.1 %
31.0 %
17.2 %
27.6 %
39 – 60
N
9
8
4
1
years old
%
40.9 %
36.4 %
18.2 %
4.50 %
> 60 years
N
15
18
10
2
old
%
33.3 %
40.0 %
22.2 %
4.40 %
(Source: Results calculated by author based on data surveyed, 2016)
11
The age group has the highest knowledge about solid waste classification is group
40 – 60 years old. Most of people in this group work for the project and the local authorities
so that they know clearly how to classify solid waste. The second are groups 13 – 22 years
old and >60 years old. These groups gain the information mainly from schools and
newspapers, television. The lowest knowledge about solid waste classification is group 23 –
39 years old. People in this age have to work hard and have no time to learn deeper in solid
waste classification.
5.2.3. Knowledge about solid waste classification by educational level
One of the factors that directly affect to the knowledge about solid waste
classification is educational level. In general, the educational level of the participants is
high. Only 6 people are able to read, write; 11 people with primary education, 16 people
with secondary
education, 41 people with high school education and 61 people are
studying or already have got college/ university degree. The results of different educational
levels are shown in the Table 5.5.
Table 5.5. Knowledge about solid waste classification according to educational level
Educational level
Be able to read, write
Primary school
Secondary school
High school
College/ University
Knowledge level about solid waste classification
Well
Medium
Weak
Unknown
N
0
0
2
4
%
0%
0%
33.3 %
66.7 %
N
2
5
2
2
%
18.2 %
45.5 %
18.2 %
18.2 %
N
6
4
4
2
%
37,5 %
25.0 %
25.0 %
12.5 %
N
16
15
8
2
%
39.0 %
36.6 %
19.5 %
4.90 %
N
20
24
12
5
%
32.8 %
39.3 %
19.7 %
8.20 %
(Source: Results calculated by author based on data surveyed, 2016)
12
As we can see in the result, the knowledge of high school and college/ university
education is higher than others with the high percentage of well and medium knowledge
about solid waste classification. Specifically, high school education has 16 well knowledge
people (39.0%), 15 medium knowledge people (36.6%); college/ university has 20 well
knowledge people (32.8%) and 24 medium knowledge people (39.3%). The lowest
knowledge about solid waste classification is also the lowest educational level is group of
people are able to read and write with 0% well knowledge, 0% medium knowledge, 33.3%
(2 people) weak knowledge and 66.7% unknown (4 people). People with higher education
have more opportunities to get information about solid waste classification than the lower ones.
They have knowledge in physic, chemistry so they know how to classify the solid waste.
5.2.4. Knowledge about solid waste classification by occupation
In 135 respondents, there are 25 people work for the government, 18 people work
for the private, 7 people are their own bossiness, 23 housewives, 32 students and 30 people
are retired, un-employee. The result about solid waste classification according to occupation
is shown in Table 5.6.
Table 5.6. Knowledge about solid waste classification according to occupation
Knowledge level about solid waste classification
Well
Medium
Weak
Unknown
N
12
7
1
0
%
68.0%
28.0%
4.00%
0.00%
Private
N
2
6
8
2
%
11.1%
33.3%
44.4%
11.1%
Own bossiness
N
1
2
3
1
%
14.3%
28.6%
42.9%
14.3%
Housewife
N
6
9
4
4
%
26.1%
39.1%
17.4%
17.4%
Student
N
6
11
9
6
%
18.8%
34.4%
28.1%
18.8%
N
12
13
3
2
Retirement,
unemployment
%
40.0%
43.3%
10.0%
6.70%
(Source: Results calculated by author based on data surveyed, 2016)
Occupation
By
Government
13
According to this result, the highest knowledge about solid waste classification
belongs to the group of people work for the government: 12 people (68.0%) well knowledge,
7 people (28.0%) medium knowledge and just 1 person (4.00%) has weak knowledge, 0.00%
unknown. The second is the retirement, unemployment with 40.00% (12 people) well
knowledge, 43.4% (13 people) medium knowledge. These groups have concerned about
solid waste classification more than others. The lowest solid waste classification knowledge
is own bossiness and private with the percentage of knowledge with just only 14.3% (1
person) and 11.1% (2 people) well knowledge; 44.4% (8 people) and 42.9% (3 people) weak
knowledge;11.1% (2 people) and 14.3% (1 person) are unknown, respectively. Because own
bossiness and private concentrate more on doing business so they do not care much about
solid waste as well as its classification.
5.3. Awareness
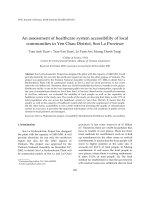
5.3.1. Assessing the quality of solid waste collecting services
According to the question “Which level do you assess about the solid waste
treatment in this area now?”, 135 people have assessed the quality of solid waste
collecting services in
the local area. The result is shown in Table 5.7.
Table 5.7. Assessing the quality of solid waste collecting services in local area
Quality level of solid waste collecting services in local area
N
%
Very good
83
61.5%
Good
41
30.4%
Normal
8
5.93%
Not good
0
0.00%
No assessment
3
2.22%
(Source: Results calculated by author based on data surveyed, 2016)
14
The quality of solid waste collecting
services in local area
2,22%
Very good
Good
Not good
No assessment
Figure 5.1. The quality of solid waste collecting services in local area
61.5% (83 people) assessed the quality of solid waste collecting services in this area
is very good, 30.4% (41 people) think it is good, 5.93% (8 people) think it is normal. No
one chose the option “not good” and only 3 people (2.22%) gave no assessment. In general,
the solid waste collecting services in the study area is good because it is the centre area,
which represents for the whole city. The environment in this area is more noticed than other
areas. It is usually cleaned by the Hai Phong urban and environmental company. The
cleaning activities are concerned by the local people so that most of them can assess the
quality of this service.
5.3.2. Assessing the important level of solid waste classification by gender
The assessment of 57 male and 78 female about the important level of solid waste
classification is shown in Table 5.8.
15
Table 5.8. Assessing the important level of solid waste classification according to gender
Gender
Male
Female
Important level of solid waste classification
Very important
Important
Normal
Not important
N
29
16
9
3
%
50.9%
28.1%
15.8%
5.26%
N
17
24
26
11
%
21.8%
30.8%
33.3%
14.1%
(Source: Results calculated by author based on data surveyed, 2016)
The result shows that men assess the solid waste classification is more important than
women. 50.9% (29 men) thought it is very important to classify solid waste while this
percentage in women is just 21.8% (17 people). Most of women thought it is important
(30.8% - 24 people) and normal (33.3% - 26 people). But in general, solid waste classification
is assessed as important in both genders. It shows that most of local people care about
classifying solid waste.
5.3.3. Assessing the important level of solid waste classification by age
39 people in 13 – 22 years old age group, 29 people in 23 – 40 years old age group, 22
people in 40 – 60 years old and 45 people are more than 60 years old have assessed the
important level of solid waste classification during the research. The result is shown in the
table below.
Table 5.9. Assessing the important level of solid waste classification according to
age group
3
Important level of solid waste classification
Very important
Important
Normal
Not important
13 – 22 years old
N
5
11
15
8
%
12.8%
28.2%
38.5%
25.5%
23 – 39 years old
N
8
9
9
3
%
27.6%
31.0%
31.0%
10.3%
40 – 60 years old
N
9
5
7
1
%
40.9%
22.7%
31.8%
4.55%
> 60 years old
N
23
15
5
2
%
51.1%
33.3%
11.1%
4.44%
(Source: Results calculated by author based on data surveyed, 2016)
16
As we can see in the result, group of people > 60 years old assessed that solid waste
classification is important with the highest percentage: 51.1% (23 people) assumed it is very
important, 33.3% (15 people) assessed it is important. The old people concern more about this
problem because they have lived for long time, they care about the environment and future
generation. The lowest percentage in assessing the important of solid waste classification is
age group from 13 – 22 years old. There are 15 people (38.5%) in this group thought it is
normal while 8 people (25.5%) thought it is not important. They use their time for studying
and entertaining. So that even they have knowledge about solid waste classification, they do
not care much about this problem because it is not their concern.
5.3.4. Assessing the important level of solid waste classification by educational level
135 respondents include 6 people are able to read, write; 11 people with primary
education, 16 people with secondary education, 41 people with high school education and 61
people are studying or already have got college/ university degree. The result of their
assessment in the important level of solid waste classification according to educational level is
shown in the table below.
Table 5.10. Assessing the important level of solid waste classification according to
educational level
Educational level
Important level of solid waste classification
Important
Normal
Very
Not
important
important
Be able to read, write
N
0
1
2
3
%
0.00%
16.7%
33.3%
50.0%
Primary school
N
2
5
3
1
%
18.2%
45.5%
27.3%
9.09%
Secondary school
N
5
5
4
2
%
31.3%
31.3%
25.0%
12.5%
High school
N
17
9
10
5
%
41.5%
22.0%
24.4%
12.2%
College/ University
N
22
20
16
3
%
36.1%
32.8%
26.2%
4.92%
(Source: Results calculated by author based on data surveyed, 2016)
17
According to the research result, the higher educational level the respondents have, the
higher important level they assess. Specifically, high school and college/ university groups
have highest assessment on the important of solid waste classification. 17 people (41.5%)
assess it is very important and 9 people (22.0%) assess it is important in high school group.
This percentage in college/ university are 22 people (36.1%) and 20 people (32.8%)
respectively. High educational level people know environment role is important so they also know
solid waste classification is important. The lowest level of important of solid waste classification
assessment belongs to the group of people who are able to read, write. They do not care much
about social problem, including environmental issues, so they do not think it is important.
5.3.5. Assessing the important level of solid waste classification by occupation
25 people work for the government, 18 people work for the private, 7 people are their
own bossiness, 23 housewives, 32 students and 30 people are retired, un-employee
participated in the research. The result of their assessment in the important level of solid
waste according to their occupation is shown in Table 5.11.
Table 5.11. Accessing the important level of solid waste classification according to
occupation
Important level of solid waste classification
Occupation by
Important
Normal
Very
Not
important
important
Government
N
15
7
3
0
%
60.0%
28.0%
12.0%
0.00%
Private
N
4
4
8
2
%
22.2%
22.2%
44.4%
11.1%
Own bossiness
N
2
1
3
1
%
28.6%
14.3%
42.9%
14.3%
Housewife
N
6
7
8
2
%
26.1%
30.4%
34.8%
8.70%
Student
N
8
11
7
6
%
25.0%
34.4%
21.9%
18.8%
Retirement, unemployment
N
11
10
6
3
%
36.7%
33.3%
20.0%
10.0%
(Source: Results calculated by author based on data surveyed, 2016)
18
People work for the government assessed the important level of solid waste
classification as highest with 60.0% (15 people) think it is very important and 28.0% (7
people) think it is important. The second is the retired people and un-employees (mostly
retirements) with 11 people (36.7%) assessed it as very important and 10 people (33.3%)
assessed it as important. They have time and opportunities to access the information by
social media and propagated activities so they put more concern on this problem. The
lowest is own bossiness because they use their time for doing business more than use it for
other issues. There are 3/7 own bossiness respondents (42.9%) thought it is normal to
classify solid waste and 1 person (14.3%) said it is not important. But in general, people in
all occupation highly assess the importance of solid waste.
5.3.6. Assessing the important level of stakeholders in solid waste classification
Stakeholder is one of the key factors that decide the effectiveness of project
implementing. The result of the importance level of stakeholders in solid waste
classification by the answers of 135 respondents is shown in Table 5.12.
Table 5.12. Assessing the important level of stakeholders in solid waste classification
Important level of stakeholders in solid waste
classification
Stakeholders
Local authorities
Volunteers
Local people
Project staffs
Environmental company
Very
important
Important
Normal
Not
important
N
58
43
29
5
%
43.0%
31.9%
21.5%
3.70%
N
7
24
67
37
%
5.19%
17.8%
49.6%
27.4%
N
84
35
11
5
%
62.2%
25.9%
8.15%
3.70%
N
26
51
47
11
%
19.3%
37.8%
34.8%
8.10%
N
41
48
38
8
%
30.4%
35.6%
28.1%
5.93%
(Source: Results calculated by author based on data surveyed, 2016)
19