Monitoring changes in coastal mangrove extents using multi temporal satellite data in period 2000 march 2018 in hai phong vietnam
Bạn đang xem bản rút gọn của tài liệu. Xem và tải ngay bản đầy đủ của tài liệu tại đây (1.07 MB, 104 trang )
VIETNAM NATIONAL UNIVERSITY OF FORESTRY
FOREST RESOURCES & ENVIRONMENTAL MANAGEMENT FACULTY
STUDENT THESIS
MONITORING CHANGES IN COASTAL MANGROVE EXTENTS USING
MULTI-TEMPORAL SATELLITE DATA
IN PERIOD 2000-March 2018 IN HAI PHONG, VIETNAM
Major: Natural Resources Management
Code: D850101
Faculty: Forest Resources and Environmental Management
Student: Tran Thi Ngoc Lan
Student ID: 1453090210
Class: K59B-Natural Resources Management Course: 2014-2018
Supervisor: Assoc.Prof.Nguyen Hai Hoa
Advanced Education Program
Developed in collaboration with Colorado State University, USA
Hanoi, 2018
ACKNOWLEDGEMENT
This research is funded by Vietnam National Foundation for Science and Technology
Development (NAFOSTED) under grant number 105.08-2017.05.
With the consent of Vietnam National University of Forestry, Ministry of Agriculture
and Rural Development faculty, we perform the study: “Monitoring changes in coastal
mangrove extents using multi-temporal satellite data in period 2000-March2018 in Hai Phong,
Vietnam”.
First of all, I am extremely grateful for the guidance and the support of
Assoc.Prof.Nguyen Hai Hoa, who gave helpful advices and strong supports for me during the
implementation and completion of this study.
Secondly, I would like to thank for the encourage, and suggestions of the teachers of the
Forest Resources and Environment Management Faculty, Vietnam Forestry University that
helped me complete the thesis with the best quality.
The thesis could not be finished and achieved good results without the enthusiatic help
of my friends, friendliness, and hospitality of the local authority and residents of Kien Thuy,
Duong Kinh and Do Son districts, especially Dai Hop and Bang La communes, I would like to
give a great thank and extreme appreciation to them.
I also would like to thank my family who always supported and encouraged me to
perform and complete the study.
Because of the limited study duration as well as lacking awareness and knowledgewe
are looking forward to receiving the comments, evaluation and feedback of teachers and friends
to raise the quality of study and improve not only the professional knowledge but also the
lacking skills of me in this study.
i
TABLE OF CONTENTS
ACKNOWLEDGEMENT ............................................................................................................. i
TABLE OF CONTENTS ............................................................................................................. ii
ABBREVIATIONS ..................................................................................................................... iv
LIST OF TABLES ....................................................................................................................... v
LIST OF FIGURES ..................................................................................................................... vi
CHAPTER I. INTRODUCTION ................................................................................................. 1
CHAPTER II. LITERATURE REVIEW ..................................................................................... 4
2.1. GIS AND SATTELITE LANDSAT IMAGE ....................................................................... 4
2.1.1. Concept of GIS, remote sensing and GPS .......................................................................... 4
2.1.2. Landsat and Sentinel 2 Satellite Images ............................................................................. 5
2.2. OVERVIEW OF REMOTE SENSING APPLICATIONS ................................................... 6
2.2.1. In the world ......................................................................................................................... 6
2.2.2. In Vietnam .......................................................................................................................... 8
CHAPTER III. OBJECTIVES, CONTENTS AND METHODOLOGY ................................... 10
3.1. GOAL AND OBJECTIVES ................................................................................................ 10
3.1.1. Overall goal ...................................................................................................................... 10
3.1.2. Specific objectives ............................................................................................................ 10
3.2. OBJECT AND SCOPE OF STUDY ................................................................................... 10
3.2.1. Object ............................................................................................................................... 10
3.2.2. Scope ................................................................................................................................ 10
3.3. CONTENTS ........................................................................................................................ 11
3.4. METHODOLOGY .............................................................................................................. 12
3.4.1. Investigate the current status and management scheme of coastal mangroves ................ 13
3.4.1.1. Inheriting method .......................................................................................................... 13
3.4.1.2. Field survey and sociological investigation method ..................................................... 13
3.4.2. Construct the thematic maps and area changes of coastal mangroves ............................. 14
3.4.3. Assessment the key driver of coastal mangrove dynamics .............................................. 16
3.4.4. Proposing feasible solutions for mangrove forests ........................................................... 16
CHAPTER IV. NATURAL, SOCIO-ECONOMIC AND CULTURAL CONDITIONs .......... 17
4.1. NATURAL, SOCIO-ECONOMIC AND CULTURAL CONDITIONS ............................ 17
4.1. 1. Natural characteristics ..................................................................................................... 17
4.1.2. Socioeconomic and cultural conditions ............................................................................ 19
ii
CHAPTER V. RESULTS AND DISCUSSION ........................................................................ 22
5.1. Current status and management scheme of mangrove forests ............................................. 22
5.1.1. Current status of coastal mangroves in Hai Phong ........................................................... 22
5.1.2. Management scheme of mangrove forests ....................................................................... 23
5.2. Construct thematic maps and area dynamics of coastal mangroves during 2000- March
2018 ............................................................................................................................................ 24
5.2.1. Accuracy assessment ........................................................................................................ 24
5.2.2. Thematic maps of coastal mangroves in period 2000 – March 2018 ............................... 26
5.2.3. Dynamics of coastal mangroves during period 2000 – March 2018 ................................ 29
5.3. KEY DRIVERS OF COASTAL MANGROVE CHANGES FROM 2000 TO March 2018 .... 32
5.4. FEASIBLE SOLUTIONS TO IMPROVE COASTAL MANGROVE MANAGEMENT. 33
CHAPTER VI. CONCLUSION, LIMITATIONS AND FURTHER STUDY .......................... 40
6.1. GENERAL CONCLUSION ................................................................................................ 40
6.2. LIMITATION ...................................................................................................................... 41
6.3. FURTHER STUDY ............................................................................................................. 41
REFERENCES ........................................................................................................................... 42
APPENDIX ................................................................................................................................ 51
iii
ABBREVIATIONS
ACMAMG
Action for Mangrove Reforestation
CF
Coastal Forests
DARDs
Department of Agriculture and Rural Development
DN
Digital Number
DONREs
Department of Natural Resources and Environment
GIS
Geographic Information System
GPS
Global Positioning System
J–M
The Jeffries–Matusita Distance
JRC
Japanese Red Cross
KfW
Kreditanstalt für Wiederaufbau (Germany)
LMIRE
Law on Marine and Island Resources and Environment
LULC
Land Use Land Cover
MARD
Ministry of Agriculture and Rural Development
MDM
Minimum Distance to Mean
MERC
Marine Environment Research Center
ML
Maximum Likelihood
MONRE
Ministry of Natural Resources and Environment
NDVI
Normalized Difference Vegetation Index
NGOs
Non-Government Organizations
PAM
Programme Alimentaire Mondial (French) or World Food Programme
SAM
Spectral Angular Mapping
SCM
Supervised Classification Method
SID
Spectral Information Divergence
UCM
Unsupervised Classification Method
WB
World Bank
iv
LIST OF TABLES
Table 3.1: Landsat image collected in study. ............................................................................. 14
Table 5.1: Coastal mangroves in the study areas (ha). ............................................................... 22
Table 5.2: Accuracy assessments by using 3 classification methods......................................... 25
v
LIST OF FIGURES
Fig.3.1: Map of study sites. ........................................................................................................ 11
Fig.3.2: An overview of methods used for monitoring mangrove extents................................. 12
Fig.5.1: Mangrove management scheme in Hai Phong City ..................................................... 24
Fig.5.2: Land use and land cover in Kien Thuy-Do Son districts from 200 to 2018. ................ 27
Fig. 5.3: Land use and land cover in Do Son- Duong Kinh districts from 200 to 2018. ........... 28
Fig. 5.4: Changes in coastal mangroves in Kien Thuy- Do Son districts and Do Son-Duong
Kinh districts, Hai Phong during 2000-March 2018. ................................................................. 30
Fig 5.5: Fluctuation of mangroves area in (a) Kien Thuy- Do Son and (b) Do Son- Duong
Kinh during 2000-March 2018. .................................................................................................. 31
vi
CHAPTER I
INTRODUCTION
Mangrove forests have been distributing in inter-tidal zones where oceans, freshwater,
and land merge together (Giri et al., 2011). They are among the most productive and complex
ecosystems on the planet, growing under environmental conditions that extremely different
from others (Woodroff et al., 2016; Hong & San, 1993). Furthermore, mangrove forests are
rich in biodiversity providing a habitat for wide varieties of animal and plant species, so it is
considered as nursery of coastal areas by forming a unique intertidal forests at muddy, loose
and wet soils and represented on all continents near the shore belonging tropical and subtropical areas (Asokan, 2012; Kuenzer et al., 2011; Primavera, 1998; Field et al., 1998). This
structure creates an intricate network of habitat for numerous amphibious and marine animals
(Field et al., 1998). Importantly, networks of these sediment-trapping forests buffer the
coastline against wave-induced erosion and provide coastal ecosystems and coastal
communities a vital line of defense against strong, tropical storms. Moreover, the dual services
of coastal protection and habitat for commercially important species make mangrove forests
one of the most valuable ecosystems in the world. Unfortunately, like many coastal and marine
ecosystems, they are being lost at an extremely rapid rate (Romañach et. al, 2018; Spalding,
2010). Clear-cutting for coastal development projects (including construction of shrimp farms,
hotels, and other structures), harvesting for wood, and pollution threaten mangrove forests.
Scientists estimate that at least one-third of all mangrove forests has been lost during the last
few decades (Romañach et. al., 2018). Without active policies that aim to reverse the negative
trend and preserve this system, mangrove forests (and the valuable services that they provide)
may disappear in some areas. In the southern hemisphere, ranges extend further south on the
eastern margins of land masses than on the western (Hogarth, 2015). In addition, mangroves
are also sensitive and fragile related to the change in climate and sea level (Alongi, 2015). This
1
is because of the pattern of warm and cold ocean currents. Indeed local anomalies
of currents and temperature and furthermore the local evolution can create local changes. A
disappearance would represent both an ecological and an economic loss in coastal areas that
people cannot afford.
Vietnam with its 3,260 km of coastline spreads across seven different climatic zones,
which provides appropriate conditions for mangrove development. However, consistent work
has been piloted to plant and protect mangroves by mass organizations such as the Vietnamese
Red Cross and Women’s Union because the expansion of the aquaculture industry was the
main cause of mangrove loss in the 1990s (Jhaveri, 2017). It is forecasted that in the coming
period, the management of forest protection and development in Vietnam faces many
challenges such as impacts of climate change, sea level rise, salinity intrusion and extreme
weather which are the risk of degrading forest ecosystems and biodiversity resources; The
increase in population density and the demand for land for socio-economic development in
Vietnam at a rapid pace put pressure on forest protection and development and monitoring of
forest changes.
Today, the Vietnam Government recognizes the importance of mangrove and other
coastal forests including promoting adaptation, mitigation, and resilience in the face of climate
change by reducing flooding, stabilizing coastlines, securing a range of coastal livelihood
options, sustaining ecosystem services, increasing biodiversity conservation, and supporting
carbon sequestration. In response, the Vietnam government has recently been developing new
laws and policies such as the Law on Marine and Island Resources and Environment (LMIRE)
in 2015 and the Coastal Forests (CF) Decree No. 119/2016/ND in 2016 (Jhaveri et. al., 2017).
Remote sensing technology is one of those accomplishments of aerospace science are
imposed widely used in many economic sectors assembly in many countries around the world
(Satyanarayana et. al., 2018). Potential response the use of remote sensing technology and GIS
2
has helped scientists and major planners have alternative options of strategies in the use,
management of talent natural resources and environment (Hu et. al., 2018). As a result, remote
sensing and GIS are used as an effective tool in management and control close to the current
forest resources (Cissell et. al., 2018; Giri, 2016). To strengthen the management of land use,
the identification area and purpose of land use are significant including a map of land use and
land cover status. Many methods of mapping land use status used GIS technology due to its
high efficiency in information processing, monitoring process change, update information, land
use mapping and evaluation coastal land use changes (Mohammad et. al., 2017; Areendran et.
al., 2013). In Hai Phong City, coastal land use planning is a key step of the assessment in land
use status. Although every year there are reports about mangroves status, most of the owners
report based on drawing, mapping by raditional rudimentary methods, that is one complicated
work, hard work and insistence ask a lot of time (Dat & Yoshino, 2011 & 2015). Furthermore,
the construction of mangrove forest map requires high accuracy and up-to-date information.
Therefore, application of remote sensing images combined with geographic information system
to build a map of mangrove forest change will help local authorities to manage coastal
mangrove forest effectively and efficiently. Firstly, assess the current status and management
scheme in coastal mangroves in Hai Phong City. Secondly, the study evaluated the mangrove
area change in the given period, finally, from which to propose solutions to raise highly
effective mangrove forest management. Starting from that the practical significance and
scientific, I built the study: “Monitoring changes in coastal mangrove extents using multitemporal satellite data in Hai Phong, Vietnam from 2000-March2018.”
3
CHAPTER II
LITERATURE REVIEW
2.1. GIS AND SATTELITE LANDSAT IMAGE
2.1.1. Concept of GIS, remote sensing and GPS
GIS (Geographic Information System): An organized collection of computer hardware,
software, geographic data and personnel to efficiently capture, store, update, manipulate,
analyze and display all forms of geographically referenced information about areas of the Earth
(Dangermond, 1990).
Remote sensing: the use of satellite- or aircraft-based sensor technologies to detect and
classify information about an object or phenomenon without making physical contact with the
object and thus in contrast to on-site observation and used in numerous fields, including
geography, land surveying and most Earth Science disciplines (Lillesand et. al., 2014).
GPS (Global Positioning System): is a satellite-based radio navigation system global
navigation
satellite
system that
provides geo-location
and time
information to
a GPS
receiver anywhere on or near the Earth where there is an unobstructed line of sight to four or
more GPS satellites (Hofmann-Wellenhof et. al., 2012).
NDVI (normalized Difference Vegetation Index): an indication of whether the density of
the vegetation from the reflectance infrared plant or not. NDVI is based on the principle of
spectral difference that based on strong vegetation absorbance in the red and strong reflectance
in the near-infrared part of the electromagnetic spectrum (Satapathy, 2007).
Supervised Classification method (SCM): Supervised classification required the analyst
to select training samples from the data which represented the themes to be classified (Jensen &
Lulla, 1987). The training sites were geographical areas previously identified using groundtruth to represent a specific thematic class (Brewer, 2012). Then the statistics of the Digital
Number (DN) associated with the training sites are used to classify each pixel in the satellite
4
imagery into the corresponding land use and land cover classes. Several algorithms of the
supervised approach are available viz., Parallelepiped, Minimum Distance to Mean (MDM),
maximum likelihood (ML), Mahalanobis Distance, The Jeffries–Matusita (J–M) Distance,
Linear Discriminant Analysis, Spectral Angular Mapping (SAM), and Spectral Information
Divergence (SID) (Kantakumar & Neelamsetti, 2015). In this study, the widely used maximum
likelihood classification technique was adopted for LULC classification.
Unsupervised classification method (UCM): Due to time shortage, prior knowledge is
difficult to obtain due to the influence of a complex background, various character, and images
noise. Therefore, unsupervised classification is of great value in remote sensing images
processing (Rozenstein & Karnieli, 2011; Le Hegarat-Mascle et. al., 1997).
2.1.2. Landsat and Sentinel 2 Satellite Images
Landsat is moderate spatial-resolution imagery that provides large areas of repeated
data coverage at a scale that enables users to see detailed human-scale processes, such as
urbanization, but not individual houses. Since 1972, Landsat program satellites have collected
consistent spectral imagery of the Earth’s continents and surrounding coastal regions. This
historical archive is unmatched in quality, detail, coverage, and length, enabling people to study
many aspects of the planet and evaluate the dynamic changes caused by natural processes and
human practices.
There are 8 Landsat satellites. Landsat 5 was launched in 1984 and holds the world
record for being the longest-serving Earth-observing satellite in operation, serving for more
than 29 years, until 2013. Landsat 5 was utilized for longer than expected because Landsat 6
was unable to attain orbit following launch in 1993. Landsat-5 is recognized in the Guinness
World Records for the longest operating Earth observation satellite in history operating for
nearly 30 years. With a three-year design life, no one could have imagined its longevity a
quarter of a century after. Landsat-5 collected imagery for major events including Chernobyl,
5
the devastating tsunami in South Asia, devastating snowstorms in Quebec, the Birmingham
Tornado in 1998 and deforestation in tropical regions. Landsat 7 remains in orbit after having
been launched on April 15, 1999. Landsat 8, the newest Landsat, was launched on February 11,
2013. As it orbits the Earth in a north-south pattern, Landsat 8 captures imagery from
approximately 438 miles (705 km) above the surface of the Earth. Landsat complete a full orbit
of the Earth in about 99 minutes, allowing the Landsat to achieve about 14 orbits per day. The
satellites make a complete coverage of the Earth every 16 days (Rosenberg, 2017).
The Landsat satellites make loops around the Earth and are constantly collecting images
of the surface through the use of a variety of sensing devices. Todays, the satellite image is the
best tool to help people to observe the Earth and other planets in the solar system as well as
serving for research monitoring, data collection.
2.2. OVERVIEW OF REMOTE SENSING APPLICATIONS
2.2.1. In the world
Land use and cover changes are the concerned issues in sustainable development and
global environmental changes of many countries in the world (Son et. al., 2015; Long et. al.,
2013; Datta & Deb, 2012; Shalaby & Tateishi, 2007). In recent years, more and more
researchers have been used Geographical Information Systems (GIS) and remote sensing (RS)
techniques for monitoring land use changes. Nevertheless, RS data and GIS techniques have
been updated in order to serve large users. The Landsat satellite program (formerly called Earth
Resources Technology Satellite), has a > 40 year duration and has employed the use of six
satellites (Landsats 1, 2, 3, 4, 5, 7). The Landsat data archive provides the unique ability to
analyze particular areas on the Earth’s surface for a > 40 year period (1972 – present) (Burnett
and Blaschke, 2003). Additionally, Ozesmi and Bauer (2002) have noted that ―middle infrared
Landsat TM bands provide for much of the separability between wetland types‖ (Ozesmi and
Bauer, 2002).
6
Remote sensing refers to the acquisition of information on a given target without
making contact with the target. It uses the entire electromagnetic spectrum, ranging from short
wavelengths (for example, ultraviolet) to long wavelengths (microwaves) (Liang, 2007).
Inherently, the products or images obtained from many remote sensing devices that can be used
for mapping and classification purposes are stored digitally in a raster data structure. In fact,
there are a number of satellite imagery products that may be of value for forestry and natural
resource management purposes. Each satellite system was designed to collect data
representative of the spectral reflectance of features, and to store data in grid cells that have
spatial resolutions of various sizes, depending on the data capture protocol employed. Landsat
data have a wide variety of uses, from the identification of vegetation and topography to the
identification of spatial patterns of disturbances (Keppel et al., 2012), forest structures (Hyde et
al., 2006; Rouget et al., 2003; Lim et al., 2003), and biomass (Lu, 2006). Changes over time in
forest cover and fragmentation have also been estimated using Landsat data (Hansen and
Loveland, 2012; Yuan et al., 2005), as have the distribution of wildlife species and their habitat
(Clevenger et al., 2002). Further, Landsat data have been used to study assess wildfire severity
(Johnson and Gillingham, 2004). From its humble beginning, remote sensing technology has
today grown in stature to influence virtually all aspects of human endeavor and the
environment. Coupled with the availability of historical remote sensing (time-series) data, the
overall reduction in data costs and increased spatial resolution in remote sensing data, remote
sensing technology appears poised to make an even greater impact in many socioeconomic and
political endeavors of mankind. To realize the full potential of this mapping technology,
however, it is imperative to integrate remote sensing with other related technologies that deliver
geospatial data and information (Awange and Kiema, 2013).
7
2.2.2. In Vietnam
Along with the race development of technology, Vietnam has applied the advanced
scientific technology in the management, protection and development of forest resources in
general and mangrove resources in particular. In which, the application of remote sensing
technology in the research of solutions to protect and manage natural resources and
environmental monitoring is also necessary and priorities. Since then, researchers and scientists
have embarked on researching remote sensing technology and its application to problems
related to mangroves. Mangrove forests in Hai Phong province bring a number of benefits to
not only local people but also entire province and country; the researchers caused concern and
have interest in the subject. Specifically, Hai Hoa Nguyen et al (2013) studied the relationship
of spatial-temporal changes in fringe mangrove extent and adjacent land-use in Kien Giang
coast and Thanh Son Nguyen, Xuan Thanh Bui and Thi Da Chau (2016) monitored mangrove
forest changes in Can Gio Biophere Reserve using multi-temporal Landsat Data. These
researches mentioned the essential roles of mangrove forests and outlined the awareness of
people in coastal resource management as how mangroves effect and influence of people. Tien
Dat Pham (2011) was also involved in topic research monitoring mangrove forest using multitemporal satellite data in the Northern Coast including Hai Phong as the results indicated the
ability to protect sea dyke as well as directly economic benefits mangroves provide. In addition,
the project also pointed out the dynamics of mangroves over years. Moreover, many different
researches using remote sensing equipment research mangrove issues such as: Thu Pham Minh
and Populus (2007) conducted the project of research and application of remote sensing and
GIS technology to determine status and changes of mangroves in Tra Vinh. As a result shows
that the selection of remote sensing and GIS technology is the optimal solution in the work of
mapping the current and changed areas of mangroves. Remote sensing tool allows collecting
information of objects on a wide area and in a short time, accurate, fast and efficient, meeting
the requirements of information synchronized.
8
Lam-Dao et al. (2011) conducted
the project of application remote sensing to detect
the change of land use and river bank in Mekong Delta. This study indicate that based on a
combination of vegetation index allow the establishment of vegetation cover map in Mekong
Delta from 1973 to 2008 quickly and accurate. Especially, this study used Digital Shoreline
Analysis System package to analyze trend of changes in mangroves effectively.
Tran Thi et. al (2014) also studied at application of remote sensing and GIS for
detection of long-term mangrove shoreline changes in Mui Ca Mau to understand the change of
mangrove shorelines and distance from 1953 to 2011. The results were important in predicting
changes of coastal ecosystem boundaries and enable advanced planning for specific sections of
coastline, to minimize or neutralize losses, to inform provincial rehabilitation efforts and reduce
threats to coastal development and human safety.
Tien Dat Pham et al (2017, 2016, 2015, 2012 and 2011) did a numerous research about
mangroves in Hai Phong city with different remote sensing data such as ALOS, ALOS-2 and
PALSAR. Hence, these researches gave readers the amount of aboveground biomass,
mangrove loss from 1989 to 2001 and gain from 2001 to 2013 then indicated the potential for
use of multi-temporal LANDSAT data together with image segmentation and a GIS approach
for mapping mangrove forest in the coastal zone.
In general, remote sensing and GIS technology have currently been applied in a wide
range of in natural resources and environmental management. Satellite remote sensing data can
be used for large areas over time and thus represent an indispensable tool for mangrove forests
monitoring, as coastal wetlands spread over extended and inaccessible areas. However, in
Vietnam few studies have used satellite data to analyze mangrove forest change in different
periods, especially on the Northern coast. Prior research on mangrove forest using satellite data
in Vietnam is limited and there is a lack of available data. Satellite remote sensing data can be
used for large areas over time and thus represents an indispensable tool for mapping mangrove
forests where access for survey is limited and inconvenient (Pham and Yoshino, 2015).
9
CHAPTER III
OBJECTIVES, CONTENTS AND METHODOLOGY
3.1. GOAL AND OBJECTIVES
3.1.1. Overall goal
This study aims to provide a scientific basis for better management of coastal mangrove
using remote sensing data in Vietnam.
3.1.2. Specific objectives
Objective 1: To investigate the current status and management schemes of coastal
mangroves in selected coastal sites of Hai Phong city.
Objective 2: To construct thematic maps and changes in coastal mangrove extents of
coastal mangroves using multi-temporal remote sensing data in selected coastal sites of Hai
Phong city.
Objective 3: To identify key driver dynamics in selected coastal sites of Hai Phong city
during 2000- March 2018.
Objective 4: To propose solutions to enhance management of coastal mangroves in the
study areas.
3.2. OBJECT AND SCOPE OF STUDY
3.2.1. Object
The object of this study is the coastal mangrove in 3 districts: Kien Thuy, Do Son and
Duong Kinh, Hai Phong.
3.2.2. Scope
- Temporal scope: This study intends to use remote sensing data from 2000 - March
2018, including Landsat imageries (2000, 2006, 2010) and Sentinel 2 (2016 and 2018)
- Spatial scope: The study will cover all coastal areas where mangroves are distributing
and existing in Dai Hop commune belonging to Kien Thuy district, Tan Thanh commune
10
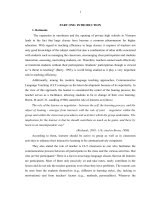
belonging to Duong Kinh district and Bang La, Ngoc Hai, Ngoc Xuyen communes belonging
to Do Son district of Hai Phong City as shown in Fig. 3.1.
Fig.3.1: Map of study sites.
- Object scope: Coastal mangroves are the target of study.
3.3. CONTENTS
- Investigate current status and management board of coastal mangroves in Kien Thuy,
Do Son and Duong Kinh districts, Hai Phong.
- Construct the thematic maps and area changes of coastal mangroves in study regions in
5 periods: 2000 – 2006, 2006 – 2010, 2010 – 2016, 2016 - March 2018 and 2000 – March
2018.
- Assess the key drivers of coastal mangrove changes in study regions using in period
2000- March 2018.
11
- Propose possible solutions for enhancing the efficiency of coastal mangrove protection
and management in study regions.
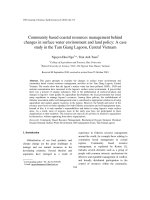
3.4. METHODOLOGY
To understand and follow easily, methodology were divided as Fig.3.1 below:
Data collection
GIS data,
statistic data
Remote sensing
image
Data
information in
the field
Analyses and process
image
Maps of the mangrove
current status with years
Thematic and dynamic
maps of mangrove over
years
Key drivers of
mangrove changes over
years
Solutions for coastal
mangrove forests
management
Fig.3.2: An overview of methods used for monitoring mangrove extents.
12
3.4.1. Investigate the current status and management scheme of coastal mangroves
3.4.1.1. Inheriting method
To perform this study and improve efficiency, science and inheritance of the study,
study used inherited data from the previous studies about remote sensing and GIS technology,
and applications of it in the study mangroves in general and the training samples for classifying
coastal mangroves in particular. Study selectively used multiple documents, legal documents,
scientific data, essays, and projects, scientific researches in the country and abroad to
accurately give information and closest to reduce the amount of information included in the
study but did not diminish the quality of the research.
Study use inheritance to collect data with the following information:
- The study, texts, documents, data from the agency, the sectored level, books,
dissertations, projects relating to the use of remote sensing and GIS technology to study forest
mangrove in Vietnam and the world.
- The researching, reports, thesis relating to distribution and structure, training the
sampling for classify coastal mangrove, dynamic coastal mangrove in Vietnam and the world.
- The natural conditions, economic and social of study area.
- Characteristics of Landsat, Sentinel 2.
3.4.1.2. Field survey and sociological investigation method
In order to have base for accuracy assessment process of coastal mangrove and other
purposes also, GPS points were collected in Kien Thuy, Duong Kinh and Do Son, Hai Phong.
After determining the location study area, we were conducting the sampling, while also
conducting sociological surveys by interviewing local government and two of Dai Hop and
Bang La, inhabitants to provide the most accurate information. Also through feedback and
suggestions as well as the local people, subjects can take measures to help local government,
forest management and people improve efficiency of forest resources mangrove areas of
13
research, protection and development in parallel with mining, fishing products. Sociological
survey form is in appendix.
3.4.2. Construct the thematic maps and area changes of coastal mangroves
3.4.2.1. Landsat and Sentinel 2 Data
In the study, subject used Landsat and Sentinel satellite images as Table 3.1 to monitor,
investigate, and classify coastal mangroves and monitor fluctuation mangroves as well as their
changed
Table 3.1: Landsat image collected in study.
ID
Image codes
Date
Resolution
Path/Row
(m)
(GRIDS)
1
LT05_L1TP_12604620001105
2000/11/05
30
126/46
2
LT05_L1TP_12604620060412
2006/04/12
30
126/46
3
LT05_L1TP_12604620101203
2010/12/03
30
126/46
4
S2A20160909T110117
2016/09/09
10
T48_QXH
5
S2A20180322T031541
2018/03/22
10
T48_QXH
Source:
3.4.2.2. Image processing
Landsat 5 and Sentinel 2 images were downloaded from Earth Explorer. Image
clustering channels was collected including individual spectral channels due to needing
combination and composition to easy conduct steps later.
Sentinel data conclude difference bands, so combination bands are necessary for image
interpretation. This study combine band 2, 3, 4, 8 which represent for blue (490 nm), green
(560 nm), red (665 nm), and near-infrared (842 nm), respectively.
ArcTool box => Data Management tools => Raster => Raster Processing =>
Composite bands
14
After having combinative and composited image, the study area not only coastal
mangrove area but also including other areas, thus need to cut separating the study area or the
study coastal mangrove to study and analyses image by the study area boundary in the
newspaper and photographs. To make it convenience for image processing, reducing waste
time for processing unnecessary area, clip need to be done and by the following step:
ArcTool box => Data Management tools => Raster => Raster Processing => Clip
3.4.2.3. Analyses and processing of remote sensing image
The number of samples are built large enough to be representative for the state of the
objects and are evenly distributed throughout study area. During constructingtraining samples
for classifying coastal mangroves, we conducted sampling of the total 6 representing samples
of objects in the study area.
3.4.2.4. Accuracy assessment
Combined with the results of field surveys, visual interpretation and comparison on
Earth Explorer and ArcGIS, we constructed training samples for classifying coastal
mangrovesconsisting of 6 representatively typical samples for each area of study.
Using of forestry surveying experience, we chose the actual picture corresponding to
each object. Each sample will help the study have highly scientific results.
Identifying accuracy for
All in all, study based on collected data and documents for mapping mangrove
fluctuation in the study areas. The Landsat be used as Landsat satellite imagery in 2000, 2006,
and 2010 while Sentinel 2 was used for mapping mangrove changes in 2016 and 2018. After
determining the accuracy of the maps fluctuation, the highest classification methods was
chosen to map mangroves fluctuation in the study area in 2000, 2006, 2010, 2016 and 2018 by
integrating two maps of two years to complete the map fluctuation study area in 5 years.
15
3.4.3. Assessment the key driver of coastal mangrove dynamics
The data collected from the study were supplemented with further researches on the
literature, which initially pointed out the main factors affecting the change in mangroves. In
addition, the topic also uses the information obtained from interviews with local people to find
out the key drivers which support to propose solutions.
3.4.4. Proposing feasible solutions for mangrove forests
To propose solutions for better management situation, this study based on the
information and results of mangrove fluctuation maps and other case studies. The solution was
be proposed for a better management situation, enhance quality and quantity of mangrove and
especially, rising local people’s livelihood and climate change mitigation.
16
CHAPTER IV
NATURAL, SOCIO-ECONOMIC AND CULTURAL CONDITIONs
4.1. NATURAL, SOCIO-ECONOMIC AND CULTURAL CONDITIONS
4.1. 1. Natural characteristics
4.1.1.1. Geographical location
Hai Phong is a coastal city, located on the East Coast of the North, 102 km north of
Hanoi, the North and Northeast by Quang Ninh, the Northwest by Hai Duong, the South West
by Thai Binh and the East. It is the coast running in the direction of northwest - southeast from
the east of Cat Hai Island to Thai Binh estuary. It is a place full convergence of advantages of
sea, railway, road and air, convenient exchange with provinces in the country and countries
around the world. Due to the seaport, Hai Phong has played an important role in the import and
export of the North, quickly receiving scientific and technological achievements from abroad
and spreading them on a large scale from the northern zone.
The extreme points of Hai Phong city are:
North Pole is Lai Xuan Commune, Thuy Nguyen District.
The West is Hiep Hoa commune, Vinh Bao district.
Southern pole is Vinh Phong commune, Vinh Bao district.
Dong Dong is Ngoc Hai Ward, Do Son District.
4.1.1.2. Topography, climate, hydrology and natural resources
The total area of Hai Phong is 1,519 km2, including two island districts (Cat Hai and
Bach Long Vi). Mountains and hills occupy 15% of the area, distributed mainly in the North,
so the northern terrain has the geological structure and shape of the midland with hills and hills;
the south has a low topography and is quite flat. The terrain is typical of the delta plain, which
tilts to the sea, with an elevation of 0.7 to 1.7 m above sea level. The sea is Cat Ba island is like
the pearl of Hai Phong, a beautiful island and the biggest island population has over 360
17
islands, small gathering and it next to the island of Ha Long Bay. Cat Ba Island is 200 m above
sea level, about 100 km2, 30 nautical miles from the city. More than 90 km southeast of Cat Ba
Island, Bach Long Vi Island is quite flat, with plenty of white sand.
Mountain hills, plain
The northern terrain of Haiphong is midland, with hills interspersed with plains and
descending south to the sea. This hilly area is associated with the Quang Ninh mountain
system, a relic of the ancient folded foundations below, where previously there has been a
small scale depression, including sandstone, shale and rock Lime of different ages is distributed
in continuous bands in the direction of North West - Southeast from mainland to the sea of two
main ranges. The range runs from An Lao to Do Son, spanning about 30 km northwestsoutheast. Ky Son - Trang Kenh and An Son - Nui Deo ranges, consisting of two branches: An
Son - Nui Deo, sandstone with north west and southeast direction, including Phu Luu, Thanh
Lang and Nui Deo mountains; and the Ky Son - Trang Kenh in the northwest - southeast
direction with many limestone mountains.
Coast and sea
Hai Phong coastline is 125 km2 long, low and fairly flat, mostly sandy mud due to 5
main river mouths to the sea. In addition, Hai Phong also has Cat Ba island which is a
biosphere reserve world that has beautiful beaches, white sand, blue water and Lan Ha Bay. Cat
Ba is also the largest island in the Halong Bay.
River
The riverside in Hai Phong is quite high, with an average density of 0.6 - 0.8 km / 1
km². The slope is quite small, flowing mainly in the north-west direction. This is where all the
downstream of the Thai Binh River flows into the sea, creating a fertile lowland, abundant
fresh water for human life here. Hai Phong has 16 main rivers spreading over the city with a
total length of over 300 km, the main rivers in Hai Phong include:
18