Key factors influencing to the participation of local household in REDD program in ban cam commune bao thang district lao cai province
Bạn đang xem bản rút gọn của tài liệu. Xem và tải ngay bản đầy đủ của tài liệu tại đây (692 KB, 48 trang )
MINISTRY OF AGRICULTURE AND RURAL DEVELOPMENT
VIETNAM NATIONAL UNIVERSITY OF FORESTRY
STUDENT THESIS
Title
Key factors influencing to the participation of local
households in REDD+ program in Ban Cam commune,
Bao Thang District, Lao Cai Province
Major: Natural Resources Management
Code: D850101
Faculty: Forest Resources and Environmental Management
Student: Dang Thi Hai Ha
Student ID: 1253091616
Class: K57 - Natural Resources Management
Course: 2012 - 2016
Advanced Education Program
Developed in collaboration with Colorado State University, USA
Supervisor: Dr. Le Dinh Hai
Ha Noi, 10/2016
Abstract
Nowadays, the impact of climate change is affecting directly to the forests and the
livelihoods of people who depend on forests, and REDD+ project is expected to bring in
greater space for local level planning and management for forest ecosystem restoration. In
2015, Vietnam applied REDD+ to Ban Cam commune, Lao Cai province. There are a wide
range of factors influencing directly and indirectly to the decision of participating REDD+.
The decision to participate in REDD+ program were effected by ten factors: (1) Ethnicity; (2)
Age; (3) Education level of household head; (4) Occupation of household head; (5)
Household wealth ranking; (6) Number of labour; (7) Concerning about forest degradation;
(8) Forest land area; (9) Rationality of the government payment, and (10) Understanding of
local people about REDD+ policy. By using IBM®SPSS® Statistics v.23, there are 5 key
factors were determined including ethnicity, concerning about forest degradation, forest land
area, the rationality of the government payment, and the understanding of local people about
REDD+ policy. Moreover, the study have found some potential solutions for increasing the
number of people who participate REDD+ program. They are focused on land allocation, the
hamlet leaders and education activities to raise the local people‘s awareness about forest area
management.
Acknowledgement
I am pleased to have an opportunity to express my gratitude to everyone who
supported me throughout the study process. I am sincerely grateful to them for sharing their
truthful and illuminating views on a number of issues related to this research.
I express my warm thanks to Dr. Le Dinh Hai from Faculty of Economics and
Business Management, Viet Nam National University of Forestry for his continuous support,
patient guidance and enthusiastic encouragement during this research.
I am deeply indebted to Prof. Lee Macdonald, Department of Ecosystem Science and
Sustainability, Colorado State University for his enthusiastic guidance to during the planning
of this research work.
My joy knows no bounds in expressing my cordial gratitude to Mr. Dao Van Tuan,
vice president of Ban Cam Communal People‘s Committee and the leaders in Ban Lot, Ban
Cam, Nam Tang, Nam Choong, Nam Chu, and Na Nang hamlet who devoted their time to
help me during the field survey. I humbly extend my thanks to local people in Ban Cam
commune for providing me helpful information in this study.
Finally, I owe a deep sense of gratitude to my friends and family for their supports,
encouragements during the process of doing research and going field works.
CONTENTS
LIST OF FIGURES
LIST OF TABLES
1.
INTRODUCTION ............................................................................................................... 1
2.
STUDY GOALS AND OBJECTIVES ............................................................................... 3
3.
CONCEPTUAL FRAMEWORKS ..................................................................................... 4
4.
3.1.
Social capital aspects ................................................................................................... 5
3.2.
Socio-economic and demographic attributes ............................................................... 5
3.3.
Formal institutions ....................................................................................................... 7
METHODOLOGY .............................................................................................................. 8
4.1.
4.1.1.
Lao Cai province .................................................................................................. 8
4.1.2.
Ban Cam commune ............................................................................................ 10
4.3.
Data collection ........................................................................................................... 13
4.3.1.
Questionare design ............................................................................................. 13
4.3.2.
Questionnaire pretesting ..................................................................................... 13
4.3.3.
Questionnaire revision ........................................................................................ 14
4.3.4.
Sampling design ................................................................................................. 14
4.4.
5.
Selection of research site ............................................................................................. 8
Data analysis methods ............................................................................................... 14
RESULTS.......................................................................................................................... 19
5.1.
Descriptive statistics on surveyed households in Ban Cam commune ...................... 19
5.1.1.
Quantitative variables ......................................................................................... 19
5.1.2.
Qualitative variables ........................................................................................... 19
5.2.
Key drivers affecting to the participation to REDD+ program
of local households ............................................................................................................... 23
5.2.1.
The correlation between the surveyed factors and the participation
of local people to REDD+ ................................................................................................. 23
5.2.2.
The key factors influencing to the participation of local people
to REDD+ program ............................................................................................................ 24
6.
DISCUSSION ................................................................................................................... 26
6.1.
Socioeconomic status background of local households ............................................. 26
6.2.
The household factors that leading to the decision of participating
to REDD+ program ............................................................................................................... 27
6.3.
Potential actions which may increase the number of participation
in REDD+ program in Ban Cam commune .......................................................................... 29
6.4.
Limitations and suggestions for future research ........................................................ 32
6.5.
Recommendations ...................................................................................................... 32
7.
CONCLUSIONS ............................................................................................................... 33
8.
REFERRENCES ............................................................................................................... 34
LIST OF FIGURES
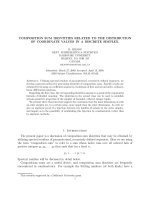
Figure 1. Factors influence to the parcitipation to REDD+ program ......................................... 5
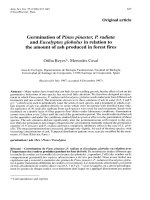
Figure 2. Map of Lao Cai Province, Vietnam ............................................................................ 9
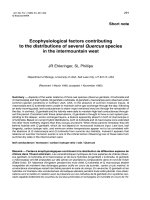
Figure 3. Map of Bao Thang district, Lao Cai Province .......................................................... 10
Figure 4. Map of Ban Cam commune, Bao Thang district, Lao Cai Province......................... 10
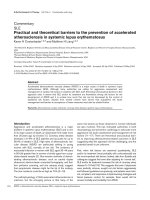
Figure 5. Map of forest management before 1979 ................................................................... 12
Figure 6. Map of forest management after 1979 (January 2015) ............................................. 12
Figure 7. Educational level of household heads in Ban Cam commune .................................. 21
Figure 8. Occupation of household heads in Ban Cam commune............................................ 21
LIST OF TABLES
Table 1. Particular socioeconomic characteristics in Ban Cam commune ............................... 12
Table 2. Survey sampling design in Ban Cam commune ......................................................... 14
Table 3. List of independent variables...................................................................................... 16
Table 4. Dependent variable and independent variables .......................................................... 18
Table 5. Descriptive statistics of the quantitative variables ..................................................... 19
Table 6. Ethnic minorities in Ban Cam commune.................................................................... 20
Table 7. Household wealth ranking and forest land area in Ban Cam commune..................... 20
Table 8. Concerned about forest degradation in Ban Cam commune ...................................... 22
Table 9. The rationality of payment from the government....................................................... 22
Table 10. The understanding about REDD+ program.............................................................. 23
Table 11. Significant correlation of factors to the participation of respondents
in REDD+ program .................................................................................................................. 24
Table 12. Classification table of predicting the participation of local people to REDD+ ........ 24
Table 13. Key drivers affecting to the participation to REDD+ program
of surveyed households ............................................................................................................ 25
Table 14. Table of influential factors and their orders ............................................................. 29
1.
INTRODUCTION
Climate change is one of the most serious issue that the world is facing today. The
impact of it is affecting directly to the forests and the livelihoods of people whose living
depend on forests. The Fourth Assessment Report of the Intergovernmental Panel on Climate
Change indicates that the forestry sector, mainly through deforestation, accounts for about
17% of global greenhouse emissions. In many developing countries, carbon dioxide emissions
mostly come from the deforestation, forest degradation, forest fires and slash and burn
practices. Obviously, moving people out of the forest is not always the viable solution to
reduce the greenhouse gas emissions. Hence, the goal of scientists is find out the way for
ensuring the life of people who living near the forest. Many countries are launched the
program: ―Reducing emissions from deforestation and forest degradation‖ (REDD). That is a
mechanism designed to provide financial rewards for ensuring the forest land is going to
provide continuing benefits. REDD+ strategies go beyond deforestation and forest
degradation, it include the role of conservation, sustainable management of forests and
enhancement of forest carbon stocks in reducing emissions.
Several international agencies are creating REDD+ programs for developing countries
to preserve their forest, including Vietnam. The UN-REDD Vietnam Phase II program,
processed by Vietnam Administration of Forestry from 2013 to 2015, was applied to six pilot
provinces of Lao Cai, Bac Kan, Ha Tinh, Binh Thuan, Lam Dong and Ca Mau.
Lao Cai is the Northern mountainous province of Vietnam which has total forest land
area of 638,389 ha (UN-REDD, 2013). This is the province that has complex drivers of
deforestation and forest degradation, including conversion of degraded natural forest to rubber
plantation, forest fire, mining activities, illegal logging and selective logging. The first place
in Lao Cai that applied REDD+ programs is Ban Cam commune in Bao Thang district, which
has the area of 42.14 km2 and a population of 3118 people in 1999.
1
Once REDD+ programs are fully functioning, forest land will be allocated to local
people, especially ethic minorities by the government. Owners of forests may be eligible to
receive money for environmental benefits provided by the trees, and they can be lent the
money from REDD+ program for their animal husbandry activities instead of totally
depending on forests. In addition, their management is necessary to implement the methods of
maintaining and increasing carbon stocks as well as providing a cheap but effective form to
control forest.
Therefore, the participation of local people plays a vital role in the succession of
REDD+ program. This study with the title ―Key factors influencing to the participation of
local households in REDD+ in Ban Cam commune, Bao Thang District, Lao Cai Province‘ is
conducted to indicates some factors that might influence to the decision of household
participating in REDD+ program.
2
2. STUDY GOALS AND OBJECTIVES
Goals: Identifying the key factors influencing on the participation to REDD+ program
of local people in order to provide suggestions in implementing REDD+ program in Ban Cam
commune, Bao Thang district, Lao Cai province.
Specific objectives:
o
To define the socioeconomic status background of local households which are
participating and not participating to REDD+ program.
o
To determine the household factors that leading to the decision of participating to
REDD+ program.
o
To provide the potential suggestions for REDD+ program which may encourage
people to participate in the program
3
3. CONCEPTUAL FRAMEWORKS
The term ‗participation‘ is defined as ―an active process whereby beneficiary or client
groups influence the direction and execution of the development or management of a natural
resource to enhance their well-being in terms of income, personal growth, self-reliance or
other values‖ (Little 1993). Citizen‘s participation is described by Sherry R. Amstein (1969)
as a ―ladder‖, which eight rungs rising from non-participation to participation with decisionmaking power. This ladder is roughly 50 years old but it is still referenced today, and public
participation entails more than simply giving opinions. However, Amsteir failed to address
the poor because the real world needs to have ―as many as 150 to cover the range of actual
citizen involvement level‖, so Connor (1988) has developed a new ladder of citizens‘
participation that addressed the issue of the the location of programs ranging from rural and
urban area. It prevented and resolved the the controversy about various proposals, in which
resolution is the highest rung because ―resolution of a controversy about a proposed policy,
program or project implies acceptance by most of the parties involved in the agreed solution‖,
and REDD+ is one of the examples.
According to Lingani (2011), the factors influenced the forest management program
are shaped by the structure of incentives for the members, which is affected by the context.
The context, in turn, is defined as (1) the social network system (norms, values, and social
capital), (2) members' socio-economic and demographic attributes (gender, age, level of
education and income, etc.) and (3) the internal and external institutional context.
As far as REDD+ is concerned, REDD+ is the program that provides an incentive for
local people to manage forests sustainably. Therefore, this study follows the groups of three
factors that was mentioned above.
4
Social capital
Socioeconomic and
demographic
attributes
Formal
institution
- Norms and values
Age, educational
level, residence
status, income level,
land tenure status.
Policy of forest
support
programs, land
and tree property
rights.
- Information, trust and
norms of reciprocity.
Participating of local people to
REDD+ program
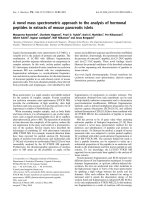
Figure 1. Factors influence to the participation to REDD+ program
Modify from Coulibaly et al. (2011)
3.1. Social capital aspects
Social capital, which includes human resources, social interaction, trust, working
together, is defined as ―features of social organizations, such as networks, norms, and trust—
that enable participants to act together more effectively to pursue shared objectives‖ (Putnam
1993). Four central features of social capital have been identified: (1) relations of trust; (2)
reciprocity and exchanges; (3) common rules, norms, and sanctions; and (4) connectedness in
networks and groups (Pretty and Ward 2001). These features enable participants to act more
effectively. According to Pretty and Smith (2004), social capital is recognized as an important
resource for shaping individual's participation in biodiversity conservation.
3.2.
Socio-economic and demographic attributes
Household characteristics are the key factor that influence the decision-making of
local people (Dolisca, Carter et al. 2006). Several study have shown that participation may
depends on socio-economic and demographic backgrounds such as household size, education
level, age of the head of household, income and land tenure status (Khalkheili and Zamani
2009, Coulibaly-Lingani, Savadogo et al. 2011).
5
Education level: It has been scientifically proven that education also influences to
local people's participation in forest management and conservation. In Viet Nam, there are
five fundamental levels of education. That is illiteracy, primary school, secondary school,
high school, and higher education (Kính and Chí 2008).
Age of the head of household: Several studies (Dolisca, Carter et al. 2006, Atmiş,
Daşdemir et al. 2007) have found that older farmers are generally interested in collecting
forest resources, while younger counterparts are more willing to participate in and contribute
to decision-making that affect forestry programs.
Income level: Many scholars show that poorer people are more dependent on natural
products (Newmark, Leonard et al. 1993, McGregor 1995) They may know about improved
seeds, fertilizers, and pesticides without being able to obtain access to them and to employ
these factors in practicing sustainable farming methods (Dolisca, Carter et al. 2006).
In Vietnam, Pursuant to the Prime Minister‘s Decision No. 09/2011/QD-TTg of
January 30, 2011, on setting norms on poor households and households in danger of falling
into poverty for the 2011-2015 period, Vietnam‘s norms on poor households are shown in this
table below.
Income of poor
(VND/member/month)
Rural
households
Urban
households
Income of moderate
Income of rich
households
households
(VND/member/month) (VND/member/month)
400,000 - 520,000
1,000,000 – 1,500,000
> 1,500,000
500,000 - 650,000
1,300,000 – 1,950,000
> 1,950,000
Land tenure status
Land tenure status influences local people's motivation to participate in forest
management activities; notably (Zhang and Pearse 1996) found that secured forms of long-
6
term tenure provide more benefits for their holders and are more likely to stimulate
reforestation than short-term, unsecured tenure.
As far as REDD+ program is concerned, Local governance has been proposed as a
way of conserving forests and ensuring local livelihoods in a cost-effective way compared to
centralized governance (Sandbrook, Nelson et al. 2010), which again suggests that clarifying
land tenure is a key step for REDD+ success (Sunderlin, Larson et al. 2009)
3.3.
Formal institutions
According to Sawadogo (2006), the results of formal institutions in Burkina Faso
indicated that regulatory frameworks have been set in place for the management of the forests,
such as the Agrarian and Land Reform, the Environment Code, the Forestry Code, the
Proclamations on the Orientation of Decentralization, the National Forestry Policy and the
National Program of Forests Management (Sawadogo 2007). These frameworks of laws,
policies and institutional processes emphasized the importance of local people's participation
in forest management. For example, the National Forestry Act stipulates that local
communities must be given responsibility for managing natural resources and the
environment. Therefore, the participation of local people in the management of forests has
become an important component of environmental policy in the country.
7
4. METHODOLOGY
4.1.
Selection of research site
4.1.1. Lao Cai province
Lao Cai is a mountainous province in the Northwest of Vietnam. It is about 345 km far
from Hanoi. The geographic coordinates are from 22o09‘ to 22o52' North latitude, and from
103o31' to 104o28‘ East longitude. Lao Cai shares the borders with Ha Giang province on the
East, Son La and Lai Chau provinces on the West, Yen Bai province on the South, and with
Yunnan
Province,
China
on
the
North
(203
km
bordering
with
China)
( />Topography: Lao Cai is situated in the region which has the highest elevation in
Indochina, Most of the land area lies between 300m to 1,000m above sea level. Therefore the
topography is complex with two parallel mountain ranges, the Hoang Lien Son mountain
range, and Elephant mount, both of them oriented from North-west to South-east. Phanxipan
is the mountain which has the highest peak in Vietnam, at 3,143m above sea level.
Climate: Lao Cai has a tropical monsoon climate, but is affected by complex terrain
factors, resulting in diverse micro-climates (UN-REDD 2013). Sudden changes in
temperature often occur. Lao Cai's climate is divided into two seasons: the rainy season is
from April to October and the dry season from October to March each year. The average
temperature in the lowlands (including Ban Cam commune) is from 23°C to 29°C, and the
average annual rainfall is from 1,400mm to 1,700mm per year. Fog is common in some
places.
Soil: Soils generally are of high fertility and are diverse, with 10 soil groups and 30
soil types which are suitable for many different crops.
Population: The ethnic composition of the population is very diverse with 25 ethnic
groups of which the Kinh group accounts for 35.9% of the population. The largest group
among the ethnic minority groups is H‘Mong (22.2%); other groups are Tay (15.8%), Dao
8
(14%), Giay (4.7%), Nung (4.4 %), Phu La, San Chay, Ha Nhi, and La Chi. Lao Cai has a
high poverty rate of 40.1% (GSO 2010). The literacy rate among women is the lowest among
the provinces of the country (70%) ( />Lao Cai is the pivotal province for watershed protection activities, especially for
downstream provinces. Thus, it is one of six pilot provinces enabled to plan and implemented
REDD+ actions.
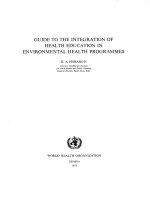
Figure 2. Map of Lao Cai Province, Vietnam
9
4.1.2. Ban Cam commune
a. Geographic location
Ban Cam is the commune of the region where people mostly live below the poverty
line. It is about 37 km far toward the North from Bao Thang district, about 15km far from Lao
Cai city following the South West direction. Moreover, there is a 9 km of National Road 70
which runs across the commune.
Ban Cam bordered Muong Khuong district to the North, Phong Hai town of Bao
Thang district to the East and South East, Ban Phiet commune to the West and South West.
Figure 3. Map of Bao Thang district,
Lao Cai Province
Figure 4. Map of Ban Cam commune, Bao
Thang district, Lao Cai Province
b. Topographic
There are high rocky mountains on the North and North East of Ban Cam commune.
The average elevation is about 600 meters above sea level with slope ranges from 20o to 25o.
Therefore, this commune contains various kind of forests such as natural forest, protection
forest, and upstream forest. Ban Cam commune has streams which start from the high
mountain in North and North East, provides portable water for local people.
10
Besides that, the cold and dry in the winter, hot and rainy in the summer in Ban Cam is due to
the tropical monsoon climate type. Especially, Ban Cam experienced many days with the
temperature suddenly dropped into below 10oC, hindering the agricultural activities of local
people. The average precipitation is from 1400 mm to 1600 mm. About 80% of rainfall occurs
from May to August, which results in the fact that it mostly has soil erosion in the summer.
The rainfall in another month is quite low, leading to the lack of water in Nam Tang hamlet
and Ban Cam hamlet.
c. Soil and land use
The area of this commune is totally 4200 ha, including 56.24% agricultural land
(2,740 ha), 6.02% non-agricultural land (252.96 ha) and 28.74% of forest land (1,207 ha)
(Communal People‘s Committee of Ban Cam in 2016) (Table 1 – Appendix)
Forestry land status
According to table 2 (Appendix), the total area of forestry land is 1,979 ha in which:
- 1,333 ha of protection forest including 1,316 ha of natural forest; 17 ha of plantation
forest.
- 647 ha of production forest including 425 ha of natural forest and 221 ha of plantation
forest.
d. Socio-economic conditions
Infrastructure: In recent years, Ban Cam witnesses the development of some
constructions such as electricity, school, clinic, market.
Population: This is a commune of several ethnic minorities groups such as Dao, Giay,
H‘Mong and Nung. Moreover, there is nearly 70% of the total 970 households depend on
agriculture (data collected in 2016), 642 households are allocated forest lands for agricultural
and silvicutural activities.
11
Table 1. Particular socioeconomic characteristics in Ban Cam commune
Total areas
4,200 ha
Population (2016)
3,853
Population growth rate (2016)
1.21%/year
Ethnic minorities
Dao, Giay, H‘Mong, Nung
(Data from Ban Cam Commune People’s Committee)
Agriculture production: the particular production is rice and maize of which cultivated
area is just over 350 ha, with the total production of about 1,500 tonnes (data collected).
Besides that, there is 35 ha of planting Camellia sinensis, 166 ha of fruit trees in this
commune. Moreover, Ban Cam commune has been raising totally 560 buffaloes; 4,904 pigs;
30,611 chickens; 1,444 ducks and 2,773 gooses.
4.2. Forest management status
Today, the natural forest areas are significantly decreased compared with that in the
past. Several species such as Burretiodendron hsienmu (Nghiến), Garcinia fagraeoides (Trai
lý) and Michelia balansae (Giổi) currently have low standing volume.
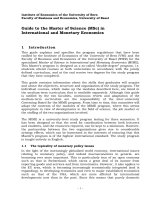
Figure 5. Map of forest management
before 1979
Figure 6. Map of forest management
after 1979 (January 2015)
(Drew by local people)
12
Before 1979, forest, especially primary forest was less disturbed, the canopy cover
was roughly 65%, with the abundance in fauna and flora. Ban Cam, Ban Lot, Nam Tang, Nam
Chu are the hamlet that have the highest stand volume.
The period of 1979 to 1990 witnessed the significant decrease of forest areas in both
qualitative and quantitative aspects. The reason was partly ascribed to the effects of war.
Besides that, local people‘s livelihoods and loose management were the main causes of forest
degradation.
After 1979, the preservation and management program have been inefficient. In
January 2015, the impacts of human to forest were happening gradually, but better than
previous time. Nowadays, it is more stringent in forest protection. Therefore, the area of
artificial regeneration after shifting cultivation is significantly rising, people are yearly
planting trees in the forest in Ban Cam commune.
4.3. Data collection
4.3.1. Questionnaire design
The questionnaire will encompass questions about the basic information about the
households (name, sex, education, the state
of socioeconomic status), acknowledgements
of indigenous people to climate change, the
dependent of them to the forest, land tenure
systems and the ability to participate to
REDD+ program. Both close-ended and
open-ended questions will be included in the
questionnaire.
4.3.2. Questionnaire pretesting
13
A pre-testing questionnaire will be conducted with about 10 households. The pilot test
will eliminate the errors that are associated with survey research and improve the data quality.
4.3.3. Questionnaire revision
The questionnaire will be revised after pretesting by the mentor and Vietnam Forestry
University for approval
4.3.4. Sampling design
Population: Ban Cam commune has 6 hamlets with the population of 970 households
(2016)
Sampling method: In this study, 10% of total 970 households were selected. To more
specific, 100 households would be interviewed including 50 households participate to
REDD+ and 50 households without participating to this program.
Table 2. Survey sampling design in Ban Cam commune
Household wealth ranking
Poor
Count
Column
N%
Moderate
Count
Column
N%
Rich
Count
Column
N%
Total
Count
Column
N%
Participation
No
20
55.6%
12
35.3%
18
60.0%
50
50.0%
in REDD+
Yes
16
44.4%
22
64.7%
12
40.0%
50
50.0%
program
Total
36
100.0%
34
100.0%
30
100.0%
100
100.0%
4.4.
Data analysis methods
SPSS is a sophisticated piece of software used by social scientists and other
professionals for statistical analysis (Coakes and Steed 2009). In this research, IBM®SPSS®
Statistics v.23 software was used for data analysis.
14
Descriptive statistics method
Descriptive statistics are used to describe the basic features of the data in a study.
They provide simple summaries about the sample and the measures. Moreover, from the data,
simple graphics would be analyzed, provide the basis of virtually every quantitative analysis
of data.
In case of this research, the continuous variables were analyzed by comparing means
by the independent-samples T-test. For this test, the subjects were assigned to two groups, so
that any difference in response is due to the treatment (or lack of treatment) and not to other
factors. The grouping variable would be participation people (1 = ―participation‖; 0 = ―non
participation‖). Test variables would be determined as age of household head and number of
labour per household, which is quantitative variable.
Qualitative variables would be analyzed by calculating frequencies, making crosstabulation tables in order to identify the association between indicators (dependent variables)
and drivers (independent variables). Table 3 indicates the full list of independent variables:
15
Table 3. List of independent variables
No.
Variable
States
Description
1
Ethnicity
Ethnicity of households
1 = ―Giay and Dao‖;
0= ―Others‖ (Including
Nung,
Kinh,
Han,
H‘Mong)
2
Age
Age of household head
1 = ―25-30 years old‖;
2 = ―35 – 50 years old‖;
3 = ―>50 years old‖
3
Number of labour Number of labour in a household
per household
4
Household
ranking
5
Household forest Forest land area of each household
land area
6
Concerned about
forest degradation
7
Education level of The education level of household 0 = ―Illiterary‖;
household head
head
1 = ―Primary school‖;
2 = ―Secondary school‖;
3 = ―High school‖;
4 = ―College‖
8
Occupation
of The occupation that gave to local 1 = ―Agriculture‖;
household head
people the main income.
2 = ―Bussiness‖;
3= ―Others‖
9
Rationality of
government
payment
The rationality of payment from the 0 = ―No‖;
government
1 = ―Yes‖
10
Understanding
about REDD+
policy
The understanding of local people 0 = ―No‖;
about REDD+ policy. Some people 1 = ―Yes‖
who
concern
about
forest
degradation but they may not have
any idea about REDD+ and its
policy.
The wealth
household
ranking
of
each 0 = ―Poor‖;
1 = ―Moderate‖;
2 = ―Rich‖.
0 = ―0.5 – 2 ha‖;
1 = ―>2 ha‖
The concern of local about forest 0 = ―No‖;
degradation
1 = ―Yes‖
Bivariate correlation
The bivariate correlation procedure computes the Pearson‘s correlation coefficient for
quantitative variables. According to IBM® SPSS® v.23, ―Pearson's correlation coefficient is a
16
measure of linear association. Two variables can be perfectly related, but if the relationship is
not linear, Pearson's correlation coefficient is not an appropriate statistic for measuring their
association‖. It can range from -1 to 1, in which of -1 indicates a perfect negative linear
relationship between variables, the Pearson‘s value (denoted as r) of 0 indicates no linear
relationship between variables, and an r of 1 shows a perfect positive linear relationship
between variables.
In the study, Pearson‘s correlation was used to finding the relationship between
dependent variable with each of the independent variables. The dependent variable has
correlation with independent variable as |x| > 0.3 (x is the Pearson Correlation values). The
compatible variables were used for the next steps.
Binary logistic regression
In statistics, logistic regression, or logit regression is a regression model where the
dependent variable is categorical. In case of studying about the participated in REDD+
program, the binary logistic regression procedure were applied to determine the key factors
that influence to REDD+ program which were most likely to give the positively respond.
These drivers would be statistically significant if the indicators had the p<0.05 at 95%
confidence level.
Binary logistic regression procedure which contains two variables. Dependent
variables have to have two value (0 = ―No‖; 1 = ―Yes‖), whereas the independent variables
can be contained more than two values.
To determine the factors, the brief model in which the variables were tested by
Pearson correlation would be used. The results in which significant values were less than 0.05
(5%) were chose as the factors which influenced to the involvement of local people to
REDD+ in a 95% confidence level.
17
Binary logistic equation function is:
Where:
: Probability of the household decides to participate in REDD+
program;
: Probability of the household decides not to participate in REDD+
program;
Xi: The independent variables.
Table 4. Dependent variable and independent variables
Dependent variable
The participation of
local people to
REDD+ program
Independent variables
Quantitative variable
Qualitative variable
3. Household wealth ranking
4. Household forest land area
5. Ethnicity
6. Concerned about forest
degradation
1. Age of household head
7. Education level of household
2. Number of labour per
head
household
8. Occupation of household head
9. Rationality of government
payment
10. Understanding about REDD+
policy
18