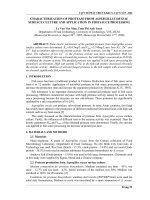
Evaluating effects of acacia plantation forest on surface runoff and erosion in luong son headwater of vietnam
Bạn đang xem bản rút gọn của tài liệu. Xem và tải ngay bản đầy đủ của tài liệu tại đây (4.35 MB, 62 trang )
MINISTRY OF AGRICULTURE AND RURAL DEVELOPMENT
VIETNAM NATIONAL UNIVERSITY OF FORESTRY
FINAL THESIS
EVALUATING EFFECTS OF ACACIA PLANTATION FOREST
ON SURFACE RUNOFF AND EROSION IN LUONG SON HEADWATER
OF VIETNAM
Major: Natural Resources Management
Faculty: Forest Resource and Environmental Management
Student: Pham Quynh Trang
Student ID: 1453092269
Class: K59 - Natural Resources Management
Course: 2014 – 2018
Advanced Education Program
Developed in collaboration with Colorado State University, USA
Supervisor: Adjunct Associate Professor Dr. Bui Xuan Dung
Hanoi, 2018
i
ACKNOWLEDGEMENT
First and foremost, to be able to conduct this research, I would like to express my sincere
respect to my supervisor - Assoc. Prof. Dr. Bui Xuan Dung for his enthusiastic and patient
support with invaluable comments. In addition, I appreciated the support of other lectures
during the time I analyzed the data.
Not only that, many thanks are due to my friends when I started to collect and analyze
data. They always give me the support whenever I needed. In terms of difficulties, the transport
to study sites was hard without my companions.
Lastly, I express my gratitude to local people who own the Acacia plantation model for
allowing us to conduct this research in this site. They also informed me about the weather which
extremely support me to get the data.
Hanoi, October 2018
ii
TABLE OF CONTENTS
ACKNOWLEDGEMENT .......................................................................................................ii
TABLE OF CONTENTS ....................................................................................................... iii
LIST OF FIGURES .................................................................................................................. v
LIST OF TABLES ..................................................................................................................vii
ABSTRACT .......................................................................................................................... viii
CHAPTER I: INTRODUCTION ............................................................................................ 1
CHAPTER II: GOAL AND OBJECTIVES .......................................................................... 4
2.1. Goal .................................................................................................................................. 4
2.2. Objectives ........................................................................................................................ 4
CHAPTER III: STUDY SITE AND METHODS .................................................................. 5
3.1. Study site .......................................................................................................................... 5
3.2. Methods ........................................................................................................................... 6
3.2.1. Installing monitoring plot .......................................................................................... 6
3.2.2. Rainfall and soil physical characteristics .................................................................. 8
3.2.3. Runoff and soil erosion measurement ..................................................................... 11
3.2.4. Vegetation observation ............................................................................................ 12
3.2.5. Topographic survey ................................................................................................. 12
3.2.6. Data analysis ........................................................................................................... 13
CHAPTER IV: RESULTS ..................................................................................................... 14
4.1. Soil physical factors, vegetation and precipitation characteristics on study sites. ........ 14
iii
4.1.1. Soil physical factors and vegetation on study sites. ................................................ 14
4.1.2. Precipitation characteristics..................................................................................... 15
4.2. Runoff generation characteristics on study site. ............................................................ 18
4.3. Soil erosion on study site. .............................................................................................. 24
CHAPTER V: DISCUSSION ................................................................................................ 29
5.1. Surface runoff at bareland and different ages of Acacia................................................ 29
5.2. Soil erosion at bareland and different ages of Acacia .................................................. 34
CHAPTER VI: CONCLUSION ............................................................................................ 41
CHAPTER VII: RECOMMENDATION ............................................................................. 41
REFERENCES ....................................................................................................................... 44
APENDIX ............................................................................................................................... 49
iv
LIST OF FIGURES
Figure 3.1. The map of study site ............................................................................................... 6
Figure 3.2. Location of five plots ............................................................................................... 7
Figure 3.3. The model of plot and experiment conducted .......................................................... 8
Figure 3.4. Rain gauge ................................................................................................................ 8
Figure 3.5. Measured poroxity ................................................................................................. 10
Figure 3.6. Determined amount of runoff ................................................................................ 11
Figure 3.7. Took eroded soil and dried and in the Lab ............................................................. 11
Figure 3.8. GLAMA and Canopy Cover Free application ....................................................... 12
Figure 3.9. GPS and Compass application ............................................................................... 12
Figure 3.10. Create box-plot by R-studio ................................................................................. 13
Figure 3.11. Box-plot graph ..................................................................................................... 13
Figure 4.1. Storm events ........................................................................................................... 15
Figure 4.2. Precipitation, surface runoff and runoff coefficient at different ages of Acacia .... 18
Figure 4.3. Precipitation accumulation and runoff accumulation at different age of Acacia ... 20
Figure 4.4. Comparison of the runoff generation to forest cover change by bare land and four
different Acacia tree-aged ........................................................................................................ 21
Figure 4.5. Correlation between precipitation and surface runoff at different age of Acacia .. 22
Figure 4.6. Precipitation and soil eroded at different ages of Acacia ....................................... 24
v
Figure 4.7. Precipitation and soil erosion accumulation at different ages of Acacia ............... 25
Figure 4.8. A comparison of soil erosion to forest cover change by bare land and four different
Acacia tree-aged ....................................................................................................................... 26
Figure 4.9. Correlation between soil erosion and precipitation, surface runoff ....................... 27
Figure 4.10. Annual soil erosion at different ages of Acacia ................................................... 28
Figure 5.1. Runoff coefficient of species on other study ......................................................... 30
Figure 5.2. The soil erosion annually at different Acacia ages ................................................ 34
Figure 5.3. Annual soil erosion of vegetation types on other studies ....................................... 36
Figure 6.1. Effect of Acacia plantation in different ages ......................................................... 42
vi
LIST OF TABLES
Table 4.1. Outline of five plots of different vegetation cover types. ........................................ 14
Table 4.2. Precipitation, API7 and rainfall intensity on study sites ......................................... 16
Table 4.3. Vegetation on study site. ......................................................................................... 17
Table 4.4. Surface runoff, runoff coefficient analysis between five plots................................ 19
Table 4.5. Independent samples t-test for the effect of surface runoff to Acacia’s age ........... 22
Table 4.6. Soil erosion analysis between five plots. ................................................................. 25
Table 4.7. Independent samples t-test for the effect of soil erosion to Acacia ages................. 26
Table 5.1. TCVN 5299: 2009 - Method for determination of soil erosion by rainfall ............. 36
Table 5.2. The soil erosion annually on other studies .............................................................. 37
vii
ABSTRACT
To assess soil losses and overland flow in Acacia plantations of different ages and
evaluating erosion risk to surface cover by investigating the characteristics of surface runoff
generation and soil erosion derived from bare land and Acacia Plantation forest model in Luong
Son headwater of Vietnam. Five plots (10 m2/plot) at different vegetation cover conditions (bare
land, 4-month-old Acacia trees, 1-year-old Acacia trees, 2-year-old Acacia trees and 4-year-old
Acacia trees) was set up and monitored over 75 storm events from September 2017 to August
2018 in Truong Son Commune, Luong Son district, Hoa Binh Province. The main findings
included: (1) Runoff coefficient was the highest at bare land (7.87%) and the lowest 4-year-old
Acacia trees (0.40%); (2). The highest amount of soil loss accumulation during the observed
time was induced from bare land plot (103.75 kg), the intermediate from 4-month-old Acacia
(27.52 kg). 1-year-old Acacia (12.61 kg), 2-year-old Acacia (11.99 kg), and the lowest at 4year-old Acacia (14.19 kg); (3) Both the amount of runoff and soil erosion has a strong
relationship with vegetation cover and precipitation (p<0.00).
Key words: Acacia plantation model, bare land, field study, headwater, runoff
generation, soil erosion, vegetation cover conditions.
viii
CHAPTER I
INTRODUCTION
Erosion is the phenomenon of surface erosion under erosive forces of water or wind
(Ellison, 1944). Soil erosion is known as a natural phenomenon, but this phenomenon is
happening more and more seriously. Surface runoff is the flow occur when rainfall is greater
than infiltration. Soil erosion and surface runoff has long been recognized as a major cause of
soil degradation and flooding in mountainous areas (Montgomery, D., 2007). Not only directly
affecting the forestry production activities, the impacts of erosion also affect the ecological
environment and people's life in downstream areas, especially the soil is degraded rapidly.
There is far more powerful than soil formation in the natural course, and some centimeters of
soil can be lost in just a few rains, thunderstorms or whirlwinds. Some centimeters of soil must
have a period of hundreds of years, even thousands of years to restore (Dao Chau Thu, 2006).
Most countries in the world suffer from the effects of soil erosion. According to the
results announced by Eswaran et al (2001), the manufacturing capabilities of some areas in the
world will be reduced to 50% because of erosion and desertification. In South Asia, cereal
production fell by about 36 million tons per year due to water erosion equivalent to $5.4 billion;
At global level, the surface of the earth loses 75 billion tons of land annually, equivalent to the
economic value of 400 dollars billion. In per capita, every citizen on Earth loses approximately
70 USD/year. (Eswaran et al., 2001). In Vietnam, having 80,000 tons of soil erosion, damaging
15 billion VND each year (Phuong et al, 2012), especially Hoa Binh is one of the provinces of
Vietnam most affected by erosion due to the geological structure had several fault systems and
structural elements such as anticlines, synclines, grabens, accumulated address exists in the
territorial demarcation. Hoa Binh is a mountainous province in the Northwest of Vietnam. In
Hoa Binh province, according to the investigation, at 2012, the topsoil is eroded due to the
precipitation loss of over 34.5 million tons of soil per year, in which the hills and mountains
1
are eroded over 1 million tons per year, less than 90,000 tons/ha per year under 900 meters,
over 84,000 tons/ha/year. (Viet Lam, 2012).
Soil erosion is determined by various factors such as rainfall, rainfall intensity, soil
properties, topography and vegetation (Vo Dai Hai, 1996, Nguyen Van Dung and Tran Duc
Vien, 2005). Among the above factors, vegetation is considered an important contributing
factor in soil protection, reducing surface runoff and erosion (Pham Van Dien, 1998; Vo Dai
Hai, 1996; Castillo et al., 1997, Canton et al., 2001, Vo Dai Hai, 2006; Miyata et al., 2009). For
decades, authors at home and abroad have done many researches about vegetation cover related
to soil erosion (Nguyen Trong Ha, 1996, Nguyen Quang My, 2005, Hudson, 1981, Zakharov,
1981). There are many studies which found that plants can trap runoff then reduces the amount
of soil eroded (ex. Etafa Emama and Morgan, 1995; Morgan, 2007). In general, natural forest
land has ability to penetrate and retain water well due to its high-water consumption, strong
roots rooted deep into the soil, while natural forest also had a thick mat of thick soils, from
which soil erosion was significantly reduced (Bonell, 1998; Descorix et al., 2001). The
coefficient of surface runoff where no tree is 0.230% and where having tree is 0.028%. The
amount of sediment also varies from where having trees and without trees, sediment where no
tree is 133 g/m2 and where having tree is 1.1 g/m2 (Descroix et al., 2001). The previous studies
also showed that in species of different plants, the ability to regulate water and to reduce erosion
is different (Vo Dai Hai, 1996, Chao Thi Yen, 2014; Bui Xuan Dung, 2016). For a long time,
plants have been an effective way to combat erosion as well as being widely disseminated as a
means of soil conservation (Morgan, 1986).
Acacia mangium Willd., also known as mangium, is a species of plants indigenous to
Northern Queensland (Australia), found in Indonesia's Irian Jaya, Maluku (Doran and Skelton,
1982). This is a fast-growing species which widely used for various purposes such as timber,
firewood, agroforestry, land improvement (Turnbull et.al, 1983). From the economic and social
benefits of Acacia, Acacia plantations are expected to increase annually (Ministry of
2
Agriculture and Rural Development, 2012). However, the lack of a database reflects the
relationship between Acacia plantations and the formation of surface runoff and erosion in
Vietnam, leading to difficulties and challenges in the development of plantation forest models
to achieve the best environmental performance. In Vietnam, about 24% of the forest area is
planted forest, of which Acacia mangium is a popular crop, bringing high economic value
(Ministry of Agriculture and Rural Development, 2012). Acacia mangium is one of the grown
plants in Luong Son, Hoa Binh. According to decision on approving and publishing forest
inventory results of Hoa Binh province 2016 (People's Committee of Hoa Binh province, 2016),
92% of forest type in this province is Acacia forest. Acacia grows well at slope from 15o – 25o,
with elevation bellow 400 m and soil depth greater than 50 cm. This type of forest is mainly
planted in headwater. Prior to severe erosion headwater situation, the Department of Science
and Technology and the Center for Environment - Territories (CEGTeP) have proposed
measures to promote the greening of barren land and hills. In total 150 ha of forest trees in
Truong Son communes, Luong Son district, Hoa Binh province, there are 136 ha of Acacia
forest with different ages (Bui Duc Thuan, 2018). However, with the 7-year life cycle of Acacia,
before starting new cycle, people have to clear cutting and burning to make ground preparation
and reforestation. Does soil protection at Acacia different ages differ? Though there have been
numerous studies on the ability to protect soil of Acacia mangium, but still a lot of information
has not been clearly elucidated. Namely, the effect of degrading surface flow as well as effective
against soil erosion through the development stages of Acacia mangium. To further clarify this
issue, I have conducted a study on: “EVALUATING EFFECTS OF ACACIA
PLANTATION FOREST ON SURFACE RUNOFF AND EROSION IN LUONG SON
HEADWATER OF VIETNAM”. From there, step by step quantify these relationships to
develop Acacia plantation models, not only for the research area but also to expand into areas
similarities, and to provide the basis for science and technology. Aim for further research to
develop solutions to regulate water and protect soil resources.
3
CHAPTER II
GOAL AND OBJECTIVES
2.1. Goal
Finding solutions to design model of acacia plantations at different ages, aim to mitigate
as well as prevent the effects of surface runoff on soil erosion.
2.2. Objectives
➢ Hypothesis
The vegetation cover plays an extremely significant role in protecting soil and reducing
surface runoff. Amount of surface runoff and soil erosion in Acacia mangium plantation forest
is much lower than bare land.
The specific objectives of this research are:
To determine some soil physical factors and vegetation characteristics of the study site
in Luong Son, Hoa Binh.
To evaluate amount of surface runoff in Acacia mangium plantation and bare land.
To evaluate soil erosion characteristics in Acacia mangium plantation and bare land.
4
CHAPTER III
STUDY SITE AND METHODS
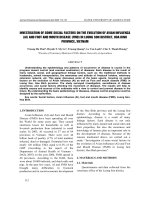
3.1. Study site
The study was conducted in Chanh village - Truong Son commune, Luong Son district,
Hoa Binh province. Truong Son commune covers an area of 30.64 km², with a population of
1871 people in 1999 and a population density of 61 persons/km². (Figure 3.1)
About topography, Luong Son district in the midland - where the transition between the
delta and mountainous, so the terrain is very diverse. The low mountainous terrain is
approximately 200-400 m in height, formed by magma, limestone and terrigenous sediments,
with a dense network of rivers and streams. (Figure 3.2)
Luong Son climate is tropical monsoon, with cold winters - less rainfall; hot summer heavy rain. The average temperature of the year is 22.9 - 23.30°C. The average rainfall is from
1520.7 to 2255.6 mm/year, but unevenly distributed during the year and even during the season
is very erratic. The average precipitation is 276 – 322 mm/month. Each year, there are at least
2 typhoons that affect the area, the wind velocity is about 30 m/s. The rainfall is unevenly
distributed, mainly occurs on in some months during the rainy season, it can generate huge
amount of runoff, causing flood and seriously landslide and erosion. (Linh, 2017)
5
Figure 3.1. The map of study site: a) Location of Hoa Binh province on Viet Nam map; b)
Location of Luong Son district on Hoa Binh map; c) Location of Truong Son commune on
Luong Son map
3.2. Methods
3.2.1. Installing monitoring plot
I took five plot samples with bare land and four ones of different ages of Acacia tree.
The first plot was for bare land, the second for 4-month-old Acacia trees, the third for 1-yearold Acacia trees, the fourth for 2-year-old Acacia trees and the last for 4-year-old Acacia trees.
Standard plots were protected and had clear boundaries. The area of each plot is 10 m2 (2.5m x
4m), with monitoring time from September 2017 to August 2018. The data in 2017 of four plots
was from Scientific Research of me and my associates. I kept continue to collect, established
plot 5 and combine data from April 2018 to August 2018.
6
b
)
a
)
c)
a)
d)
f)
e)
Figure 3.2. Location of five plots: a) Contour line map of location;
b) Bare land plot; c) 4-month-old Acacia trees plot; d) 1-year-old Acacia trees plot;
e) 2-year-old Acacia trees plot; f) 4-year-old Acacia trees plot
The border of plot was built by aluminum plates. There was buried at least 10 cm deep
to ensure that it can withstand heavy winds and heavy rains. Aluminum plates was 30 cm high
to prevent rain splash, held and reinforced to stand upright by steel wires and bamboo piles.
7
The plots were perpendicular to the contour line. At the down slope end of each plot, an
aluminum trough was inserted connecting to a plastic pipe to transport overland flow and
sediment to the buckets used to hold water and soil after each storm. Nylon was used to cover
the trough in order to prevent rain splash and rainfall from outside. After finished establishing
plot, the rain gauge was set beside these plots to measure the precipitation. The rain gauges
were set far from the tree canopy to avoid interception from overlying canopy.
Plastic fence to prevent water
from inserting to troughs
Fences to prevent soil
from inserting to plot
Pipe: lead water and soil into the bucket
Troughs to catch water and soil
Bucket to hold water and soil
Figure 3.3. The model of plot and experiment conducted
3.2.2. Rainfall and soil physical characteristics:
a. Precipitation:
America plastic rain gauge was used to measure the total rainfall
(mm). Precipitation was recorded each rainfall event in amount of water
coming to the rain gauge from the start to the end of the storm.
The number of the storm was 75, an inter-storm period was
defined as a period of at least 6 hours without rain (Yen, 2014). Because
the amount of overland flow felt down rapidly after precipitation
8
Figure 3.4. Rain gauge
ceased, a 6-hr period without precipitation was sufficient to distinguish storm events (Dzung et
al, 2011).
➢ Soil moisture measured using Antecedent Precipitation Index for 7 days (API7)
𝐴𝑃𝐼(𝑖) = ∑
10 − (ⅈ − 𝑗)
× 𝑃𝑗
10
API (i): Precipitation index of the i dates
i: daily number of days to calculate precipitation index (before) (API) (I € 1-n)
i, j must satisfy condition 0 ≤ i - j ≤ 10
n: number of days in whole observation period
Pj: The corresponding rainfall of rainy-day j. If there is much rain on the jth day, it will be equal
to the total number of rains on that day. Any Pj that satisfies the condition 0 ≤ i - j ≤ 10 will be
accrued into the API of the i the date in accordance with the above equation. Outside this area,
the rainy day will not affect the API of the ith day.
b. Soil properties
•
i)
Dry Bulk Density Tube was used to collect soil in order to determine bulk density.
Dry Bulk density (D) is the weight of a unit volume of a loose material (such as a powder
or soil) to the same volume of water (g/cm3). Calculated by using the formula:
D=
𝑀
𝑉
In which:
D: Dry Bulk density (g/cm3)
M: Weight of dry land in its natural state (g)
V: The volume (cm3)
9
ii)
Porosity of the soil is the ratio of the pores in the soil compared to the volume of soil.
The porosity of the soil is determined by the particle density and the Dry Bulk density of the
soil. Porosity is calculated by using the formula:
X% =
1−𝐷
𝑑
* 100
In which:
d: is the particle density (g/cm3)
D: is the bulk density (g/cm3)
Because I only knew bulk density, so I could assume particle density is equal to 2.56
g/cm3 (Liesch, 2013)
Soil moisture content (%): Determination of soil moisture following steps
Step 1: Weigh the aluminum box, (W1) (g)
Step 2: Weigh soil and aluminum box, I got W2 (g)
Step 3: After 24 hours drying in an oven at a temperature of 105⁰C, weight soil and aluminum
and I got W3 (g). Calculated according to the following formula:
W% =
𝑊2−𝑊3
𝑊2−𝑊1
* 100
Soil depth was measured by measuring tape, I excavated the soil profile (surface cut straight
from the ground down to the bare rock layer.) then used the tap to have the depth of soil.
Figure 3.5. Measured poroxity
10
3.2.3. Runoff and Soil erosion measurement
a. Surface runoff
Water from buckets was collected after each storm then graduated cylinder was used to
directly measure amount of runoff from each plot.
Surface runoff coefficient =
Total amount of surface runoff
* 100%
Total precipitation
Figure 3.6. Determined amount of runoff
b. Sediment measurement
Sediment also came with surface runoff to the buckets,
so after each storm, when soil settled down to the bottom
of the bucket then the water was taken to cylinder to
measured, the soil was left in the bucket would be collected
then bring to the laboratory as well as the soil from troughs
and pipes in each plot. The soil then was dried in laboratory
Figure 3.7: Took eroded soil and dried and in the Lab
11
and weighted to determine the amount of soil erosion.
3.2.4. Vegetation observation
Canopy and vegetation cover were
determined by using GLAMA and Canopy
Cover Free application. The picture was taken
from the canopy and the vegetation cover
(standing in the central of each plot) and
inserted to the program to process then
recorded the results.
Figure 3.8. GLAMA and Canopy Cover Free
The diameter of trees was determined by caliper and height of the trees was measured
application
by blume-leiss.
3.2.5. Topographic survey: Slope, coordinate system and altitude of five plots are
measured by using GPS and compass application.
Figure 3.9. GPS and Compass application
12
3.2.6. Data analysis
- Data was processed by using Microsoft Excel, SPSS and R-Studio: t-test, Regression,
Descriptive, Chart Builder. Using Photoshop CS6 to draw some graphics.
library(readxl)
> SR2
> prec = c(SR2$Precipitation)
> boxplot(prec)
> library("ggplot2",
lib.loc="~/R/win-library/3.4"
Using code to import data
and make box-plot
Figure 3.10. Create box-plot by R-studio
The box-plot is a standardized way of displaying the distribution of data. (Roald
Hoffmann, 1981). A box-plot is the 5visual representation of the statistical five number
summary of a given data set. A five-number summary includes:
•
Median
•
2 hinges = Lower Quartile – Q1 (25%) and Upper Quartile – Q3 (75%)
•
Fences = 1.5 x Interquartile range (IQR) (Benjamini, Y., 1988)
•
Whiskers
•
Outliers: unusual observations, extremely out of the population (Faraway, 2014)
Outliers
Upper Extreme = Q3 + 1,5 x IQR
Whiskers
Q1 (25%)
IQR = Q3 – Q1
Median
Q1 (75%)
Lower Extreme = Q1 + 1,5 x IQR
Figure 3.11. Box-plot graph
13
CHAPTER IV: RESULTS
4.1. Soil physical factors, vegetation and precipitation characteristics on study sites.
4.1.1. Soil physical factors and vegetation on study sites.
The area of each plot was 10 m2 (4 m long and 2.5 m wide). Five plots had approximately
the same height: plot 1 with bare land had the elevation of 63 m; plot 2 with 4-month-old Acacia
trees was at 65 m; plot 3 with 1-year-old Acacia trees was at 64 m, plot 4 with 2-year-old Acacia
trees was at 65 m and plot 5 with 4-year-old Acacia tress was at 67 m above sea level. The soil
depth of five plots was 0.68 m, 0.85 m, 1.02 m, 1 m and 1.15 m, respectively. The slope of 5
plots was 22o; 23o; 23o, 24o, and 26o, respectively. The ground vegetation cover of five plots
also had different percentage, which of plot 1, plot 2, plot 3, plot 4, and plot 5 was 0.5%, 69.2%,
45.9%, 36.5%, and 30.5% respectively. The porosity of soil at five plots was 25%, 38%, 39%,
40% and 38% respectively. (Table 4.1)
Table 4.1. Outline of five plots of different vegetation cover types.
Parameters
Vegetation cover type
Soil depth (m)
Altitude (m)
Gradient (oC)
Understory (%)
Litter fall (%)
Density (stem/10 m2)
Porosity (%)
Plot 1
Bare
land
0.68
63
22
0.5
0
0
25
Plot 2
Plot 3
Plot 4
Plot 5
4-month- 1-year- 2-year-old 4-year-old
old trees old trees
trees
trees
0.85
1.02
1
1.15
65
64
65
67
23
23
24
26
69.2
45.9
36.5
30.5
3.5
8.5
9.5
11
4
4
3
4
38
39
40
38
14
4.1.2. Precipitation characteristics
The total observed data was 75 storm events. Based on study site's data, the amount of
rainfall ranged from 0.5 mm to 197 mm.
200
160
140
120
100
80
60
33.71 mm
40
20
0
29/09/2017
03/10/2017
05/10/2017
08/10/2017
12/10/2017
19/10/2017
29/10/2017
08/11/2017
12/11/2017
19/11/2017
24/11/2017
06/04/2018
16/04/2018
25/04/2018
28/04/2018
02/05/2018
08/05/2018
13/05/2018
18/05/2018
21/05/2018
27/05/2018
29/05/2018
01/06/2018
05/06/2018
09/06/2018
11/06/2018
17/06/2018
20/06/2018
09/07/2018
11/07/2018
16/07/2018
19/07/2018
21/07/2018
23/07/2018
29/07/2018
13/08/2018
22/08/2018
28/08/2018
Precipitation (mm)
180
Storm events
Figure 4.1. Storm events
Luong Son, Hoa Binh belongs to the third sub-zone of the North Vietnam which has two
seasons: rainy season and dry season. Monitoring time occurred in the both dry (September
2017 to November 2017) and rainy season (April 2018 to August 2018), it could be seen that
rainfall in the dry season was relatively small, while the opposite was witnessed by the rainy
season. During 2017 to August 2018, there was a fluctuation in the amount of precipitation.
The lowest rainfall was 0.5 mm on 29/10/2017, the highest storm was 197 mm on 19/07/2018.
Over a period, the average precipitation was 33.71 mm.
15
Table 4.2. Precipitation, API7 and rainfall intensity on study sites
No.
Date
1
2
3
4
5
6
7
8
9
10
11
12
13
14
15
16
17
18
19
20
21
22
23
24
25
26
27
28
29
30
31
32
33
34
35
36
37
38
39
40
41
42
29/9/2017
30/9/2017
3/10/2017
4/10/2017
5/10/2017
7/10/2017
8/10/2017
9/10/2017
12/10/2017
17/10/2017
19/10/2017
25/10/2017
29/10/2017
6/11/2017
8/11/2017
9/11/2017
12/11/2017
15/11/2017
19/11/2017
20/11/2017
24/11/2017
05/04/2018
06/04/2018
15/04/2018
16/04/2018
22/04/2018
25/04/2018
27/04/2018
28/04/2018
30/04/2018
02/05/2018
05/05/2018
08/05/2018
11/05/2018
13/05/2018
16/05/2018
18/05/2018
19/05/2018
21/05/2018
26/05/2018
27/05/2018
28/05/2018
Precipitation
(mm)
18.5
11
29.5
9.5
13.5
33
13.5
0.75
182
3.5
5.5
7
0.5
1
3
2.5
9
3
14.5
7
4.5
0.9
10.2
12.5
16.5
33
49.2
27
2.1
36
31.5
28.5
29.5
55
9.4
11
42
6
41.5
34.2
85
5
API7(mm)
3.79
20.25
8.99
36.53
30.03
18.86
45.78
40.19
12.15
36.4
27.75
0.92
1.75
0
0.5
3.33
1.75
3.85
2.04
15.1
14.75
1.60
1.59
0.00
12.50
7.29
11.00
31.20
54.40
19.89
30.95
18.00
20.00
19.33
33.40
14.13
15.24
48.80
19.20
9.16
48.03
108.03
16
Rainfall intensity
(mm/hr)
5.29
3.67
9.83
3.8
6.14
10.31
3.38
1.5
20.22
2.33
1.83
2.33
1
2
1.2
2.5
4.09
1.5
4.53
2.8
2.25
0.36
8.16
6.25
11.00
10.15
10.19
6.00
0.49
10.29
9.94
11.40
9.08
11.78
7.52
7.33
13.25
2.40
13.47
9.32
13.43
2.38
43
44
45
46
47
48
49
50
51
52
53
54
55
56
57
58
59
60
61
62
63
64
65
66
67
68
69
70
71
72
73
74
75
29/05/2018
30/05/2018
01/06/2018
02/06/2018
05/06/2018
06/06/2018
09/06/2018
10/06/2018
11/06/2018
12/06/2018
17/06/2018
18/06/2018
20/06/2018
27/06/2018
09/07/2018
10/07/2018
11/07/2018
14/07/2018
16/07/2018
18/07/2018
19/07/2018
20/07/2018
21/07/2018
22/07/2018
23/07/2018
24/07/2018
29/07/2018
31/07/2018
13/08/2018
18/08/2018
22/08/2018
24/08/2018
28/08/2018
20
15.9
15
69
53
6
13.8
6.2
8.4
4.3
20
125
2
45.8
9.3
28
58.6
62.7
109
34
197
18.9
126.2
42
33
25
85
42.5
35
110
37
28.5
104
15.04
9.52
6.91
12.95
14.44
4.51
11.04
4.66
3.82
3.58
7.49
22.32
0.32
21.81
3.10
8.00
7.81
14.25
12.11
6.18
23.88
6.30
15.78
7.20
10.68
8.06
13.78
6.07
8.75
12.94
16.44
11.40
13.56
58.90
39.76
52.22
62.17
32.79
78.55
25.11
25.90
31.97
25.67
4.55
22.63
69.17
0.29
0.00
9.30
32.65
28.39
44.43
133.05
101.04
271.23
164.94
231.62
203.78
167.10
22.00
46.07
0.00
7.00
27.50
55.17
19.46
Table 4.3. Vegetation on study site.
Parameters
Plot 1
Plot 2
Plot 3
Plot 4
Plot 5
DBH (cm) average
0
1
2.2
3.6
8.5
Height (m) average
0
0.6
3.2
4
6.2
Crown length (m)
0
0
1.5
1.8
2.1
Crown dimeter (m)
0
0
0.65
0.8
0.95
*
**
(*): Average diameter breast height of trees; (**): Average height of trees.
17