Estimation of carbon stocks of coastal mangroves using sentinel 2a in tien lang district hai phong city vietnam
Bạn đang xem bản rút gọn của tài liệu. Xem và tải ngay bản đầy đủ của tài liệu tại đây (1.1 MB, 103 trang )
MINISTRY OF AGRICULTURE AND RURAL DEVELOPMENT
VIETNAM NATIONAL UNIVERSITY OF FORESTRY
STUDENT THESIS
ESTIMATION OF CARBON STOCKS OF COASTAL MANGROVES
USING SENTINEL 2A IN TIEN LANG DISTRICT, HAI PHONG CITY,
VIETNAM.
Major: Natural Resources Management
Code: D850101
Faculty: Forest Resources and Environmental Management
Students: Duong Vo Khanh Linh
Student ID: 1453092260
Class: 59A Natural Resources Management
Course: 2014-2018
Advanced Education Program
Developed in collaboration with Colorado State University, USA
Supervisor: Assoc. Prof. Dr. Hai-Hoa Nguyen
Hanoi, 2018
PUBLICATION
Hai-Hoa, N., Khanh Linh, D.V., An, L.T., Ngoc Lan, T.T., Huu Nghia, N
(2018). Estimation of carbon stocks of coastal mangroves using Sentinel 2A in
Tien Lang district, Hai Phong city, Vietnam. Journal of
Information Science (Submited and accepted to be reviewed).
Geo-spatial
ACKNOWLEDGEMENT
This research is funded by Vietnam National Foundation for Science
and Technology Development (NAFOSTED) under grant number 105.082017.05.
With the consent of Vietnam Forestry University, Ministry of
Agriculture and Rural Development faculty, I conducted the study: “Carbon
storage estimation of mangrove forest using Sentinel 2A in Tien Lang district,
Hai Phong, Vietnam”.
With this study, I am extremely grateful for the guidance, advice and
the support of many people. First, i would like to thank most sincerely and
deeply to my mentor – Associcate Prof. Dr. Hai-Hoa Nguyen, who gave
helpful advices and strong supports during the implementation and completion
of this study.
Also, I would like to thanks for the encouraging words, and suggestions
of the teachers of the Forest Resources and Environment Management
Faculty, Vietnam Forestry University that helped me complete the study with
the best quality.
The study could not be finished and achieved result without the
enthusiastic help, friendliness, and hospitality of the local government and
residents of two communes Vinh Quang and Dong Hung of Tien Lang
district, i would like give a big thanks and extreme appreciation to them.
I also would like to thanks to our friends and family who always
supported and encouraged me to perform and complete the study.
Because of the limited study duration as well as lacking awareness and
knowledge I am looking forward to receiving the comments, evaluation and
feedback of teachers and friends to raise the quality of study and improve not
only the professional knowledge but also the lacking skills of us in this study.
I sincerely thank you!
TABLE OF CONTENTS
PUBLICATION
ACKNOWLEDGEMENT
ABBREVIATIONS ............................................................................................ i
LIST OF TABLES ............................................................................................ ii
LIST OF FIGURES .......................................................................................... iii
ABSTRACT ...................................................................................................... 1
CHAPTER I INTRODUCTION ....................................................................... 2
CHAPTER II LITERATURE REVIEW ........................................................... 5
2.1. GIS and Sentinel satellite image ..................................................... 5
2.1.1. The concept of GIS, remote sensing ............................................. 5
2.1.2. Sentinel 2A satellite image ........................................................... 6
2.2. Remote sensing application in carbon estimation and forest
biomass .............................................................................................................. 8
2.2.1. In the world ................................................................................... 8
2.2.2. In Vietnam................................................................................... 12
CHAPTER III STUDY GOAL, OBJECTIVES AND METHODOLOGY ... 16
3.1. Study goal and objectives .............................................................. 16
3.1.1. Overal goal .................................................................................. 16
3.1.2. Specific objectives ...................................................................... 16
3.1.3. Scope ........................................................................................... 16
3.2. Methodology .................................................................................. 17
3.2.1. Secondary data collection ........................................................... 18
3.2.2. Field survey method .................................................................... 19
3.2.3. Samplings .................................................................................... 19
3.2.4. Calculating biomass and carbon stocks: ..................................... 22
3.2.5. Calculating Soil organic carbon by Walkley – Black method: .. 23
3.2.6. Construct the classified map and interpolation map of biomass
and carbon stocks ............................................................................................ 24
3.2.7. Accuracy assessments: ................................................................ 26
CHAPTER IV NATURAL AND SOCIO-ECONOMIC FEATURES .......... 28
4.1. Natural conditions and basic characteristics of mangrove forest .. 28
4.2. Social and economic conditions..................................................... 29
CHAPTER V RESULTS AND DISCUSSIONS ............................................ 30
5.1. Mangrove status and management in Tien Lang district ............... 30
5.1.1. Status of mangrove forests in Tien Lang districts ...................... 30
5.1.2.Mangrove structures, biomass and carbon estimation-based field
survey .............................................................................................................. 36
5.2. Biomass and carbon estimation-based interpolation method ........ 39
5.3. Soil organic carbon estimation from field-based data collection . 41
5.4. Interpolation of soil carbon ............................................................ 43
5.4.1. Mapping IDW of total soil carbon stocks ................................... 43
5.4.2. Soil organic carbon at the depth of 0-20cm ................................ 45
5.4.3. Soil organic carbon at depth of 20-40cm. ................................... 46
5.4.4. Soil organic carbon at depth of 40-60cm .................................... 47
5.4.5. Soil organic carbon at depth of 60-80cm .................................... 48
5.4.6. Soil organic carbon at depth of 80-100cm .................................. 49
5.5. Solutions for better management of mangroves in Tien Lang ...... 50
5.5.1. Develop and consolidate multisectoral coordination mechanisms:
......................................................................................................................... 50
5.5.2. Establish and implement inter-sectoral monitoring institutions: 51
5.5.3. Strengthening propaganda about planning and management: .... 51
CHAPTER VI CONCLUSION, LIMITATIONS AND FURTHER STUDY 54
6.1. Conclusion ..................................................................................... 54
6.2. Limitations ..................................................................................... 55
6.3. Further study .................................................................................. 55
REFERENCES ................................................................................................ 56
APPENDIX ..................................................................................................... 62
ABBREVIATIONS
AGB
Above-Ground Biomass
BGB
Below-Ground Biomass
GIS
Geographic Information System
GPS
Global Positioning System
IDW
Inverse Distance Weighting
KO
Kandelia obovata
LULC
Land-use / Land-cover
NDVI
Normalized Difference Vegetation Index
NIR
Near-infrared
RGB
Red-Green-Blue
SAVI
Soil Adjusted Vegetation Index
SC
Sonneratia caseolaris.
SCM
Supervised Classification Method
TVI
Transformed Vegetation Index
UCM
Unsupervised Classification Method
i
LIST OF TABLES
Table 3.1. Sentinel image. ............................................................................... 18
Table 3.2. Investigate the status of mangroves ............................................... 22
Table 3.3. Equations for calculating biomass of mangrove species ............... 23
Table 3.4. Equations of vegetation indices used for estimate mangrove cover
......................................................................................................................... 26
Table 5.1. Mangrove extents in study sites by different methods .................. 30
Table 5.2. Map reliability test of NDVI index ................................................ 31
Table 5.3. Map reliability test of SAVI index ................................................. 32
Table 5.4. Map reliability test of Supervised classification method ............... 33
Table 5.5. Map reliability test of TVI index ................................................... 34
Table 5.6. Map reliability test of Unsupervised classification method........... 35
Table 5.7. Area of mangrove forest planted from 1995 to 2016 ..................... 36
Table 5.8. Map reliability test of IDW of tree biomass .................................. 40
Table 5.9. Map reliability test of accumulated carbon .................................... 40
Table 5.11. Map reliability test of total soil soil organic carbon .................... 44
Table 5.12. Map reliability test of soil organic carbon at 0-20cm depth ........ 46
Table 5.13. Map reliability test of soil organic carbon at 20-40cm depth ...... 47
Table 5.14. Map reliability test of soil organic carbon at 40-60cm depth ..... 48
Table 5.15.Map reliability test of soil organic carbon at 60-80cm depth ....... 49
Table 5.16. Map reliability test of soil organic carbon at 80-100cm depth .... 50
Table 5.17. Synthesis of conflicts in coastal resources use and solutions ...... 52
ii
LIST OF FIGURES
Figure 2.1: Spectral bands Sentinel 2 (Agency, 2018) ..................................... 8
Diagram 3.1. Flowchart of methodology used in this study ........................... 17
Figure 3.1. Study site ...................................................................................... 19
Figure 3.2. Distribution of plots for measuring............................................... 20
Figure 3.3. Sampling plot ................................................................................ 21
Figure 5.1. Mangrove extents by NDVI ......................................................... 31
Figure 5.2. Mangrove extents by SAVI ......................................................... 32
Figure 5.3. Mangrove extents by supervised classification ........................... 33
Figure 5.4. Mangrove extents by TVI ............................................................ 34
Figure 5.5. Mangrove extents by unsupervised classification ....................... 35
Figure 5.6. IDW interpolation of accumulated carbon and tree biomass ....... 39
Fig 5.7. Correlation of biomass and its carbon stocks .................................... 40
Figure 5.7. IDW of total soil organic carbon .................................................. 43
Figure 5.8. IDW of soil organic carbon at 0-20cm depth ............................... 45
Figure 5.9. IDW of soil organic carbon at 20-40cm depth ............................. 46
Figure 5.10. IDW of soil organic carbon at 40-60cm depth ........................... 47
Figure 5.11. IDW of soil organic carbon at 60-80cm depth ........................... 48
Figure 5.12. IDW of soil organic carbon at 80-100cm depth ......................... 49
iii
ABSTRACT
A mangrove community along the coastal zone of Tien Lang, Hai
Phong, Vietnam was selected to study biomass accumulation, carbon storage,
soil carbon stocks. Field data were conducted to measure in 15 plots with
dimension of 900m2 each plot has 3 subplots with dimension of 100 m2 at
three communes Dong Hung, Tien Hung, and Vinh Quang. Species
distribution and total biomass carbon were also analyzed. Sonneratia
caseolaris has maintained its dominance of the stand and also contributed the
highest to total biomass carbon . The mean of biomass carbon stock was
calculated at 111,6 ton ha-1 and soil organic carbon was 146.9 ton ha-1. This
research also applied some classification methods, such as NDVI, SAVI, TVI
indices, supervised and unsupervised. The accuracy was following
respectively by
85.6%; 67.5%; 58.3%; 68.9% and 81.8%. The IDW
interpolation of biomass and tree biomass had the same accuracy, which was
92.3% and soil carbon was 89.3%. Overall, Tien Lang mangroves are storing
vast amount of carbon
Keywords: Biomass carbon, soil organic carbon , GIS, Remote
sensing, mangrove forest, NDVI, SAVI, TVI, supervised and unsupervised
classification.
1
CHAPTER I
INTRODUCTION
Mangroves forests are placed in the intertidal areas along the coast in
most of the tropics and subtropics (Kathiresan and Bingham, 2001). They are
one of the most important and effective ecosystems and provide habitats for
wild animals (Wolanski et al., 2009). Mangroves played a significant role in
decreasing the damage caused by the tsunami in coastal areas. Its ecosystems
regulate water, protect the soil from erosion and provide a natural barrier
against storms, cyclones, tides, and other potentially damaging natural forces
(Dahdouh-Guebas et al., 2005, Bahuguna et al., 2008). For centuries,
mangroves have contributed significantly to the socio-economic life of coastal
residents. They are a source of firewood and provide construction materials,
charcoal, food, honey, herbal medicines, and other forestry products (Alongi,
2002, Hong and San, 1993). In addition, this ecosystem can act as a highly
efficient carbon pool in the tropics (Donato et al., 2011), because mangroves
can sequester carbon in both above and below-ground biomass as well as
within soil. Despite the large carbon storage potential in mangrove biomass
and soil, mangroves are under serious threat from high population growth,
aquaculture expansion, timber cutting, and other human activities (Duke et al.,
2007).
2
In Vietnam, remote sensing application in the forestry sector has been
applied for a long time by the forest inventory and planning institute to map
the forest status and store the map database in GIS software. Carbon
quantification in mangrove forest planted in the North Coast of Viet Nam
published at the natural science and technology publishing house (Nguyen
et.al 2017) had shown the carbon quantify process in mangroves. And it also
had developed a model for calculating carbon on and under the ground for
some of the plant species characteristic of mangroves, thereby evaluating the
cumulative potential carbon of different plants in mangroves. The calculation
of carbon sequestration and value of the forest often follow traditional
methods, so it takes a lot of time and energy. Although there has been a study
establishing correlations between forest, carbon and satellite surveyors, little
research has been done on carbon sequestration in forest conditions with
image classified.
In recent years, mangroves and coastal resources in Tien Lang district
have been under pressure to maintain the area and ecosystem functions from
the forest (Pham and Yoshino, 2016). One of the valuable point of mangrove
forests is high carbon storage but its estimation in Tien Lang district is still
limited. This study constructed the current map of mangroves distribution,
tree biomass and accumulated carbon in tree, soil carbon storage of mangrove
species in the coastal area of Tien Lang using 2A Sentinel imagery. With the
data collected from the fieldwork, this study will produce other side of
3
mangroves forest and conflict situation in Tien Lang. This work ― Estimation
of carbon stockse of coastal mangroves using Sentinel 2A in Tien Lang
district, Hai Phong city, Vietnam ― has provided further investigation into the
functional condition of mangrove ecosystems in the study area and may help
elucidate the spatial distribution patterns of carbon stocks in tropical and subtropical climates.
4
CHAPTER II
LITERATURE REVIEW
2.1. GIS and Sentinel satellite image
2.1.1. The concept of GIS, remote sensing
GIS (Geographic Information System) was formed in the 1960s and
developed extensively around the world. It is an information system that
captures, stores, manipulates, analyzes, manages and presents all types of
geographical data. Rooted in the science of geography, GIS integrates many
types of data. It analyzes spatial location and organizes layers of information
into visualizations using maps and 3D scenes. With this unique capability,
GIS reveals deeper insights into data, such as patterns, relationships, and
situations—helping users make smarter decisions.
Remote sensing is the science of obtaining information about objects or
areas from a distance, typically from aircraft or satellites. It has flourished
over the last three decades when providing digital imager from satellites in
Earth’s orbit since the 1960s. Remote sensors can be either passive or active.
Passive sensors respond to external stimuli. They record natural energy that is
reflected or emitted from the Earth's surface. The most common source of
radiation detected by passive sensors is reflected sunlight.
GPS (Global Positioning System) is a satellite navigation system used
to determine the ground position of an object. GPS technology was first used
5
by the United States military in the 1960s and expanded into civilian use over
the next few decades. Today, GPS receivers are included in many commercial
products, such as automobiles, smartphones, exercise watches, and GIS
devices.
2.1.2. Sentinel 2A satellite image
Sentinel-2A satellite sensor was successfully launched on June 23,
2015, at 03.51:58 am CEST from a Vega launcher from the spaceport in
Kourou, French Guiana. Sentinel-2A satellite is the first optical Earth
observation satellite in the European Copernicus programme and was
developed and built under the industrial leadership of Airbus Defence and
Space for the European Space Agency (ESA).
Sentinel-2A satellite was built by Airbus Defence and Space will add
color to the Copernicus programme through a multispectral instrument that
provides unique image quality. Copernicus is the new name of the European
Commission's Earth Observation Programme, previously known as GMES
(Global Monitoring for Environment and Security).
The mission is dedicated to the full and systematic coverage of land
surface including major islands globally with the objective to provide cloudfree products typically every 15 to 30 days over Europe and Africa.
Sentinel-2A satellite image data will support:
Generic land cover, land use, and change detection maps.
6
Maps of geophysical variables for leaf area index, leaf chlorophyll
content, leaf water content.
The span of 13 spectral bands, from the visible and the near-infrared to
the shortwave infrared at different spatial resolutions ranging from 10 to 60
meters on the ground, takes global land monitoring to an unprecedented level.
The four bands at 10-meter resolution ensure continuity with missions
such as SPOT-5 or Landsat-8 and address user requirements, in particular, for
basic land-cover classification. The six bands at 20-meter resolution satisfy
requirements for enhanced land-cover classification and for the retrieval of
geophysical parameters. Bands at 60 meter are dedicated mainly to
atmospheric corrections and cirrus-cloud screening.
Sentinel-2A satellite is the first civil optical Earth observation mission
of its kind to include three bands in the ‘red edge', which provide key
information on the vegetation state.
Sentinel-2A satellite will be able to see very early changes in plant
health due to its high temporal, spatial resolution and 3 red edge bands. This
is particularly useful for the end users and policy makers for agriculture
applications and to detect early signs of food shortages in developing
countries.
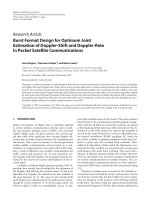
MSI covering 13 spectral bands (443–2190 nm), with a swath width of
290 km and a spatial resolution of 10 m (four visible and near-infrared bands),
7
20 m (six red edge and shortwave infrared bands) and 60 m (three
atmospheric correction bands).
Figure 2.1: Spectral bands Sentinel 2 (Agency, 2018).
2.2. Remote sensing application in carbon estimation and forest biomass
2.2.1. In the world
The method is used electromagnetic radiation as a means to investigate
the characteristics of objects (Lillesand and Kiefer, 1994). It has been a
valuable source of information for many decades and will be an important
source of information in the future. So far in the world, there is a lot of remote
sensing data used in forestry, some of the images are commonly used today
8
such as SPOT satellite images, LANDSAT satellite images, MODIS satellite
images.
Remote sensing applications in forestry:
Remote sensing application in mapping forest blocks, vegetation
A general observation is that when using photos to classify mulch,
forest type, the higher the layer of classification, the higher errors (Trisurat et
al., 2000).
Up to now, the use of remote sensing images to classify forest cover has been
widely applied, however depending on the type of image used, the
classification method and the level of detail in the forest classification
mapping requirements that reliability will vary.
Remote sensing application for monitoring biomass, forest carbon
The current trend is to use remote sensing images not only to map
overlays but also to monitor forest inventory factors including density, stock,
biomass, forest carbon. This will reduce labor and labor costs. The
(CHANGE-IPCC, 2003) argues that the remote sensing method is particularly
suitable for land use change analysis, land use mapping, forest carbon
estimation and, in particular, ground biomass monitoring. This method
provides complete and available reference data including forest resource
factor estimates.
Brown argues that in the future (Brown, 2002), forest carbon stock
measurements may be based only on remote sensing data with new techniques
9
for growing satellite imagery. Although biomass cannot be directly measured
directly in space, remote sensing data is directly related to biomass measured
directly on the ground (Dong et al., 2003). due to it can be estimated from this
relationship by mathematical models.
GIS application in forest carbon and forest resource data
management
The first GIS application in the world is the establishment and
management of a forest map database. However, the GIS function does not
stop there, it is a tool for supporting analysis, synthesis, and evaluate to
manage and make appropriate and objective decisions. In the field of forestry
it can help manage the database over time, analyze the relationship between
biomass, forest carbon with influencing factors, growth forecasts and CO2
emissions (Campbell et al., 2008).
The remote sensing application of spectral and spatial characteristics of
mangroves is an effective method for estimating vegetation cover as well as
the density and structure of forest vegetation. salty. They can collect
information in inaccessible areas and may allow repeated repetitions during
the year to aid in forest inventory as well as surveying, biomass surveys, and
carbon stocks are easier than ever.
Remote sensing is a tool chosen to provide spatial information on the
distribution of the mangroves ecosystem, species diversity, status, and
continual change of the mangrove population. Such studies may be based on
10
different sensors, from aerial photographs to high-resolution and average
optical images and from ultrasonic data to active SAR data. Remote sensing
techniques have demonstrated the potential for detecting, identifying,
mapping, and monitoring mangroves conditions and changes over the past
two decades, reflected by the large number of scientific papers produced. This
topic is about the topic. A recent paper on the control of mangroves is not
available, although mangroves ecosystems have become central to the current
climate change context and discussions about services provided by
ecosystems. The purpose of this review is to provide a comprehensive and
audio summary of all work performed, the remediation of remote data applied
to the RNM ecosystem mapping, as well. as many methods and techniques are
used for data analysis and to further discuss the potential and limitations of
remote sensing (Kuenzer et al., 2011, Van Noordwijk and Hairiah, 2007).
With the need for rapid monitoring about carbon sequestration in the
forest to participate in the forest environmental services payment scheme, the
World Agroforestry Center (ICRAF, 2007) has developed methods for
forecasting carbon sequestration Through the monitoring of land use change
by remote sensing analysis, biomass sample plot design and cumulative
carbon estimation. These methods should be inherited and considered more
appropriately applied to the forest ecosystem of Vietnam, in which the study
aims to establish sample plots for collecting biomass data, the amount of
11
carbon accumulated with the forest inventory factor, ecology has the scientific
basic and easy to use .
2.2.2. In Vietnam
Remote sensing application in carbon estimation
In Vietnam, remote sensing application in the forestry sector has been
applied for a long time by the Forest Inventory and Planning Institute to map
the forest status and store the map database in GIS software. Previously used
mainly Landsat satellite imagery, recently used high-resolution images such
as SPOT4 and 5. However, the use of images is mainly the mapping of the
coating, with the method of image interpretation. Eye-to-eye with field
training (GCP: Ground Control Point) to use image classification. Database
mapping is mainly stored in mapinfo software with VN2000 coordinate
system. At the provincial level, there are no national regulations for the use of
remote sensing imagery in forest classification, estimation of reserves,
biomass, carbon through photos.
Vietnam ratified the United Nations Framework Convention on
Climate Change on 16 November 1994 and the Kyoto Protocol on 25
September 2002, which is considered one of the most active countries in the
world. to enter the Kyoto Protocol at the earliest. However, in the area of
research on CDM, studying the carbon sequestration of forests, calculating the
value of forests is a relatively new and new issue. studied in recent years. The
12
CO2 sequestration study of the forest is mainly focused on plantation forest
species to be included in the CDM.
Ngo Dinh Que (2005), when researching and developing criteria and
criteria for afforestation under the clean development mechanism in Vietnam,
has assessed the actual CO2 absorption capacity of some plantation species in
Vietnam: Pinus merkusii, Acacia, Manglietia conifera, Acacia auriculiformis ,
Uro-eucalyptus in the different age. The results show that the CO2 absorption
capacity of the different stands, depending on the yield of the forest stands at
certain age. To accumulate about 100 tons of CO2 per hectare, pine merkusii
needles aged from 16 to 17, pine massoniana and pine kesiya at age 10, acacia
at 4 -5 years, acacia mangium at 5 - 6 years, Uro-eucalyptus at 4-5 years old.
This result is very important as a basis for the zonation planning and
development of CDM reforestation projects. The author correlated the
regression-transmutation correlations between the annual CO2 content
absorbed by wood yield and biological productivity. From this, it is possible
to calculate the actual CO2 absorption capacity in Vietnam for these 5 species
(Quế, 2006).
Vu Tan Phuong (2006) studied about determining the stocking of
Acacia hybrid plantations with many ages in the north (tree age 5 reached
41.04 tons C / ha) and ground herbs, with status IA, IB, according to the
Vietnam Forest Status Classification, as the basis for building the baseline
carbon road in CDM afforestation projects, said Rich Forest has a total carbon
13
stock of 649.9 - 733 , 9 tons CO2 / ha; the average forest is 539.6 - 577.8 tons
CO2 / ha; poor forest area of 387.0 - 478.9 tons CO2 / ha; The recovery forest
is 164.9 - 330.5 tons CO2 / ha (Phương, 2006).
The use of remote sensing images to estimate biomass and broadleaved evergreen forest carbon in the Central Highlands. Bao Huy et al.
(2013) used SPOT 5 images and applied three methods of image analysis:
non-decreasing, decreasing and relationship between biomass and image
index (DN) to estimate carbon from image . The results show that the method
of unclassified image classification combined with the ground carbon
determination data to establish carbon relations with classification classes
with a confidence level of 72-93%. However, this study due to limited ground
data should stop at the exploration and the method is the main. Therefore, this
thesis has continued to collect more in-depth research data on methods to
establish the relationship between biomass and carbon with image index,
photo layer (Bảo Huy và cộng sự: Nguyễn Thị Thanh Hương, 2012).
In general in Vietnam, the calculation of carbon sequestration and value
of the forest often follow traditional methods, so it takes a lot of time and
energy. Although there has been a study establishing correlations between
forest, carbon and satellite surveyors, little research has been done on carbon
sequestration in forest conditions with image values.
N.T.H.Hạnh (2009) Research on carbon sequestration of Trang
(Kandelia obovata) planted in coastal Giao Thuy district, Nam Dinh province.
14
PhD thesis in Hanoi Pedagogic University. The subject has given the carbon
calculus for Trang, and the general model for quantifying carbon stocks for
mangroves (N.T.H. Hạnh, 2009).
Assoc. Pham Van Cu and Le Quang Toan (2011), the results show that
the application of RADAR data in band C and field data to calculate
mangrove forest biomass in the Northern Delta is feasible and for the main
Relatively high for mangrove forests with a biomass value of less than 150
tons / ha (Phạm Văn Cự, 2011).
N.T.H.Hạnh (2017) Carbon quantification in mangrove forest planted
in the North Coast of Viet Nam published at the Natural Science and
Technology Publishing House. The topic has shown the carbon quantification
process in mangroves and has developed a model for calculating carbon on
and under the ground for some of the plant species characteristic of
mangroves, thereby evaluating the cumulative potential carbon of different
plants in mangroves (N.T.H.Hạnh, 2017).
15