Biomass and carbon accumulation in rhizophora stylosa griff forest at hoang tan commune quang yen town quang ninh province
Bạn đang xem bản rút gọn của tài liệu. Xem và tải ngay bản đầy đủ của tài liệu tại đây (743.49 KB, 50 trang )
ACKNOWLEDGEMENT
Firstly, i would like to express my sincere graititude to my advisor Dr. Pham Minh Toai
for the continuous supports of my thesis and related research; for his patience, motivation and
immense knowledge. His guidance helped me in all the time of research and writing of this
thesis. I could not have imagined having a better advisor and mentor for my thesis.
My sincere thanks also go to Prof.Dr. Lee MacDonald who always supported me,
read all email and ried to help as much as possible with all of their enthusiasm.
I also decicate my grateful for all the Doctors, Master and Lectures in VNUF, who
gave me a lot of knowledge, favors as well as memories.
I would like to thank Dr. Nguyen Thanh Tien, Lecturer of Thai Nguyen University of
Agricultural and Forestry for help me with valuable documents useful for my thesis. Another
thank is for all the people in Center for Science and Agricultural and Forestry Production in
Quang Ninh who helped me during my researching process
Last but not least, I would like to thank to my family: my parents and my sister and
brother for theirsupporting me spiritually throughout writing this thesis and my life in general.
1
ABSTRACT
Quang Yen district has 2,671 ha mangroves, compared to other regions in the
province, the area of forest here is not abundant, but in Quang Yen forest area is a very
important position in the protection dyke, discovered development of agricultural production,
aquaculture protection .This research concentratios on three objectives:
Identify some
biomass and carbon accumulation characteristics and of R. stylosa Griff forest at the study
area; Determine the relationship between biomass and carbon accumulation in R. stylosa Griff
mangrove forests; Propose rapid methods for biomass identification of the studied forest.
To deal with objectives as above mentioned, the research established 30 temporary
plots of of 100m2 (10mx10m) each in R. stylosa Griff forest. The studied results show that
average 3.6 cm diameter trees about 0.6 kilograms of carbon accumulated in tree biomass.
Total biomass and carbon accumulation sharp fluctuations between tree density,
diameter, height. The total biomass of the populations average of 0.011 tons/ha, the amount of
carbon in forest biomass accumulation averaged 1.03 tons C/ha.
However, to calculate with greater accuracy (tighter correlation) we should use
correlation equation Y = a + b * X, specific: Y = 0.693 X + 0.347 and Y = 0.833 X + 0.347
with r2= 0.193
In conclusion, the proportion of biomass and carbon accumulation in the individual
parts of the plant as well as the majority populations in the body parts and through the process
of analysis and correlation functions, we can easily calculate the dry biomass, cumulative
carbon content of mangrove species in correlation equation.
2
LIST OF ABBRIVIATION
AGB: above ground biomass
C: Carbon
CO2: Carbon Dioxide
TAGB: The total biomass of population (ton/ha)
Wt: The total biomass of tree
Wsk: dry biomass of stem ( kg, ton/ha)
WBrk: dry biomass of branch ( kg, ton/ha)
Wrk: dry biomass of root ( kg, ton/ha)
Wlk: dry biomass of leaves ( kg, ton/ha)
Wst: fresh biomass of stem ( kg, ton/ha)
WBrt: fresh biomass of branch ( kg, ton/ha)
Wrt: fresh biomass of root ( kg, ton/ha)
Wlt: fresh biomass of leaves ( kg, ton/ha)
3
TABLE OF CONTENTS
ACKNOWLEDGEMENT
ABSTRACT
LIST OF ABBRIVIATION
TABLE OF CONTENTS
LIST OF TABLES
LIST OF FIGURES
Chapter 1. INTRODUCTION .................................................................................................... 1
Chapter 2. NATURAL CONDITIONS OF STUDY AREA ...................................................... 6
2.1. Geographic and topography conditions ............................................................................... 6
2.2. Climate characteristics:........................................................................................................ 6
2.3. Land and Water resoureces.................................................................................................. 7
Chapter 3. STUDY OBJECTIVES AND METHODS ............................................................... 8
3.1. Study objectives ................................................................................................................... 8
3.2. Method ................................................................................................................................. 8
3.2.1. Data sources ...................................................................................................................... 8
3.2.2. Data collection method ..................................................................................................... 8
3.2.3. Data analysis method ...................................................................................................... 10
Chapter 4. RESULTS AND DISCUSSIONS ........................................................................... 13
4.1. Biomass characteristics of individual tree and populations............................................... 13
4.1.1. Structure of fresh biomass of individual trees ................................................................ 13
4.1.2. Structure of dry biomass of individual trees ................................................................... 14
4.1.3. Structure of the populations biomass.............................................................................. 15
4.2. Amount of carbon accumulation in different parts of individual trees and populations......... 19
4.2.1 Carbon accumulation in the individual parts of plants .................................................... 19
4
4.2.2 The ability to accumulate carbon in the population ........................................................ 22
4.3. Correlation models between biomass and carbon accumulation capacity ........................ 25
4.3.1. Estimation model of the total dry biomass of individual trees ....................................... 25
4.3.2 Model estimates of carbon stocks individual tree ........................................................... 27
4.4. Propose solutions for quickly biomass identification ........................................................ 28
Chapter 5. CONCLUSIONS AND RECOMMENDATIONS ................................................. 29
5.1. Conclusion ......................................................................................................................... 29
5.2. Recomemendation ............................................................................................................. 29
Chapter 6. REFFERENCES ..................................................................................................... 30
APPENDIX
5
LIST OF TABLES
Table 4.1. Structure of dry biomass populations ...................................................................... 16
Table 4.2. The ability to accumulate carbon in the individual parts of plants.......................... 20
Table 4.3. Cumulative carbon populations ............................................................................... 23
Table 4.4. Model estimates the total dry biomass of individual trees ...................................... 26
Table 4.5. Model estimates of carbon stocks estimate individual tree ..................................... 27
6
LIST OF FIGURES
Figure 2.1. The map of Quang Yen town, Quang Ninh province .............................................. 7
Figure 3.1. Plot establishment .................................................................................................... 9
Figure 4.1. The propotion of fresh biomass in different parts of R. Stylosa Griff.................... 14
Figure 4.2. The proportion of dry biomass in different parts of R. stylosa Griff ..................... 14
Figure 4.3. The proportion of dry biomass parts of R. Stylosa Griff population...................... 18
Figure 4.4. The proportion of accumulation of carbon stocks in individual trees. .................. 22
Figure 4.5. The proportion of average carbon accumulation in parts populations ................... 25
Figure 4.6. The diagram describes the correlation between dry biomass and survey factors
D1.3 .......................................................................................................................................... 26
Figure 4.7. The diagram describes the correlation between carbon stocks and factors
investigated DBH ..................................................................................................................... 27
Appendix A
Appendix B
7
Chapter 1. INTRODUCTION
Mangroves are an unique ecosystem in estuaries, coastal tropic, with diverse
biological resources and sensitive to the environmental change. It has strong effect in keeping
sediment, limiting erosion, accretion fixed, against the waves, providing nutrients for aquatic
species, acts as a biofilter, maintain balance ecology in the coastal areas.
Studies on biomass and carbon in forest ecosystems has been conducted from early of
the 19th century in order to determine carbon cycle - an important factor in the nutrition
management and forest productivity. Recent studies of biomass and carbon absorption
capacity of the forest becomes more important in the context of climate change. Currently,
climate change is a serious threat to the vital interests of many countries around the world.
People are facing with negative effects such as disease, poverty, loss of shelter, lack of
cultivated land, the decline of biodiversity, etc.Climate change is a natural phenomenon that
occurs throughout the history of Earth. However, the increasing in CO2 emissions in the
atmosphere recently has made the Earth's climate changed. There are many evidences that
indicate that humans have caused greenhouse gases (CO2, CH4), which affect to global
climate change. With forest heron increasingly shrunk the logging process is not reasonable
cause to carbon accumulation and more. According to Christopher Field (2007) :"The amount
of carbon stored in forest ecosystems attractive to increasing atmospheric CO2 and global
warming process happen faster,"( Cited from Le Tan Loi) [1] and in accordance with the
organization's statement Statistics Antarctica (BAS) in 2006. There are nearly 10 billion tons
of CO2 in the atmosphere, up 35% compared to 1990. One of the solutions to mitigate and
adapt to the effects of climate change, strengthen management of forest resources and the
environment, mitigation of greenhouse gas emissions for developing country participation in
the program is the REDD (Reducing Emission and forest Degradation Deforestation: reducing
greenhouse gas emissions from deforestation and failure deforestation), REDD + (REDD later
1
stage, the developing countries reduce forest loss and degradation to receive financial support
from developed countries) including Vietnam. The overall objective of Vietnam participating
REDD + is to contribute to reduce greenhouse gas emissions, increase the volume of forest
carbon, conserve biodiversity, and contribute to poverty reduction, environmental protection
and promote sustainable development in Vietnam.
Carbon in tree biomass comes from carbon dioxide gas (CO2) in the atmosphere
through the process of plant growth. The loss of vegetation cover, burning or decomposing
wood will make the carbon back to the atmosphere as CO2, or sometimes as methane (CH4) if
plants decompose. Thus, the forest is the sink that contains absorbed carbon in the air,
although there are several cycling gases basically occur daily. "Mangroves are ratio as capable
of achievement higher accumulation of carbon on the surface of other forest land (Ong, 1995)
and created the role of these reservoirs of carbon in the ecosystem coast (Kristensen, 2007) (
Cited from Vien Ngoc Nam) [2]. "Mangroves accumulate and store carbon from the process
of photosynthesis, carbon mostly is stored in the form of increased accumulation of biomass
of plant parts in the forest and forest land. However, parallel to the process of accumulation is
the process of liberating carbon from the ecosystem due to respiration, decomposition by
microorganisms. If the carbon accumulation is larger than the emission process, the forest is
considered the role of reducing CO2 in the atmosphere and mangrove planting project under
the Clean Development Mechanism (CDM) will implement effective and feasible.
The study of biomass and productivity of mangroves have also havebeen interested in
many countries since 1978 (Phan Nguyen Hong, 1991) (Cited from Vien Ngoc Nam) [2] .
Around the world, about research on biomass: There have been many authors such as
Clough, BF and Scott, K, (1989); Clough, BF, (1998); Clough, BF, Dixon, P. and Dalhaus, O
.., (1997) studied biomass on a large scale or on a national scope. "In Australia there have
been many studies related to mangrove biomass as correlation studies to assess regression
2
above ground biomass of mangrove trees (Cited from Phan Nguyen Hong) [2]. Research on
natural mangrove and plantation mangroves biomass, Christen, B (1978). Ong, J. E et al
(1983) ( Cited from Vien Ngoc Nam) [2] Research on wild mangrove forest and mangrove
plantation biomass (Rhizophora apiculata). Most of the authors are researchers on the ground
biomass, particularly Akira, K et al (1987.2000) have studied the size and root biomass under
the ground. "About accumulating carbon: Center for International Forestry of the Research
(CIFOR) shows carbon sinks of mangrove ecosystems in the Indian-Pacific is higher twice
than the rainforests and temperateratio. Research by Ha et al. (2001) showed that carbon
accumulation in the soil of the forest in Thailand ranged from 19.5 to 1158.1 tons/ ha. The
study also provides hypotheses about the factors affecting soil carbon accumulation of the
mangrove cover flooding, age and species composition of forests. Murdiyarso et al. (2010)
studied the ecosystem carbon storage in mangrove conservation area of Tanjung Puting,
Segara Anakan and Bunaken, Indonesia, carbon storage results ranged from 437 tons/ha to
2,186 tons/ ha. In particular, carbon underground (including soil carbon and carbon root)
account for 72% - 99%. Adame et al (2013) ,mangroves have the highest carbon stocks 987
tons/ha, followed by mangroves average 623 tons/ha, low mangroves 381 tons/ha and swamps
177 tons/ha. In fact, the studies did by scientists are mostly quantitative carbon on the ground
biomass and overall for the whole forest stand, forest type, whereas there are lack of specific
research for each species in the mangrove, different locations have different characteristic
species. ( Cited from Vien Ngoc Nam)
In Vietnam, the study of biomass and carbon accumulation had some case studies
following notable. About biomass: Phan Nguyen Hong and Nguyen Hoang Tri (1984) ( Cited
from Nguyen Thi Kim Cuc) [ 8] evaluated the plant biomass and primary productivity in Ca
Mau mangrove forest. Phan Nguyen Hong (1991) ( Cited from Nguyen Thi Kim Cuc) [8],
have studied terrestrial biomass of mangrove forests in the total 10-year-old lands were
3
sprayed herbicides ... Nguyen Hoang Tri, Hoang Thi Ha, Le Huong Giang, Phan Nguyen
Hong (2001) [ 2] has reviewed the assessment of net productivity of leaf page (Kandelia
candel) ... ". Research on carbon accumulation: ( Cited from Le Tan Loi) [ 1], the amount of
carbon absorbed during Mangrove conifera mainly focused on the trunk (54-80%), roots (1430%), tree (3-11%) and lowest in the leaves (1-6%), the carbon stored in the soil decreases
from top down of the soil profile. Carbon accumulation in roots of trees including the largest
(66%), followed by the ground (33%); of litter, self-falling, litter and vegetation is very low
below 0.5%. (Cited from Le Tan Loi) [ 1]: Cumulative carbon of Rhizophora apiculata is
97.26 t/ha . The ratio of carbon accumulation in the stem's individual tree is highest and is
increasing according to the diameter increases, but the ratio of carbon accumulation in leaves
is decreasing, while the proportion of carbon in stems and roots are relatively less volatile.
The accumulation of carbon in the tree can be used by various methods, such as chemical
analysis method in the laboratory LOI (Loss on Ignition or methods Chiurin ... In addition,
people can now calculate carbon accumulate in plants by converting units and value from
plant biomass. According to Nguyen Hoang Tri (2006) [ 5], the convert of unit and the value
of plant biomass into carbon forms are accumulated and then CO2 is done in a way that
consistency.
So far, the study of biomass and carbon accumulation in Vietnam as well as focused
primarily on the world. Especially Rhizophora stylosa Griff is studied less, scattered and not
systematic. Thus, the study of biomass and carbon accumulation of this species needed to be
concerned.
The study area belongs to Quang Yen (Yen Hung), located southwest coastal Quang
Ninh Province, located in the Red River Delta, an area with many systems of coastal
mangrove forests. It not only helps to protect the local population but also to contribute
significantly to the livelihood and the income of the local people.
4
Therefore, in the current context, research and determine the amount of increasing in
biomass and carbon accumulation of mangroves is necessary. It is the basis to determine the
payment for environmental services and to propose the management, protection of forests
methods, contributing to mitigate the effects of climate change. "Look at the amount of
biomass and carbon accumulation in forests with" was conducted to clarifying this issue.
“BIOMASS AND CARBON ACCUMULATION IN RHIZOPHORA STYLOSA Griff.
FOREST AT HOANG TAN COMMUNE, QUANG YEN TOWN, QUANG NINH
PROVINCE “ being conducted in order to clarifying these issues
5
Chapter 2. NATURAL CONDITIONS OF STUDY AREA
2.1. Geographic and topography conditions
Geographic location: The study area belongs to Quang Yen town, located southwest
coastal Quang Ninh Province, with the geographic coordinates are:
from 20º45’ 06 to 21º 02’ 09 North latitude
from 106 º 45’ 30 to 106 º 00’ 59 East longitude
The study area is located in the bordering area between the mountains of the Northeast
and the Red River Delta, and many rivers and creeks coastal Quang Yen with diverse
topography where, is divided cut into small islands. Chanh River is a major tributary of the river
Bach Dang Quang Yen divided into two stark. Ha Bac region: located on the left bank of the
Chanh River, topography mostly low hills, characteristic of a midland sloping toward the sea.
The complexity of topography has caused the obstacles in the process of soil
improvement and especially to build transportation systems , irrigation. But the majority of
the land is formed in the flatland, favorable for agriculture and aquaculture.
2.2. Climate characteristics:
Study area is characterized by coastal delta with tropical monsoon, simultaneously
influenced by the sea should be hot, humid and rainy.The sun shining is average from 1,700 to
1,800 hours / year. The average annual temperature is 22.9 C, the highest is 38 °C and lowest
is 5 °C; temperature amplitude of day and night is ranged from 5-7 °C. The highest average
temperature is 26.3 °C. The lowest average temperature of 20.5 °C. The average rainfall of
about 2,000mm, focus on July to December 9. Annual the average evaporation is 980,2 mm.
The average humidity in air is 82%. Wind in the region is not large( average 2.6 m / sec),
strong winds in months:7,8,9,10.
In general, the climate of Quang Yen quite moderate.Not only conducive to
agricultural production but also very suitable for tourism, resort. However, because the terrain
6
is relatively flat and low, near the seaside, estuaries. So, that be affected by hurricanes, floods,
tidal surges etc.Every year, the average is 3-5 storm in Quang Yen, causing great losses of life
and property. Especially, if heavy rain coincides with high tide time, the situation becomes
particularly dangerous, causing inundation by sea dikes destroyed.
Currently, the south of Quang Yen is surrounded by 146 km groyne( Ha Nam island:
33,6 km, Hoang Tan: 53.3 km,aquaculture swamps: 79 km) .The height of dikes are relatively
low( excepet Ha Nam). So it is always threat before the big storm. Historically, Hoang Nam
and Hoang Tan had broken the dyke, causing great loss to the local people.
2.3. Land and Water resoureces
Quang Yen town has a total natural area of 333.92 km2, accounting for 5.5% of the
whole province. Reviewed results of soil characteristics show that large parts of the district is
made up of alluvial river and sea (mixed with marine sediments) and influenced by the sea
with different levels. Particularly the northern section (located in the transition zone of the
northeastern mountains) should nature of upland. According to the classification features,
Quang Yen has the following main groups of soil: feralit soil, terraces ; soil sloping; soil
emaciation; soil salinity and acidity;
coastal alluvium soils; sandy soil; saline soil. In
particular, major soil groups in the town include of: ; soil emaciation; soil salinity and
acidity; coastal alluvium soils; sandy soil.
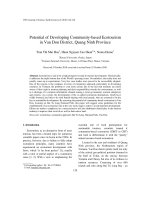
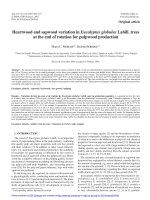
Figure 2.1. The map of Quang Yen town, Quang Ninh province
7
Chapter 3. STUDY OBJECTIVES AND METHODS
3.1. Study objectives
Objectives of this study are to
(1) Identify some biomass and carbon accumulation characteristics and of R. stylosa
Griff forest at the study area.
(2) Determine the relationship between biomass and carbon accumulation in R. stylosa
Griff mangrove forests.
(3) Propose rapid methods for biomass identification of the studied forest
3.2. Method
3.2.1. Data sources
The document related to natural conditions (topography, climate, soil,…) and social
economic in study sites.
The results of some related studies (biomass, cumulative carbon of mangroves status).
3.2.2. Data collection method
Research methods of biomass standard tree and forest
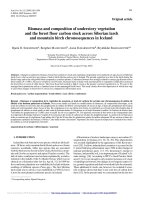
* Set up sample plots :
- Sample plots were established along transect from the dyke to the sea.
- Total number of sample plot is 30 plots. Each plot has an area of 100 m2 (10mx10m).
Within each samplot, 05 (five) sub-plots of 04 m2 (2mx2m) each have been setting up in
which 04 plots located at the corners and 01 plot located at the center of the plot.
8
Figure 3.1. Plot establishment
* Field survey:
In sample plots of 100 m2, identify all that have DBH of more than and equal 6cm.
Carrying out measured surveys: Diameter at breast height (DBH) and tree height (Ht), in which,
DBH is measured by Palme ruler and Ht is measured by Blume Leiss with the distance
of 15m far from the root to measuring point.
Results after measuring are denoted in the Appendix 01
* Destructive sampling of the standard trees:
- In each samplt plot, based on the average value of species about DBH and Ht,
conducting selection and cutting down trees have DBH and Ht equal DBH, Ht's forest stand.
- After cutting down, conducted classification: stems, leaves, roots and part of their
individual weight will be as fresh biomass. The results will be recorded in Appendix 02 Fresh
biomass of Rhizophora stylosa Griff. species.Then, each 01 samples taking approximately
0.5kg and is labeled on the bag for drying and determining the carbon content in the
laboratory. Trunk form, taking 01 of about 3cm thick wooden and cutting position from 1.3m
and weigh up. Thus, the total amount we will be 30 samples of stem , 30 samples of branch,
30 samples of leaves and 30 samples of roots.
9
* Drying of sample
Each part of the tree will take 100g sample,dried at 105°C for stem and 85°C for the
other parts to constant dry weight.The results will be recorded in Appendix 03 Dry biomass
of Rhizophora stylosa Griff. species
3.2.3. Data analysis method
3.2.3.1 Determining the biomass of individual trees and populations
- Determine the conversion coefficient of fresh biomass into dry biomass (P): Based on
the samples analyzed in laboratories biomass, conversion coefficients from fresh biomass into
dried biomass is calculated according to the following general formula:
P=
Where:
Wki is drying up the volume of the sample i
Wti is fresh sample volume prior to drying i
-After obtaining the ratio between fresh and dry biomass (Pi). The determination of
the biomass of each individual plant parts as follows:
Identify parts of dry biomass (stem, branch, leave, root): dry biomass parts (stems,
leaves, roots) of individual trees is determined = Fresh biomass ratio x Dry / fresh (Pi) each
part of the tree (each part have proportion of fresh biomass/dry different from the laboratory
analysis):
W(Sk,Brk,Lk,Rk)=W(St,Brt,Lt,Rt) x Pi
Where: W(Sk,Brk,Lk,Rk)is the dry biomass of individual plant parts and
W(St,Brt,Lt,Rt) is fresh biomass of individual tree
Dry biomass of individual tree: dry biomass of individual trees is calculated by the
total biomass of individual plant parts (including dry biomass of stem,branch, leave, root)
The biomass of the populations is calculated by the total biomass of the trees standards
and 1 ha. Calculate the density of the forest:
N 10000
(tree/ha)
SOTC
10
3.2.3.2 Determine the amount of carbon accumulation
We will apply the method of calculation of the accumulated carbon in the Japan
International Forestry Promotion and Cooperation Center (JIFPRO) application volume of
carbon accounted for 50% of the volume of dry biomass ( Cited from Trinh Xuan Thanh, Do
Huu Thu) [3]. Been accumulating carbon: C = dry biomass x 0.5 (kg)
3.2.3.3 Developing a relationship model between biomass and carbon accumulation capacity
The model is set up for individual trees to estimate biomass and carbon accumulation
based on close relationships between biomass, carbon accumulation factor for plant growth in
line with the growing law and based on interpolated from the perspective of indicators to
measure the indicators difficult to measure a simple way.
The model is based on the equation to apply analytic trees to estimate biomass and
some other factors that are not cut down the trees.
Database to establish the correlation model for individual trees including DBH data
(DBH) total fresh biomass, dry biomass total, total carbon accumulation.
Using SPSS 16.0 software selection equations with the highest correlation coefficient
and the smallest error, and most applicable when examining the existence of the equation and
the regression coefficients are smaller probability 0.05 (default value of SPSS 16.0). These
relationships are important:
- The relationship between the total dry biomass of individual trees to survey factors: DBH
- The relationship between total carbon accumulation of the individual tree survey
factors: DBH
Correlation equation showing the relationship between the quantities are established by
the command: Analyze \ Regression \ Curve Estimation in SPSS. The study has tested the
correlation function: Linear, Logarithmic. Selected equations are equations with the largest
correlation coefficient and the standard error is minimum.
11
3.2.3.4 Recommended identified some applications faster biomass estimation
From the results of the study, subjects given to conduct the process for determining the
biomass of important issues are:
- Construction of conversion coefficient from fresh biomass into dry biomass, dry
biomass to accumulate carbon
- Based on the correlation equation established application proposed equation to
determine the biomass.
12
Chapter 4. RESULTS AND DISCUSSIONS
4.1. Biomass characteristics of individual tree and populations
Forest biomass is the result of the growth and development of individual trees in forest
tree populations.Study on individual tree biomass is the basis on determining the biomass
populations. Each tree is an individual can create a populations with characteristics
determined. Individual tree biomass is an indication of the growth, the growth of the trees, is
the result of the synthesis of the priest in the trees organic. So biomass plants are closely
relationship to the diameter and height of the tree.
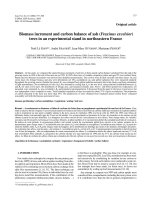
4.1.1. Structure of fresh biomass of individual trees
The results of weights and measures of fresh biomass plant parts of 30 sample tree are
shown in Appendix 02. These results show that:Fresh biomass of stem is the highest ,
accounting for 55.1% of the total fresh biomass of plants, this ratio ranges from 9.5- 73.9%,
fresh biomass of branch accounted for 23.6% of the total fresh biomass of plants, this ratio
varied from 3.4.- 61.9%; fresh biomass of leaves accounted for 11.1% of the total fresh
biomass of trees, varying from 3 -27.3%; The remaining parts account for at least 10.2%
occupied stilt root.The majority of the plant biomass tends to increase with the size of the
diameter of the tree, however the ratio of biomass of parts such as stem,branch, leave, root did
not increase with the size depending on the diameter of which each tree. This survey shows
that the distribution of plants in the population leads to uneven parts of the tree grow
disproportionate.
13
10,20%
11,10%
Wst
55,10%
23,60%
Wbrt
Wlt
Wrt
Figure 4.1. The propotion of fresh biomass in different parts of R. Stylosa Griff
4.1.2 Structure of dry biomass of individual trees
Similar to the calculation results and discuss fresh biomass, dry biomass of plant parts
(Figure 04 and Appendix 03) also have large fluctuations, dry biomass of stem and stilt root
are very high ratio, accounting for 89.64% of total average dry biomass of plants. This ratio is
higher than the total of fresh biomass, suggesting that water occupies the woody biomass of
individual trees is less than in the leaves. The ratio of dry biomass of individual trees is the
highest stem parts. accounting for 55.51% on average, ranged from 9.38- 74.44%; followed
by the percentage of biomass accounted for 22.83% dry branches, varying from 0:19 - 62.5%;
dry root biomass is 10:36%, varying from 3.7 - 23:44% and leaf biomass was 11.3, from 2.7827.34% volatility.
10,36%
11,30%
Wsk
55,51%
22,83%
Wbrk
Wlk
Wrk
Figure 4.2. The proportion of dry biomass in different parts of R. stylosa Griff
14
4.1.3 Structure of the populations biomass
Previously, the forestry business in the forestry people especially interested in that
forest productivity achieved in the business cycle or the life cycle of the forest. That yield is
calculated the total standing volume per unit area. Today, in addition to interest in forest
productivity gain is also concerned about the value of environmental services that forests
provide. Therefore, the study populations biomass is the basis for forest managers to propose
technical measures to increase forest productivity as well as enhance the environmental value
of forests.
From the equation calculates individual tree biomass (stem, branch, leave, root) have
populations mangrove biomass. Biomass synthesis parts of all plants in a population is the
total biomass of the population biomass calculations the The results calculation of biomass
populations are reflected in Table 4.1
15
Table 4.1. Structure of dry biomass populations
No
DBH(cm)
Ht(m)
Density(N/ha)
1
3.05
2
2
3.12
3
Wsk
Wbrk
Wlk
Wrk
TAGB
t/ha
%
t/ha
%
t/ha
%
t/ha
%
ton/ha
100
0.095
95
0.025
25
0.005
5
0.005
5
0.1
2.2
200
0.120
60
0.028
14
0.014
7
0.008
4
0.2
2.77
1.5
100
0.021
21
0.058
58
0.007
7
0.014
14
0.1
4
3.25
2.3
500
0.56
70
0.085
10.625
0.090
11.25
0.070
8.75
0.8
5
2.72
1.1
300
0.066
33
0.036
18
0.033
16.5
0.015
7.5
0.2
6
3.24
2.4
2000
1.340
89.3
0.060
4
0.080
5.3
0.320
1.4
1.5
7
3.3
2.3
500
0.445
63.58
0.035
5
0.110
15.71
0.110
15.71
0.7
8
3.35
2.2
100
0.076
76
0.024
24
0.004
4
0.004
4
0.1
9
3.51
2.4
1000
0.350
31.9
0.590
53.6
0.080
7.27
0.040
7.23
1.1
10
3.74
2.2
200
0.240
52
0.160
33
0.036
7.5
0.036
7.5
0.5
11
3.71
2.3
1500
0.825
59
0.405
32.4
0.060
4.3
0.060
4.3
1.4
12
3.6
2.5
2200
1.628
62.6
0.330
12.7
0.374
14.4
0.308
10.3
2.6
13
3.55
2.4
1900
1.425
71.25
0.133
5.75
0.228
11.5
0.228
11.5
2
14
3.52
2.5
3600
1.656
36
0.612
13.4
1.260
27.4
1.080
23.2
4.6
15
3.61
2.7
3800
2.850
63.4
0.057
1.27
1.140
25.3
0.475
10.03
4.5
16
3.63
2.6
3900
1.716
52
0.585
17.7
0.429
12.6
0.585
17.7
3.3
16
17
3.45
2.5
1300
0.832
59.4
0.286
20.4
0.052
3.7
0.208
16.5
1.4
18
4.05
2.8
3200
4.198
70
1.187
19.8
0.198
3.3
0.400
6.9
6
19
4.25
2.1
2600
2.470
72.4
0.312
9.2
0.312
9.2
0.312
9.2
3.4
20
4.11
2.9
2900
2.900
63
1.015
22.06
0.580
12.6
0.145
2.34
4.6
21
3.94
2.6
800
0.560
56
0.168
16.8
0.128
12.8
0.096
14.4
1
22
3.86
2.7
3700
3.774
71.21
0.703
13.26
0.148
2.8
0.703
12.73
5.3
23
4.25
2.8
2500
2.075
61.02
0.937
27.6
0.100
2.9
0.312
8.48
3.4
24
4.32
2.6
2400
1.920
54.9
1.056
30.17
0.144
4.1
0.336
10.83
3.5
25
3.41
2.4
3700
1.036
26.02
1.406
36.05
0.888
22.76
0.592
15.17
3.9
26
3.78
2.5
3700
1.776
53.8
0.851
25.8
0.555
16.8
0.148
3.6
3.3
27
3.05
2.8
900
0.774
59.5
0.144
11.07
0.297
22.8
0.081
6.63
1.3
28
3.32
2.1
200
0.048
43
0.054
27
0.012
24
0.006
6
0.2
29
4.25
2.6
300
0.183
45.75
0.153
38.25
0.033
8.25
0.048
7.75
0.4
30
4.15
2.4
500
0.220
44
0.125
11
0.055
1
0.020
44
0.5
Average
3.595
2.38
1686.666
1.205
Wbp
Wbp/TAGB
0.387
56.6
0.248
19.5
0.225
10.7
The results in Table 04 showthat biomass proportion of parts to the total biomass in parts large fluctuations. Specific:
.
17
2.063
13.2
The ratio of dry biomass of populations high on the stem, accounting for 56.6% on
average, ranged from 21-95%. The ratio of branch biomass accounted for 19.5% average, 4 58% volatility. The ratio of leaf biomass is 10.7%, varied from 1-27.4%. The remaining
13.2% root biomass accounts, varying from 2:34 - 23.2%.
The total average biomass of the populations is about 0.011 tons/ha. From the results
showed that the density of the populations differ and may also affect the populations of forest
biomass. Minimum tree density (100 trees/ha corresponding to 0.1 t/ha) and the largest
density of trees (3900 trees/ha corresponding to 3.3 t/ha) and plant density 3200 trees/ha
corresponding to 4.6 tons / ha. Thus, we can see that the biggest tree density can not rmang
the highest biomass due to the spatial arrangement between the tree nutrition and make the
most of the nutrition space.
In Figure 05 also shows the relative majority of biomass plant and 3 parts (branch,
leaves, roots) in tiny amounts.
Figure 4.3. The proportion of dry biomass parts of R. Stylosa Griff population
18