Biodiversity and ecological association of tree species in special use forest huong son my duc ha noi
Bạn đang xem bản rút gọn của tài liệu. Xem và tải ngay bản đầy đủ của tài liệu tại đây (947.02 KB, 57 trang )
ACKNOWLEDGEMENTS
This study was conducted for 5 months with lot of support, guidance and
encouragement from teachers, friends and beloved family members as well as relevant
institutions. Taking this opportunity, I would like to express my thanks to all..
First of all, I would like to express my great respect and profound gratitude to my
supervisor, Prof.Dr. Pham Van Dien and co-supervisor, Dr. Le Quoc Huy for their lucid and
genial guidance, encouragement and hospitality. Only with their enthusiastic guidance and
encouragement, I was able to accomplish my study successfully as designed
I also would like to express sincere thanks to the Management Board, Forest ranger of
Huong Son Special Use Forest, local people and especially Vietnam National University of
Forest (VNUF) and
Research Institute for Forest Ecology and Environment (RIFEE) -
Vietnamese Academy of Forest Sciences (VAFS) for kind help and support with regard to
study sites, datasets and administrative arrangement for my thesis study.
Finally, I appreciate my family and classmates who were always by my side, motivate
and encourage me.
Due to time constrains , knowledge and capacity limitation, this study might still have
some mistakes, I am really sorry for this inconvenience if any. I look forward to the future
endeavor with your continuos support and collaboration for my better research work.
Sincerely
Ha Noi . October 2nd, 2016
Le Thi Thu Hang
1
ABSTRACT
The biodiversity and ecological association of tree species has an important meaning
,tree layer is decisive component of forest ecosystem but it hasn’t earn much attention in our
country . Therefore, study on diversity and ecological association of them in natural forests
takes a very important role for more understanding about this system. The study was based on
18 sampling plots (1000 m2/plot), distributed on 06 fields in the special use forests of Huong
Son, Ha Noi. The paper determined 05 important characteristics concerning the tree
communities, including: (i) important value index (IV, %); (ii) species dominance pattern;
(iii) species diversity indices; and (iv) assessment of factors affecting the study site (v)
ecological association of tree species and proposed some conservation measures and
sustainable development . The results indicated that, all plots together there are 43 species
found to be ecological significance in the communities with their IV higher than 5%, and
there are four species found as dominance in three plots with their IV more than 30%, made a
geometric steep slope pattern in the top niche of diversity dominance (D-D) curve. IV change
curve by species sequence showed that, big differentiate among studied fields. The value of
species diversity indices also showed that, diversity of tree species in the studied sites is at
medium level. From results of estimating the Site disturbance index (SDI) consider that
almost of study site are more or less influenced by human, in which the biggest factors
affecting the biological diversity is Agriculture encroachment. There were up to 11 couples of
tree species found with their similarity of 80%. The results showed that 120 tree species found
in the studied sites were devided into 04 ecological groups. Through this approach, we could
infer the relationship among them (independent, mutual, or comparative). Based on results
achieved, the present study would be considered as a typically quantitative research on
diversity and ecological association of tree species. In addition, the paper has its significance
for further understanding about tree communities of tropical natural forests in special use
forests of Huong Son, Ha Noi.
2
TABLE OF CONTENT
ACKNOWLEDGEMENTS
ABSTRACT
TABLE OF CONTENT
LIST OF TABLE
LIST OF FIGURE
1. INTRODUCTION .................................................................................................................. 1
2. REVIEW OF LITERATURE ............................................................................................... 10
3. RESEARCH GOALS AND OBJECTIVES ......................................................................... 15
3.1. Goals .................................................................................................................................. 15
3.2. Specific objectives ............................................................................................................. 15
4. METHODS ........................................................................................................................... 18
4.1. Establish the sampling plot ................................................................................................ 18
4.2. Data collection method ...................................................................................................... 18
4.3. Calculation method ............................................................................................................ 18
4.4. Dominance Diversity curve (D-D) method ...................................................................... 20
4.5. Estimating the Site disturbance index (SDI) method ........................................................ 21
4.6. Data analysis method ......................................................................................................... 23
5. RESEARCH RESULT AND DISCUSSION ....................................................................... 24
5.1. Important Value Index (IV%)........................................................................................... 24
5.2. Dominance Diversity Curve of trees species in Huong Son SUF ..................................... 28
5.3. Diversity indices of tree species ....................................................................................... 34
5.4. Assessment of factors affecting the study site ................................................................... 36
5.4.1. Agriculture encroachment .............................................................................................. 36
5.4.2. Invasive species .............................................................................................................. 37
5.4.3. Tourism activities ........................................................................................................... 37
5.4.4. Firewood and medicinal collection ................................................................................ 38
3
5.4.5. Logging and fires ............................................................................................................ 38
5.5. Ecological Association of tree species .............................................................................. 40
5.6. Proposed some conservation measures and sustainable development. ............................ 44
5.6.1. Policy and sustainable management of forest resources solutions: ............................... 45
6. CONCLUSION .................................................................................................................... 48
7. SHORTCOMINGS AND RECOMMENDATION.............................................................. 50
7.1. Shortcomings .................................................................................................................... 50
7.2. Recommendation ............................................................................................................... 50
REFERENCES
4
LIST OF TABLE
Table 4.1. Site Disturbance Index - SDI.................................................................................. 22
Table 5.1. Importan value index ............................................................................................... 25
Table 5.2. Diversity Indices of tree species .............................................................................. 34
Table 5.3. Site disturbances index definition ........................................................................... 39
5
LIST OF FIGURE
Figure 3.1. Map of Huong Son Special Use Forest with sites under the study (source: Huy et
al 2008, Cong 2013 ................................................................................................................... 17
Figure 5.1. Dominance Diversity Curve of tree species in Gieng Chen .................................. 28
Figure 5.2. Dominance Diversity Curve of tree species in Thung Sau .................................... 29
Figure 5.3. Dominance Diversity Curve of tree species in Ben Da Rung Vai ......................... 29
Figure 5.4. Dominance Diversity Curve of tree species in Hinh Bong .................................... 30
Figure 5.5. Dominance Diversity Curve of tree species in Thung Mang ................................. 30
Figure 5.6. Dominance Diversity Curve of tree species in Tuyet Son ..................................... 31
Figure 5.7. Dominance Diversity Curve of all sites together under sutdy in Huong Son SUF 32
Graph 5.1. Ecological Association of tree species in stand ...................................................... 41
Graph 5.2. PCA graph represent for ecological association of tree species .......................... 416
Graph 5.3. Branching graph represents the relationship between the secondary plot .............. 43
Graph 5.4. NMDS secondary sampling plot ............................................................................ 44
6
INTRODUCTION
Environmental degradation is one of the most serious issues over the world today, it
includes deforestation, biodiversity loss, pollution , desertification, climate change, global
warming and so on. The consequence of environmental degradation can be devastating on the
social, economic and environmental values and systems. As a cause from the environmental
degradation, forests and biodiversity resources are still being declined and lost at all local,
regional and global scales . Around the world, biological communities that took millions of
years to develop are being devastated (Sharma 2003)[1]. About 20 per cent of all species are
expected to be lost within 30 years and 50 per cent or more by the end of 21st century
(Sharma 2004)[2]. The current decline in biodiversity is largely the result of human activities,
ranging from habitat destruction, over-harvesting, and pollution, to inappropriate introduction
of exotic plants and animals The diversity of natural ecological communities has never been
more valued than it is now, as it becomes increasingly threatened by the environmental crises.
Efforts are, therefore, needed to conserve biological resources and utilize them on a
sustainable basis, and maintain genes, species and ecosystems (Verma 2000)[3]. the signing
of the Convention on Biological Diversity by more than 190 countries at the Earth Summit in
Rio de Janeiro in 1992 put this subject at the top of international environmental agenda and
brought a sense of urgency to the issue of biological conservation. Biodiversity ... is not only
fundamental to the quality of human life. It is essential for human survival.( Tuxill, J., &
Bright,1998)[4] and The future of biodiversity signifies the future of humankind. Its pathways
to restoration or destruction are for humans to choose. By being cognisant, and by being
morally alive, humanity can work to save its own body and soul (O’Riordan, T. et al. 2002)[5]
so maintenance of biodiversity in managed forest ecosystem is an increasing concern (Jobidon
et al. 2004)[6].
In 1992, the World Conservation Monitoring Centre evaluated Vietnam as one of the
16 most biologically diverse countries in the world . In Viet Nam , biodiversity plays a very
7
important role in the socio-economic and environmental development of Vietnam. Through
these services, biodiversity makes significant contribution to the national economy, providing
a basis for ensuring food security; maintaining genetic resources of animals and plants; and
providing materials for construction, fuel and pharmaceutical resources. However, Vietnam’s
biodiversity is facing many threats (Van Huu Tap , 2015)[7].
Ecological association among species is a characteristics of forest vegetation. The
survival, variation and the distribution of a certain species in space and time depend not only
on the physical environment (climate, soil) but also on the mutual relationships between
species coexist in the environment. In nature, populations or organisms do not exsist alone,
but they usually do coexistence and interaction among each other for their better exsistance
and association. Mutual interactions among species expressed in many aspects: competition,
parasitic, symbiotic, mutualism and so on. Plant community is a collection of plant species
coexisted on a defined region, is characterized by a combination of species composition,
structure, relationships between species with each other and with the environment. Features of
this reciprocal relationship are established by life forms and ecological characteristics of the
plants and also by the characteristics of the habitat that is the characteristic of climate, soil and
human impact, animal. Biological relationships are extremely complex and diverse, and not
always, we would distinguish these relationships together. Study about ecological association
among species, groups of species, or event among plant communities provide us with valuable
information on the partern, the role, the affect each other and impact on natural ecosystems of
plant species.
As part of the SUF system in Vietnam, the Huong Son SUF is an important natural
reserve for biodiversity, landscape and curtural conservation as well as local livelihoods.
However, the forests and biodiversity there are currently affected negatively by both human
activities and natural incidents and degradations. Therefore, the conservation of biodiversity,
protection of precious gene pool as well as other natural resources are concerned. There were
8
already some itnitial research on forest enventories and assessment for values, significances
and potentials of the protected area, however, a number of important issues has not been done
systematically and scientifically with regard to vegetation and biodiversity partern
examination, biodiversity and vegetation quantification, their valuation and so on, those
would be the important basis for knowledge and understanding, for later application studies
and soluation development, as well as other issues of decision makers for its sustainable
management and utilization.
All together, there is an urgent need to carry out studies to understand biodiversity and
ecological association. We should find its uses and conservation, planning and management
for concept of sustainable management and development. In view of the situation and
requirements, the study” Biodiversity and Ecological Association of tree species in special use
Forests Huong son, My Duc, Ha Noi “ was formulated to conduct. This present study as a
topical issue, would meet the gap of requirement and would contribute well for the
development of measures and solution as mentioned above
9
1. REVIEW OF LITERATURE
Biodiversity conservation
Vietnam is one of the most biodiversity rich countries in the world, comprising only
1% of the earth’s surface but being home to 10% of all species. Nevertheless, many threats to
biodiversity in Vietnam that are existing. Being introduced in 1992, the Convention of
Biological Diversity (CBD) is considered as a principal comittment of signed state members
to conserve and utilise the world biodiversity in a sustainable way and to equally share
benefits provided by this resurce. The Strategy has been released, serving as a basic
orientation for the long-term development of forest resources in Vietnam. In 1995, the first
National Biodiversity Action Plan (NBAP) of Vietnam that was approved by Prime Minister.
This plan has become a legal document that directed biodiversity conservation activities in
Vietnam (report to the biodiversity convention secretariat) . Ingeneral, Vietnam has been
acknowledged as a country with high biodiversity, and as one of the prioritized nations for
global conservation so need to national biodiversity strategies and section plans for
biodiversity conservation and sustainable management.
Biodiversity measurement and quantification
Research biodiversity and the biodiversity of the areas of study that has long been the
world's scientists particularly interested, so has a lot of studies have been published.
Biodiversity attracted the interest of all communities and the scientists by the need to learn
and its importance to human beings. Biodiversity attracted the interest of all communities and
the scientists by the need to learn and its importance to human beings. Regarding quantitative
biodiversity research.
The diversity of species in tropical rainforests is expressed by the formula ShannonWeiner (1971) as a parameter to compare the density of each species with H = 6.0 (6.2 = 97%
maximum) is greater than 10 times temperate broadleaf forests (0.6) This index decreases
from the tropics to two poles, and depends on different continents. In the result of research
10
Pandey (Pandey et al. 2002)[8] when researching biodiversity index H 'of vegetation in some
study site of moist temperate forests ecosystems in western Himalayan , considered that ,
biodiversity index H’ of this study site is relative lower than humid tropical forests, H index
of tree species reached maximum is 2.25 , shrub is 2.31, herbaceous plants is 2.69.
Risser and Rice (1971)[9] reported that, tropical rain forests were found to have a
much higher plant species diversity than temperate forests. In temperate forests, highest
values for Shannon diversity were recorded at 2.0 to 3.0 while Braun (1950)[10] reported tree
diversities between 1.7 and 3.4 in forest in eastern North America. For tropical rain forests, a
higher diversity (5.4) was found by Knight (1975)[11] .Besides H index also depend on other
factor such as climate condition, atitude, altitude, the level of environmental pollution. H
index of the humid tropical rain forests is very high 5.06-5.40 than 1.16-3.40 for temperate
forests (Braun 1950); Monk 1967; Riser and Rice, 1971; Singhal et al., 1986)[10][12][9][13].
H index is decrease from the equator to the north pole and a south pole and from low
mountain to high mountains. H index of polluted water basins is only 1 or less, while in the
water basin can be 2, 3 or higher
Vietnam has been acknowledged as one of the most prioritized countries for global
conservation due to its richness in biodiversity. Since 1994, Vietnam has officially joined the
Convention of Biological Diversity (CBD), the “ecosystem approach” which endorses
principles of negotiated local governance and adaptive management (Vermeulen and Koziell
2002)[14] and committed itself to conserve and utilize its biodiversity in a sustainable, thus
the result of research about quantitative biodiversity also interested by researchers. It is basis
for conservation measures and sustainable development of biodiversity resources. According
to the result of biodiversity report (H’) in Huong Son SUF, H’ ranged 3.83 -5.50. This result
is suitable for current time, the result considered that: Shannon-Wiener (H’) ranged 2.63-5.08.
The major difference in Shannon H 'in the study site to reflect the differences in ecological
conditions and site disturbance condition . The maximum value of H’ index achieve is site
with medium impact.
11
In “Growth , demorgraphy and stand structure of scaphium macropodum in differently
managef forests in Vietnam ” ( Le Quoc Huy, 2012)[15] quantified species diversity of S.
macropodum plant communities at four sites: Cattien, Bachma and M’drak ,Dakuy, with
different level off disturbance. Across these sites, the Shannon-Wiener index (H’) ranged
from 2.63-5.08; IVI values for S. macropodum ranged from 17.5-80.0 (IVI total: 300). The
highest values of H’ were found at the medium disturbance sites, where the D-D curve
strongly suggests a lognormal series and S. macropodum seems to thrive best. Research also
found that relationship between H’ and the site disturbance index (SDI) strongly fitted a
quadratic regression model (r2 = 0.76, p< 0.001) and the H’ diversity peaked at moderately
disturbance (SDI of 0.45) in the study sites.
Pham Thi Kim Thoa[16] 2012 research biodiversity of tree species in Son Tra – Da
Nang nature conservation area for that in study site, H’ index is high, it ranged 1.62-4.76 .
However level of biodiversity in communities tended to decrease due to impacted by
environment and human activities.
Le Thanh Cong et al 2009[17] assessed biodiversity by calculate biodiversity index :
IVI, H’, Cd, A/F for Huong Son SUF given the result for species diversity index H( ShannonWeiner) of tree species is relative high , ranged 3.83-5.50 belong to scope of humid tropical
natural forest , whereas H 'of the shrub is 3.02-5.20 and herbaceous plants ranged 1.98-4.12
The number of tree species, which has ecological significance in communities varied
from 12 to 15 species (among total of 88 and 73 species in OTC1 and OTC2, respectively).
Among them, five species such as Khao vang (Machilus bonii), Mo (Manglietia conifer), Gioi
xanh (Mangletia sp), Sai dat (Wedelia chinensis) and Rang rang (Ormosia pinnata) are in top
five species. Diversity of tree species in the study site is at medium level (represented by S, d,
H' and D indices)was showed in Biodiversity and Ecological Association of tree species in
natural forest . Ba Vi national park Ha Noi by Pham Van Dien (2016)[18]
12
Ecological association
In the study of tropical rain forest, many hypothesis have been proposed to explain the
coexistence of species. The Janzen-Connell hypothesis explained that additional plants far
from mother plant would avoid the effects of harmful organisms living around the mother
plant. Thus, species with similar habitat but different resistant level on various harmful
organisms would get the benefit to expand its range. Expanded from the Janzen-Connell
hypothesis, the species herd protection supposed that many different species living together
will limit the impact of harmful organisms. Therefore, the mutual relations can be maintained
even in the case of competition.
Neutral theory supposed that all individuals, regardless of species difference, are equal
in the process of reproduction, growth and death. Uriarte et al. (2004)[19] when studying the
rainforest in Barro Colorado Island, Panama has found the evidence supporting this theory.
However, Chave (2004)[20] suggested that this theory is true only in a limited number of
cases. Obviously not all species are ecologically equivalent. Niche theory hypothesized that
the combination of spatial and environmental changes will be reflected in the morphology,
physiology and characteristics of life stages of each species. In tropical rain forests, which
have high species diversity and low species density, interaction among species and with other
species is also more complex than other forest types.
The study of diversity and ecological relationships of tree species in natural forests has
always been considered a topical issue, with major implications for the conservation and
sustainable management of the few remaining natural forest ecosystems on Earth. At the same
time, the development of "close to nature" farming systems is seen as a “wise” solution to not
only obtain high economic efficiency but also to ensure the durability of those farming
systems ( Pham Xuan Hoan et al, 2011)[21].
“The results of the study
about biodiversity and ecological association of tree
speciesin actual forests , Ba Vi national park, Ha Noi - Pham Van Dien [18] showed that with
13
the similarity from 80% or greater, there are nine couples of tree species which have closely
relationship with each other, but there is no any couple of secondary plot which formed.
These are findings, which have ecological significance and open the new way for deeply
studying on forest ecosystem characteristics in general as well as on the special use forest
such as in Ba Vi national park in particular.
In the study - Spatial pattern and associations of tree species in tropical evergreen
broad-leaved forest a Luoi, Thua Thien Hue-Pham Van Dien, Nguyen Hong Hai [22] finded
suggest that dispersal limitation was the main process controlling intra-specific distribution
patterns. Inter-specific association could be affected by species herd protection. Neutral
interaction was minor part of species associations. Habitat heterogeneity plays an important
role for species distribution patterns, and the spatial segregation occurs at a scale around 15 m
in this forest. Ecological similarity also contributed to positive associations of tree species.
14
3. RESEARCH GOALS AND OBJECTIVES
3.1. Goals
The outputs and outcomes of the study are expected to contribute for the sustainable
management and ustilization of the forest and biodiversity resources of the Huong Son
Special Use Forest
3.2. Specific objectives
(i) To examine the species biodiversity and its patterns with quantitavite indices of tree
species in the Huong Son Special Use Forest (SUF) under different site disturbance impacts,
(ii) To study for determination of the ecological association of the tree species in the
Huong Son SUF under the study
(iii) To propose practical interventions and measures for the sustainable management
and utilization of the forests, landscapes and biodiversity resources of the Huong Son SUF.
3.3. Study site and scope
Huong Son Special-use forest locate on Huong Son commune, My Duc district, Hanoi.
geographical location : 23O29’ to 20O34’ North latitude and 1050 41’East longitude. the
northern abuts with Hung Tien and An Tien commune , the eastern is Ha Nam provice, the
west is Hoa Binh provice
Huong Son commune is a junction between the delta and mountain of Hoa Binh
province, the most of area belong to limestone mountains, exist of hill and low mountain
terrain with the highest peak is 381m. The division was created for the Huong Son Mountain
has diverse topography, majestic scenery . it's worth ecotourism and landscape more
interesting to attract tourists .
Topography of Huong Son is formed by two groups of factors including:
- Casto topographic : massif is mainly consists surface Casto and underground Casto
which creat caves such as Huong Tich, Tien Son, Hinh Bong, Long Van and so on
15
- Casto field interleaved: the field has a thick layer Casto, the local people took
advantage to agricultural cultivation and fruit growing.
Soil is formed and developed on the limestone mountain. The process of direct impact on
the surface is the process of erosion, landslides and sedimentation processes in the slot and valleys.
There are 3 kind of soil :
- Black humus soil on limestone
- Feralit soil develope on limestone
- Silt
Huong Son has been afected by tropical monsoon climate , the region has relatively
high temperatures. The average annual temperature is 23-30C. Average annual rainfall from
1800- to 2000 mm with the number of rainy days 140-150 days / year. The rainy season from
April to October reached 81-91% of the annual rainfall. The dry season from November to
March next year. Notably, the rainy season is concentrated in the June, July, August, it causes
erosion and landslides, which affect soil erosion when the vegetation destroyed. However in
Huong Son, although there are 2 distinctive seasons, due to the dry season is not too harsh to
create favorable conditions for the restoration and development of forest vegetation.
About the history of formation and development, Huong Son SUF was named in a list
of special-use forests in Vietnam under the Decision No. 194 / CT, dated 09.08.1986 of the
President of the Council of Ministers, the Cultural and Historical Huong Tich Pagoda zone
has an area of 500 ha (MARD, 1997)[23]. The objective of these SUFs is: "Protecting the
forest on limestone and famous landscapes of the region" (Sung 1994)[24]. Huong Son SUF
is a museum of life; there are mountains, lakes, caves, trees and wildlife. The main area is
4,355 hectares and the buffer zone is 1,191 hectares. There are 85 families, 577 genera, 873
species of flora in Huong Son SUF, of which 25 rare plant species are listed in the Red Book.
There are also 288 species of fauna belonging to 84 families, 26 genera, including 40 rare
animal species that have high economic value and there is a new species discovered in 2011.
16
Composition of insect of the Huong Son SUF is also very rich with 374 species on 65
Families, 13 genera. This is the great potential of the ecosystem for research, conservation and
sustainable development of eco-tourism, community tourism and sightseeing.
Huong Son SUF is a special forest ecosystem develope arid on limestone mountains in
which has a very low of humus. Huong Son forest is evergreen forest, tropical rainforest.
there are many valuable plants in the conservation of genetic resources in scientific research
and environmental landscape. Previously forest over exploited , currently with efforts of
management forest are being protected and tend to recover well.
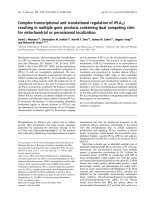
Figure 3.1. Map of Huong Son Special Use Forest with sites under the study (source:
Huy et al 2008, Cong 2013
17
4. METHODS
4.1. Establish the sampling plot
In each study site (6 sites) are selected with different level of impact, a set of 3
sampling plots (quadrats) was established for necessary data collection. The total sampling
plots are 18. The size of each sampling plot was 1,000 m2 (25 m x 40 m). The plots were
layed out in an uphill direction in 3 positions: a plot low on a hill, in the middle part of a hill
and high on a hill.
4.2. Data collection method
Basic data collection was shared from the research on “Biodiversity Inventory of
Huong Son Special Use Forest” done by Research Center for Forest Ecology and
Environment, Forest Science Institute of Vietnam, and the additional data collection from the
study sites was done recently in 2015.
In each sampling plot, we assessed the following variables:
(i) Name of all tree species occurring in the sampling plots; specimens of unidentified
plant species were collected for identification
(ii)
Number of individuals of each occurring tree species
(iii) Total height (H) and Diameter at breast height (DBH) or D10cm of each
individual stem with height ≥ 1 m
(iv) Canopy cover, degree of disturbance, topographic features
These data were used to calculate relative density, abundance and dominance of the
species; and from those values the Importance Value Indices (IV%) and Species diversity
indices were calculated.
4.3. Calculation method
- The factors structure and growth, such as: (density - N, trees / ha), average growth,
basal area was calculated according to the instructions in the forest inventory (Vu Tien Hinh,
Phạm Ngoc Giao, 2003)[25].
18
Applied the practical research methods by quantitative analysis of biodiversity in order
to determine the index : Shannon index (H) , Importance Value Index ( IV% ) . If the value of
the index is high, it means high diversity corresponds with high biological value . This
research method is necessary to create database for solution for conservation , policy and
planning sustainable use of biodiversity resources
To identify indicators of biodiversity of Huong Son SUF , using survey methods
according to plots. At each plots, measure and collect information on :
- Species composition ; determine the name of the trees
- The number of individuals for each species , diameter of each individual
- The important value of tree species (IV, %) is defined by the formula of Curtis, 1959,
according to Whittaker leads, R.H. 1975)[26][27].
(4-1)
Where:
- IV%: Important value index of tree species
- N%: Percentage of the number of tree species
- G%: Percentage of basal area of tree species
Basal area ( BA) = pi * ( DBH/2)2
- Identification of species diversity index, include:
Margalef (d)
(4-2)
Where :
d: Diversity indicator Margalef
S: total species in the plot
19
N: Total individual in the plot
Shannon - Wiener (H’)
(4-3)
Where :
H’: Indicator Shannon - Wiener
S: the number of species in the plot
Pi = ni / N
N: Total individual in the plot
ni: The number of individual of i specie
Simpson (L - Lambada)
(4-4)
Where :
D is Simpson index
P is the proportion (n/N) of individuals of one particular species found (n) divided by
the total number of individuals found (N)
S is the number of species.
4.4. Dominance Diversity curve (D-D) method
To analyze species dominance patterns and ascertain the resource apportionment
among the species at a site, Dominance Diversity curves (D-D) were developed wherein the
IVI was used as a measure of the niche of a species its and resource apportionment thus was
treated as an expression of the relative niche size. This is based on the assumption that there is
some correspondence between the share in community resources and community space
utilized by a species (Whittaker 1975, Pandey et al. 2002, Huy 2012)[27][8][15].
Niche space partitioning and resource sharing
20
We followed Naveh and Whittaker (1979), Verma (2000) and Pandey (2002)[28][3][8]
for the analysis of the vegetation stands in terms of two dominance pattern models, as follows:
- Geometric series: this kind of D-D curve is typical for sites where one species
highly dominates the site. This highly dominant species thus possesses a high IVI value and is
considered to occupy the top niche. It takes a large share to the available resources. The next
important species takes a similar proportion of the resources left by the first species, and so
on. This is the so-called niche preemption hypothesis (Whittaker 1975, Pandey et al.
2002)[27][8]. This kind of curve represents a geometric series with a very steep slope: the
dominant species is the most competitive, followed by the other species that are subsequently
proportionally less competitive and thus take proportionally less of the total resources.
Communities with this pattern usually have a low species diversity (Preston 1948, Naveh and
Whittaker 1979)[29][28]. This geometric series would also suggest that the vegetation of the
site is not stable, and often other species can invade the community (Pandey et al. 2002,Huy
2012).[8][15]
- Log-normal distribution: this kind of D-D curve occurs on sites where none of the
species possess high IVI values and none strongly dominates the site. Plant communities
showing a log-normal distribution, are thought to more equally share the resources in a
gradual ranking order from the most important species to the least important one. This lognormal distribution also suggests that at the site species are fairly equally competitive. Such
communities have high diversities, and the vegetation of the site is considered rather stable
(Verma 2000, Pandey et al. 2002, Huy 2012)[3][8][15].
4.5. Estimating the Site disturbance index (SDI) method
Conducing assess of Site Disturbance Index for study sites : Agriculture
encroachment, Invasive species , Tourism activities , Firewood and medicinal collection,
Logging and fires. Define level of site disturbance of factor Correspon: 0.30, 0.20, 0.20, 0.15
và 0.15 (table 1) according to
(Naveh and Whittaker 1979, Acharya 1999, Huy
2012)[28][30][15] .
21
Table 4.1. Site Disturbance Index - SDI
#
1
2
3
4
5
Factos affecting the study site
SDI
Agriculture encroachment
0.30
High
0.30
Medium
0.20
Low
0.10
Invasive species
0.20
High
0.20
Medium
0.10
Low
0.05
Tourism activities
0.20
High
0.20
Medium
0.10
Low
0.05
Firewood and medicinal collection
0.15
High
0.15
Medium
0.10
Low
0.05
Logging and fires
0.15
High
0.15
Medium
0.10
Low
0.05
Total
1.00
22
Site Disturbance Index (SDI) was assessed as follows: SDI >0,5 is high level of site
disturbance , 3 < SDI <=0,5 is medium level of site disturbance SDI <=0,3 is low of site
disturbance.
4.6. Data analysis method
- Using Excel for statistical calculation and analysis
- Ecological association between tree species in the communities was identified
through three tools: branching diagram (dendrogram cluster), graphs NMDS (non-metric
multidimentional scaling), graph PCA (principal component analysis - analysis the main
component area). These indicators are determined by the R software installed on computers
23
5. RESEARCH RESULT AND DISCUSSION
5.1. Important Value Index (IV%)
The results of Important Value Index (IV%) of 18 sampling plots are represented in
appendices from 1 to 6. List of species has Important Value Index (IV%) > 5% are shown in
table 5-1.
24
Table 5.1. Importan value index
BEN DAGIENG CHEN
Local
Name
Latinh Name
THUNG SAU
THUNG
RUNG VAI
HINH BONG
MANG
TUYET SON
1
2
3
4
5
6
7
8
9
10
11
12
13
14
15
16
17
18
1
Bời lời nhớt Litsea glutinosa
-
-
-
5.2
-
-
-
-
-
-
-
-
19.0
-
-
-
-
-
2
Bứa
Garcinia oblongifolia
-
-
5.3
-
-
-
-
-
-
-
-
-
-
-
-
-
-
-
3
Bưởi
Citrus grandis
-
-
-
-
15.5
-
-
11.5
-
-
-
-
-
-
6.3
-
-
-
-
-
-
-
-
-
6.1
-
-
9.1
-
-
18.2
tonkinersis
-
-
-
-
6.7
-
-
-
-
-
-
-
-
-
-
-
-
-
4
5
Bương
Chay rừng
Sinocalamus
flagellifera
14.7 18.3 32.4 15.6
Artocarpus
6
Đa rừng
Ficus vasculora
-
-
-
-
-
-
9.2
-
-
-
24.1
-
-
-
-
-
-
-
7
Đại
Plumeria rubra
-
-
12.0
-
-
-
-
-
-
-
-
-
-
-
-
-
-
-
8
Dâu gia
Baccaurea harmandii
-
-
-
-
14.9
-
-
-
-
-
-
-
-
-
-
-
-
-
-
6.5
-
-
-
9
Dò vàng
Streblus
macrophyllus
10 Gạo
Bombax malabarica
11 Gốm
sp
12
Rhapis
Hèo
13 Hồng bì
13.5 16.7 20.3 19.3 29.6 15.5 14.2 18.2 15.9 25.7 13.7 24.2 10.8
-
-
-
-
-
47.4 15.3
6.3
-
-
-
-
8.7
-
12.8 38.1 27.5
-
5.8
-
-
5.4
-
-
-
-
-
-
-
-
7.3
-
7.4
-
8.1
-
cochinchinensis
-
-
-
-
-
-
-
-
-
-
7.1
-
-
-
16.0
-
-
-
Clausena lansium
-
-
-
-
-
-
12.8
-
-
-
-
-
-
-
-
-
11.2
25