Characteristics of mangrove forests in nam phu commune tien hai district thai binh province
Bạn đang xem bản rút gọn của tài liệu. Xem và tải ngay bản đầy đủ của tài liệu tại đây (1.14 MB, 80 trang )
MINISTRY OF AGRICULTURE AND RURAL DEVELOPMENT
VIETNAM NATIONAL UNIVERSITY OF FORESTRY
***
STUDENT THESIS
CHARACTERISTICS OF MANGROVE FORESTS IN NAM PHU
COMMUNE, TIEN HAI DISTRICT, THAI BINH PROVINCE
Major: Natural Resources Management
Code: D850101
FAculty: Forest Resources and Environmental Management
Student: Vu Thanh Thao
Student ID: 1453091299
Class: K59B Natural Resources Management
Course: 2014 - 2018
Advanced Education Program
Developed in collaboration with Colorado State University, USA
Supervisor: Dr. Ha Quang Anh
Hanoi, 2018
ABSTRACT
Mangrove forests in Nam Phu commune belong to zone II which play an important
role for protecting coastal area. From this results, mangrove soil in Nam Phu commune is
soft clay and the highest flood tide is 1.7 m in survey transect 1 which is located near the
estuary of Tra Ly river. Besides, there isn’t a difference of growth of mangrove species in
each plot of three transects in terms of mean height and mean DBH. However, regarding
the H-D correlation of mangrove species in each transect, they have a srong relationship.
There are three dominent species in study site having form Clumped distribution
including Kandelia candel (Kc), Aegiceras corniculatum (Ac), and Sonneratia caseolaris
(Sc). They also represent with difference layers in each trip of three transects. In addition,
there is a significant difference about the percentage of canopy cover in each trip basing on
canopy area of mangrove species in each cross profile of three transects.Moreover, there is
also a sediment accummulation in each transect. Although, mangrove forests in Nam Phu
commune have lots of strengths and opportunities, they still exist some weaknesses,
especially some threats that impa r ct on sustainable mangrove forest management. By this
reason, we need to have some solutions to protect and manage sustainable mangrove
forests in Nam Phu commune.
Key words: mangrove; structure; threats, sustainable management.
i
TABLE OF CONTENT
ABSTRACT............................................................................................................................ i
TABLE OF CONTENT .........................................................................................................ii
ABBREVIATION ................................................................................................................ iv
LIST OF TABLES ................................................................................................................. v
LIST OF FIGURES .............................................................................................................. vi
CHAPTER I. INTRODUCTION ........................................................................................... 1
1.1. Mangrove forests in the world. ....................................................................................... 1
1.2. Mangrove forests in Vietnam. ........................................................................................ 1
CHAPTER II. GOAL, CONTENTS, STUDY SITE AND METHODOLOGY ................... 5
2.1. GOALS. .......................................................................................................................... 5
2.2. CONTENTS.................................................................................................................... 5
2.3. GEOGRAPHICAL LOCATION, TOPOGRAPHY ....................................................... 5
2.3.1. Climate ......................................................................................................................... 7
2.3.2. Biodiversity .................................................................................................................. 9
2.4. Methodology ................................................................................................................... 9
2.4.1. Data collection method ................................................................................................ 9
2.4.2. Data analysis methods ............................................................................................... 14
2.4.3. Data analysis methods ............................................................................................... 19
CHAPTER III. RESULTS AND DISCUSSION ................................................................. 22
3.1. Characteristics of mangrove forests in the Nam Phu commune, Tien Hai district, Thai
Binh province. ...................................................................................................................... 22
3.1.1. Site characteristics ..................................................................................................... 22
3.1.2. Growth characteristics ............................................................................................... 22
3.1.3. Species composition .................................................................................................. 34
3.1.4. Canopy cover ............................................................................................................. 38
3.1.5. Distribution characteristics ........................................................................................ 42
ii
3.2. Sediment Accummulation............................................................................................. 43
3.3. Some main threats that influence to mangrove forests in Nam Phu commune. .......... 45
3.4. Propose appropriate solutions for sustainable mangrove management in Nam Phu
commune, Tien Hai district, Thai Binh province. ............................................................... 49
CHAPTER IV. GENERAL CONCLUSION, LIMITATIONS AND FURTHER STUDY 50
4.1. General conclusion ....................................................................................................... 50
4.2. Limitations and further study ........................................................................................ 50
REFERENCES ...................................................................................................................... 1
APPENDIX ............................................................................................................................ 4
iii
ABBREVIATION
DBH
Diameter at Breast Height
Hvn
The Height of Tree
Hdc
The Height Under Branches
Dcanopy
Diameter of Canopy
SWOT
Strength, Weakness, Opportunity, Threat
GPS
Global Positioning System
iv
LIST OF TABLES
Table 3.1: Site characteristics in each transect .................................................................... 16
Table 3.2: Measurement of trees.......................................................................................... 17
Table 3.3: Measurement of canopy cover ............................................................................ 18
Table 3.4: SWOT analysis ................................................................................................... 21
Table 4.1: Site characteristics in Nam Phu commune ......................................................... 22
Table 4.2: Statistic of height in three survey transects ........................................................ 23
Table 4.3: Statistic of DBH in three survey transects .......................................................... 28
Table 4.4. Tree density of mangrove communities in Nam Phu commune......................... 33
Table 4.5. Composition of mangrove species follows to plots in each transect .................. 34
Table 4.6: Appearance frequence of mangrove species in 3 transects ................................ 35
Table 4.7: Mangrove plant communities in 3 transects ....................................................... 35
Table 4.8. Measurement of canopy cover ............................................................................ 40
Table 4.9. Distribution characteristics of mangrove species in Nam Phu commune .......... 42
Table 4.10. Three-weekly sedment trap thickness data obtained with sequential sediment
traps in each plot. ................................................................................................................. 43
v
LIST OF FIGURES
Figure 3.1: Geographic location in Nam Phu commune, Tien Hai district, Thai Binh
province............................................................................................................... 6
Figure 3.2: Mangrove forests distribution in Nam Phu commune, Tien Hai district, Thai
Binh province in 2018 ......................................................................................... 7
Figure 4.1: Height distribution in 3 plots of transect 1 ........................................................ 23
Figure 4.2: Vertical profile in transect 1 .............................................................................. 25
Figure 4.3: Height distribution in 3 plots of transect 2 ........................................................ 25
Figure 4.4: Vertical profile in transect 2 .............................................................................. 26
Figure 4.5: Height distribution in 3 plots of transect 3 ........................................................ 27
Figure 4.6: Vertical profile in transect 3 .............................................................................. 28
Figure 4.7: DBH distribution in 3 plots of transect 1 .......................................................... 29
Figure 4.8: DBH distribution in 3 plots of transect 2 ......................................................... 30
Figure 4.9: DBH distribution in 3 plots of transect 3 ......................................................... 31
Figure 4.10: Cross profile in transect 1................................................................................ 39
Figure 4.11: Cross profile in transect 2................................................................................ 39
Figure 4.12: Cross profile in transect 3................................................................................ 40
Fig 4.13. Three-weekly sediment trap volume data obtained with sequential
sediment traps. ................................................................................................ 44
Figure 4.14: Percentage of human Activities related to mangrove forest ........................... 47
vi
CHAPTER I. INTRODUCTION
Mangroves are a group of trees and shrubs that live in the coastal intertidal zone
(NOAA). The word “mangrove” has been used to refer either to the constituent plants of
tropical intertidal forest communities to the community itself (Kasawani, 2007).
Mangroves appear in tems of woody plants that distribute on the interfAce between land
and sea in tropical and sub-tropical latitudes. Mangroves trees therefore grow in soil that is
more or less permanently water-logged and in water those salinity fluctuates and may be as
high as that of open sea.
1.1 . Mangrove forests in the world.
Mangrove forests distribute mainly on the equator and 2 sides tropical hemisphere. The
limit of mangrove trees in South is New Zealand (38o03’South latitude) and the South of
Australia (38o43’South latitude).
Basing on analyzing the data from NASA's Landsat satellite imagery system, the
scientists estimate that mangrove remains survival Accounting for 12.3% of the Earth's
surfAce area (approximately 137,760 km²) and distributed in 123 countries around the
world ( Tamnhin.net, 2010). Of which about 42% of mangroves in the world found in
Asia, in Africa with 21%, 15% in the North and Central America, 12% in Oceania and
South America with 11%.
The distribution of mangrove forests in the world are divided two main regions : IndiaPAcific areas (Southern Japan, Southeast Asia, India, the Red Sea coast, East Africa,
Australia, New Zealand, the South PAcific Island, and Xamoa archipelago) and West
Africa-Americas areas (covering the coast of Africa in the Atlantic Ocean, the Galapagos
Islands, and the Americas)
1.2 . Mangrove forests in Vietnam.
Mangroves located primarily in southern Viet Nam (Mekong Delta and Ca Mau
Province).
1
Vietnam is located in tropical climate with advantages for mangrove forest
development.In 1943, there are 408,500 ha of mangrove forest areas in Vietnam, but this
area decreases to 270.000 ha in 2015 due to many different reasons such as war, mining,
and unsustainable management of mangrove forests. At present, our country has an area of
155,920 ha of mangroves and the area is still on the decline (Mai Sy Tuan and MFF
Vietnam NCB, 2016).
In Viet Nam and other countries on the world, there are many articles and
researches about mangrove forest, especially reAcarches of Phan Nguyen Hong about
mangrove forest. His researches helps him become one of the leading doctor in research of
mangrove forest in Viet Nam. The number of mangrove species in Southern of Viet Nam is
100 species, there are 69 mangrove species in Central of Viet Nam and 52 mangrove
species in Northern of Viet Nam. The distribution of mangrove species is different in these
location because there are a significant difference of climate condition, geographic features
and hydrology (Phan Nguyen Hong, 1999). Based on geographical fActors, fieldwork and
part of results Remote Sensing, P.N.Hong (1991, 1993) were divided into 4 Vietnam
mangrove areas and 12 sub-zones:
Zone I: Northeast in the Coastal, from Mui Ngoc to Do Son.
Zone II: North Delta in the Coastal, from Do Son to LAch Truong.
Zone III: Central Vietnam in the Coastal, from LAch Truong to Vung Tau.
Zone IV: Southern in the Coastal, from Vung Tau to Mui Nai - Ha Tien.
Zone I: Mangroves grown by the outer shielding island, the species mainly
Rhizophora
stylosa,
Kandelia
obovata,
Bruguiera
gymnorrhiza
(L),
Aegiceras
corniculatum (L) Blanco, Avicennia marina. Due to the air temperature in the winter cold,
so the tree is small in size, only a height of about 1.5 to 7 m.
Zone II: Despite the extensive alluvial, alluvial-rich, but here empty beach, no
shielding storm islands, only a few mangrove estuaries in the main tree species such as
2
Sonneratia L. , Kandelia obovata, Aegiceras corniculatum (L) Blanco, AcanthAceAc.
Sonneratia L. relatively large size.
Zone III: Mudflats narrow, less silt coast by steep, windy storm, forests of
narrow strip just inside the estuary. The trees are mostly plants: RhizophorAcAca,
Bruguiera gymnorrhiza (L.), Aegiceras corniculatum (L.) Blanco, Avicennia marina, often
small trees, the branches more.
Zone IV: There are extensive mudflats, numerous sediment by the Dong Nai river
system and the Mekong River system provides less wind storm so well developed
mangroves, especially Ca Mau peninsula. The forest has many species of trees, with a high
diversity and large size.
According to this division, mangrove forests in Nam Phu commune, Tien Hai
District, Thai Binh Province belong to zone II. So, mangrove forests in here bring many
common characteristics of this region but they still exist some peculiarities of the terrain
leading to the difference of mangrove forest structure which will be outtransectd in the
next part. Nam Phu is a commune located in the southern part of Tien Hai district, Thai
Binh province. It is one of three communes of Tien Hai Nature Reserve (Nam Hung, Nam
Phu and Nam Thinh). In Nam Phu commune, there is a large sand dune called Con Vanh
with an area of 1,696 ha and a beach stretching for about 6 km. Canh Vanh has about 700
ha of mangroves, 56ha of casuarina forest. And in the mangrove ecosystem is quite rich
with many species of plants, over 200 species of valuable seafood and many rare bird
species. The terrain is relatively flat, with an average elevation of 0.5-0.75 m above sea
level (Nguyen Thi Hong Hanh, 2015). This is one of the localities with favorable
geographic conditions and favorable terrains for mangroves and agricultural plants to grow
and develop (thaibinh.gov.vn).
The tidal regime is the diurnal tide. The lowest tide level can be down to 0.1 m; The
highest is 3.9 m. The average temperature is 23.5oC. Average rainfall is between 1,700 and
3
2,200 mm / year, with maximum rainfall in July and August (average 275-318 mm /
month), minimum rainfall in January (average 9 mm / month). Average humidity in the
year was 85.5%. The forest planted here may be clay and clay and fine sand (Nguyen Thi
Hong Hanh, 2015). The area of mangrove plantation in Nam Phu Commune is 581
hectares by 2011, of which 150 hectares are planted with S. caseolaris. 150 ha of pure
plantation species of K. obovata; 210 ha of K. obovata and S. caseolaris mixed forest
plantations and 71 ha of mixed forest plantation species such as mangrove (Rhirophora
apiculata), Avicenniamarina, Kandelia obovata, Sonneratia caseolaris, ... (Nguyen Thi
Hong Hanh, 2015). By these situations, mangrove forests in Nam Phu commune should be
protected and developed more and more. In order to plant, protect and develop mangrove
forest effectively, the basic knowledge about structural characteristics including species
composition, distribution, layer and site charateristics is very necessary and important.
Although there have been many studying documents and researches about mangrove
forest but Nam Phu commune, it still lacks several research projects in species
composition, distribution, site and layer characteristics. Stemming from this idea, I carry
out the research: "CHARACTERISTICS OF MANGROVE FORESTS IN NAM PHU
COMMUNE, TIEN HAI DISTRICT, THAI BINH PROVINCE".
4
CHAPTER II. GOAL, CONTENTS, STUDY SITE AND METHODOLOGY
2.1. GOALS.
Identifying the structural characteristics of mangrove forests in study area in order
to propose appropriate solutions for sustainable forest management.
2.2. CONTENTS.
Figure out some structure characteristics of mangrove forests in Nam Phu
Commune, Tien Hai district, Thai Binh province.
Evaluate some main threats that influence to sustainable mangrove forests
management purpose in Nam Phu Commune, Tien Hai district, Thai Binh province.
Evaluating the sediment Accumulation ability of mangroves.
Propose appropriate solutions for sustainable mangrove management in study area.
2.3. GEOGRAPHICAL LOCATION, TOPOGRAPHY
Nam Phu is a commune located in the southern part of Tien Hai district, Thai Binh
province. It is one of three communes of Tien Hai Nature Reserve (Nam Hung, Nam Phu
and Nam Thinh). In Nam Phu commune, there is a large sand dune called Con Vanh with
an area of 1,696 ha and a beach stretching for about 6 km. Con Vanh has about 700 ha of
mangroves, 56ha of casuarina forest. And in the mangrove ecosystem is quite rich with
many species of plants, over 200 species of valuable seafood and many rare bird species.
Geographic coordinates :
20º 17 ' - 20º 28' north latitude
106º27 ' - 106º 35' east longitude
The East borders with sea.
The West borders with PAM dyke.
The South borders with Ba Lat estuary.
The North borders with Nam Hung and Nam Thinh Commune.
5
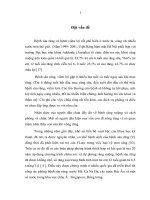
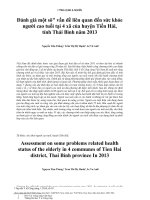
Figure 23.1: Geographic location in Nam Phu commune, Tien Hai district,
Thai Binh province
The terrain of Nam Phu is relatively flat, with an average elevation of 0.5-0.75 m
above sea level (Nguyen Thi Hong Hanh, 2015). This is one of the localities with
6
favorable geographic conditions and favorable terrains for mangroves and agricultural
plants to grow and develop (thaibinh.gov.vn).
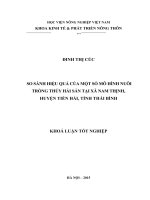
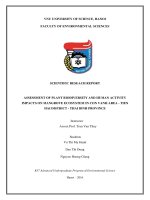
In Nam Phu commune, there are 1776.32
hectares of silvicuture land area
including 237.99 hectares of mangrove forest, 64.36 hectares of casuarina forest.
Figure 2.2: Mangrove forests distribution in Nam Phu commune, Tien Hai district,
Thai Binh province in 2018
2.3.1. Climate
Nam Phu is located in the sub-tropical climate. It is hot and humid in summers,
cold and dry in winters. The rainy time is from June to September,the cold time is from
7
November last year until January next year. The others are fall and spring but not markedly
like countries lying on the tropical belt.
Nam Phu commune has climatic characteristic of the Northern Delta so these
conditions are very favourable in terms of agriculture, fishing and aquAculture. Besides,
they also support the growth of mangrove ecosystem. However, they still have some
disadvantages when the temperature goes down sharply in the winter and salinization
drops in case of rainy season.
Temperature regime
The annual average temperature of region is from 18oC to 25oC, the highest
temperature is 38oC.
Wind regime
In summer, the main wind direction is southeast wind, and the average wind speed
from 2 to 5m per second. This time often has storms from June to October, mostly is
August. Each year has from 4 to 6 storms, the average wind force from 8 to 11, causing
major damage to productive Activities and people's life.
Rain regime, humidity
The average annual rainfall is from 1500 to 2000mm and mostly in summer. The
rainfall Accounts for 80% of annual rainfall. In summer, the highest rainfall can reach from
200 to 350 mm per day. The dry season lasts from October to March with a total rainfall
about 20% of the annual rainfall. The air humidity fluctuates from 82 to 90%.
Tide regime
Mangrove forests are located in the middle tide and low tide of the commune, under
the influence of tidal flooding is diurnal tide, the time exposes to the beach as well as
forests in the range from 7 to 8 hours per day.
Soil condition
Soil in Nam Phu commune is mainly sandy, covered with organic humus as a
result of decomposing the leaves of vegetation on a daily basis. This condition has an
8
advantage for animals living in the forest ecosystem, especially molluscs such as snails,
oysters and clams.
Water quality
Water
2.3.2. Biodiversity
The mangrove forest natural area at Nam Phu commune, Tien Hai district, Thai
Binh province is almost the natural forests. The diversity of species compositions is quite
high; the plant communities at natural forests showed the most development with Trang
(Kandelia obovata) - O ro (Acanthus ebrateatus) and Co ngan (Scirpus kimsonensis) - Co
cay (Sporobolus virgicicus). In the reservoirs of aquAculture, the mangrove flora
developed towards the degenerated successions with 11 species of two plant assemblages
of Trang - Su (Acgiceras cornicudatum) and O ro - Say (Phragmites karka); or only
included one assemblage as Trang - Ban (Sonneratia caseolaris) combined with 8 species
in a mixed plantations of Trang and Ban; or Trang combined with three other species on
the mono plantation of Trang on the alluvial ground (Doan Dinh Tam, 2013)
Aquatic species are concentrated in mangrove forest as a nursery for breeding of aquatic
species in terms of nurseries for marine life with diverse species such as grouper, shrimp,
crabs, oysters, clams ,ect.. In addition, mangrove forest are also a habitat for water birds
such as storks, cauldrons and many rare species.
2.4. Methodology
2.4.1. Data collection method
Secondary data collection
- Collecting data on natural and socio-economic conditions in study areas
- Data of mangrove forest area, biodiversity
9
- Collecting relevant documents, policies, management and protection of forest
resources in the study area, the projects on forest planning ...
Primary data collection
Choosing three typical locations to carry out an investigation corresponding with three
transects. These location represents the different characteristics of plant communities and
thickness of mangrove forest. It is noticable that each transect is perpendicular with the sea
dike (from the dike to sea). We establish three transects in research process. With each
transect, a three-typical location was established (Plot 01; Plot 02; Plot 03) with orientation from
dike to sea and 5 meters lengh of distance between each.
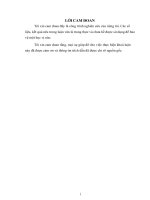
Figure 2.3. Transect in mangrove forests in Nam Phu commune
1
2
3
Each plot has an area with 100 m2 (10m x 10m). The plots are established by tape and right
angle. Boundaries of plot are defined by 4 wood stakes at 4 corner of each plot and then we
stretched a cord around 4 stakes to recognize each plot. After that, using three long poles which
are equally distant at 2.5m in each plot to measure flood tide and then taking average value of
three measurement in these locations.
10
After establish plots, we record the data in three plots, some basic data are collected from
plot, including:
Measurment of tree:
- Height: in meter. Height is measured by using a long pole with graduation of 1m.
- DBH: in centimeter. DBH is measured by using Caliper, or measure tape then
divide by 3.14, measurement of all wood trees having D1.3 ≥ 3cm.
Figure 2.4: Establishment of plot in each transect
- Dcanopy: in meter. Dcanopy is measured by using a long pole with graduation of 10cm
or a transectar tape.Dcanopy is measured twice with two perpendicular directions. Then take
the average from two measurements.
Profile diagram
Each transect chooses one typical forest strip to draw. Area’s strip is 10m x 25m
(25m is length of plot paralleling seaside and 10m is depth). Profile diagram is drawn
based on method of Richards P.W and Davis T.A.W (1933- 1934).
Profile diagram is drawn on paper; it is conducted with measuring trees and drawn
one by one.
11
Standing profile: draw the near trees first and the far trees after, the trees in front are
drawn solid transects and the trees in behind are drawn disjointed transects.
Cross profile: draw tree canopy on all plot area, the highest trees are drawn solid
transects and shorter trees are drawn disjointed transects.
To draw profile diagram, we need to measure tree index as trees height, trees canopy
in 2 directions (South North- East West), coordinate trees (distance between stumps with 2
sides of plot) and shape of trees. Name of trees drawn on profile diagram should be noted
on tree canopy (note if name of trees abbreviate).
- Canopy cover: use cross profile in each transect to calculate area two types of
canopy including area of relative canopy and area of absolute canopy. Area of relative
canopy is calculated by the area of canopy without interception parts. Area of absolute
canopy is calculate by the area of canopy including interception parts. So, area of
interception canopy in cross profile equals area of absolute canopy minus area of relative
canopy. Percentage of canopy cover equals the area of relative canopy divided by the area
of cross profile.
- Flood tide is measured by using some long poles with graduation 0.5m with three
locations in each plot of three transects and then taking average height.
- Mangrove soil is defined through the sink depth of feet when walking on
mangrove soil. There are five features which are used to represent for one, followed by
Ministry of Agriculture & Rural Development in 2016 including:
+ Watery mud : when feet are sunk deeply at just above 40 cm
+ Soft mud: when feet are sunk deeply from 30 cm to 40 cm
+ Close mud: when feet are sunk deeply from 15 cm to 30 cm
+ Soft clay: when feet are sunk deeply from 5 cm to 15 cm
+ Stiff clay: when feet are sunk deeply at just below 5 cm
Site characteristics
12
Salinity: Salinity was measured by Electrical Conductivity.
Solutes have either a positive charge (+) or negative charge (–). Salinity can
therefore be measured by how well the solution conducts an electrical current. If the
solution contains more dissolved salt it will conduct a stronger current which leads to a
higher reading.
We using a handheld salinity meter (refrActometer). First, open the cover, rinse the
head (the sensor) with water sample to remove remaining water trapped inside it. Then, dip
it into the sea water, wait until the number is stable and record the result.
Sediment Accummulation: Use sediment trap method
- Using a sediment trap, which have a square flat horizontal plane (1m×1m) stuck
with a stake at the bottom to keep the trap stable.
Figure 2.5.Sediment trap
- Put it in sea dike (make sure the trap was moored to the bottom). After several
day to months, the trap is retrieved. First, we measure the thickeness of sediment on the
trap (the sediment on the square plane’s fAce) to cAculate the volume of sediment. After
that, we collect the sediment, let it dry and weighed to cAculat the mass of sediment.
Take photograph and collect necessary specimens in investigation process
13
Interview method, surveys officers, local people and students
To assess the impActs of local people on the mangrove forest, we use interview
methods, interviewed by the questionnaire for 50 local people including households,
farmer, fisher and 50 students in the study area to evaluate the knowledge about mangrove
forests, exploitation and use of natural resources in the local as well as the development
orientation using questionnaire for officers to know about the status of management,
method to investigate mangrove forest.
In addition, we also investigate, collect on the number and severity of exploitation
of natural resources, ecological characteristics and distribution of some mangrove species
from officers, local people and student in study site
The policies and projects from government and national organizations in terms of
restoration and protection of mangrove forest are collected by interview of officers and
local people.
2.4.2. Data analysis methods
Identify composition coefficient of species in plot by following formula:
With:
K is coefficient composition
n is the number of individual species in the study area
N is total individual species in communities
Identify density:
With:
D: density per hectare
n: number of trees in plot
S: area of plot, in this case equal 10*10 = 100m²
Frequency (%)
14
=
x 100
Abundance
=
The rate (A/F) between abundance and frequency of each species used to identify
spatial pattern distribution of this species in plant community (Whitford, 1949)
If A/F < 0.025, species has regular pattern, strong competition
If 0.025< A/F < 0.05, species has random pattern, suffer from unstable living
environment
If A/F > 0.05, species has Clumped pattern, occur in stable location
Using Descriptive statistic to analyze information about height, DBH, and Dcanopy.
Using Regression to identify relationship between height and DBH. Using
Histogram to identify frequency distribution bases on Height and DBH.
Using SWOT to analyze sustainable development purpose: Combining the result
from interviewing key managers/ official of local government, local people and students
give out the opportunity (O), Threat (T), Strength (S) and the Weakness (W) of mangrove
forest and then give out the solutions for better management.
15
Sample 01: Data collection survey
Transect: ………….
Plot ID: …………………
No. of data collection plot: ......……...
Surveyor:……………
Forest type:………………………..
Location:
X: ………
Forest status:……………..
Y: ………
Table 2.1: Site characteristics in each transect
Transect
Plot
Flood Tide
Sink Depth (cm)
Mangrove Soil
(m )
Flood tide is measured by using some long poles with graduation 0.5m with
three locations in each plot of three transects and then taking average height.
Height is measured by using some long poles with graduation 1m
Mangrove soil is defined through the sink depth of feet when walking on
mangrove soil. There are five features which are used to represent for one, followed by
Ministry of Agriculture & Rural Development in 2016 including:
+ Watery mud : when feet are sunk deeply at just above 40 cm
+ Soft mud: when feet are sunk deeply from 30 cm to 40 cm
+ Close mud: when feet are sunk deeply from 15 cm to 30 cm
+ Soft clay: when feet are sunk deeply from 5 cm to 15 cm
+ Stiff clay: when feet are sunk deeply at just below 5 cm
16
Sample 02: Data collection survey
Transect: ………….
Plot ID: …………………
No. Of data collection plot: ......……...
Surveyor:……………
Forest type:………………………..
Location:
X: ………
Forest status:……………..
Y: ………
No.
Name
D1.3
D Canopy
Hvn
Hdc
Note
Table 2.2: Measurement of trees
Height: in meter. Height is measured by using a long pole with graduation of 1m.
DBH: in centimeter. DBH is measured by using Caliper, or measure tape then
divide by 3.14, measurement of all wood trees having D1.3 ≥ 3cm.
Dcanopy: in meter. Dcanopy is measured by using a long pole with graduation of 10cm
or a transectar tape.Dcanopy is measured twice with two perpendicular directions. Then take
the average from two measurements.
Profile diagram
Each transect chooses one typical forest strip to draw. Area’s strip is 10m x 25m
(25m is length of plot paralleling seaside and 10m is depth). Profile diagram is drawn
based on method of Richards P.W and Davis T.A.W (1933- 1934).
Profile diagram is drawn on paper; it is conducted with measuring trees and drawn
one by one.
Standing profile: draw the near trees first and the far trees after, the trees in front are
drawn solid transects and the trees in behind are drawn disjointed transects.
17
Cross profile: draw tree canopy on all plot area, the highest trees are drawn solid
transects and shorter trees are drawn disjointed transects.
To draw profile diagram, we need to measure tree index as trees height, trees canopy
in 2 directions (South North- East West), coordinate trees (distance between stumps with 2
sides of plot) and shape of trees. Name of trees drawn on profile diagram should be noted
on tree canopy (note if name of trees abbreviate).
Canopy cover: use cross profile in each transect to calculate area two types of
canopy including area of relative canopy and area of absolute canopy. Area of relative
canopy is calculated by the area of canopy without interception parts. Area of absolute
canopy is calculate by the area of canopy including interception parts. So, area of
interception canopy in cross profile equals area of absolute canopy minus area of relative
canopy. Percentage of canopy cover equals the area of relative canopy divided by the area
of cross profile.
Sample 03: Data collection survey
Transect: ………….
Trip: ......……...
Mangrove community: ......……...
Surveyor:……………
Table 2.3: Measurement of canopy cover
Transect
Trip
Area
of trip
(cm2)
Area of
relative
canopy
(cm2)
Area of
absolute
canopy
(cm2)
Area of
interception
canopy
(cm2)
Relative
percentage
of canopy
cover (%)
Absolute
percentage
of canopy
cover (%)
Take photograph and collect necessary specimens in investigation process in order
to analysize and assess scientific name.
18