Applying multiple linear regression for predicting land price in tien du district bac ninh province viet nam
Bạn đang xem bản rút gọn của tài liệu. Xem và tải ngay bản đầy đủ của tài liệu tại đây (741.85 KB, 57 trang )
ABSTRACT
The real estate appraisal or land pricing has an increasing importance due to strong
growth of the real estate market in Vietnam in the last years. In that respect, a permanent
preoccupation for specialists is to find newer and better methods to evaluate the real estates.
In the international practice, using new approach of appraisal methods is statistical and
econometric models. The main aim of the paper is to establish and propose an applied
multiple linear regression model based on the factors can affect the price of land in Tien Du
District. The study areas covered by the statistical appraisal are selected from geographical
localities, categories or subjects to property taxes.
Key words: real estate appraisal, land pricing, multiple linear regression model
0
ACKNOWLEDGEMENT
After an intensive period of three months, today is the day: writing this note of thanks
is the finishing touch on my thesis to the people who have supported and helped me so much
throughout this period.
I would first like to show my gratitude to respected supervisor Dr. Le Dinh Hai from
Faculty of Economics and Business Management, Vietnam National University of Forestry
for his continuous support, patient guidance and enthusiastic encouragement during this
research.
I want to thank you for Prof. Dr. Lee McDonald, Department of Ecosystem Science
and Sustainability, Colorado State University for his valuable and constructive suggestions
during the planting of this research work.
In addition, I would love to thank various people for their contribution to this project;
Special thanks to local people in Tien Du district for providing me helpful information in this
study.
Finally, I own my gratefully thank to my parents, my friends for their wise counsel and
sympathetic ear. You always there for me.
1
TABLE OF CONTENT
ABSTRACT
ACKNOWLEDGEMENT
LIST OF FIGURES
LIST OF TABLES
CHAPTER 1. INTRODUCTION.............................................................................................. 1
CHAPTER 2. STUDY GOALS AND OBJECTIVES .............................................................. 4
2.1 Goal ...................................................................................................................................... 4
2.2 Specific Objectives ............................................................................................................... 4
CHAPTER 3. STUDY AREA AND RESEARCH METHODOLOGY .................................... 5
3.1. Study area ............................................................................................................................ 5
3.1.1. Bac Ninh Province............................................................................................................ 5
3.1.2 Tien Du District ................................................................................................................. 7
3.2. Research methodology ........................................................................................................ 9
3.2.1. The theory of hedonic and multiple linear regression method ....................................... 10
3.2.2. Framework of factors influencing factors the price of land in market ........................... 12
3.2.3. Data collection method:.................................................................................................. 15
3.2.4. Data analysis method: .................................................................................................... 16
CHAPTER 4: RESULT............................................................................................................ 21
4.1. Preparation data ................................................................................................................. 21
4.1.1. Editing ............................................................................................................................ 21
4.1.2. Coding ............................................................................................................................ 21
4.2. Description data ................................................................................................................. 22
4.2.1. Descriptive statistic quantitative variables on surveyed in Tien Du District ................. 22
4.2.2. Descriptive statistic qualitative variables on land price survey in Tien Du District ...... 22
2
4.3. Evaluating model ............................................................................................................... 24
4.3.1 Basing on the R- square statistic to evaluate the suitability of model ............................. 26
4.3.2 Analyzing ANOVA variance to evaluate the extinction of model. ................................. 28
4.4. Correlations analysis ......................................................................................................... 28
4.5. Independent sample test (F-test/ Levene’s test) ................................................................ 23
4.6. The result of Linear Multiple Regression.......................................................................... 32
4.6.1 Evaluating the independent of variables………………………………………………31
4.6.2 Checking the defect of model………………………………………………………….32
4.6.3 The contribution of independent variables into model…………………………………32
4.6.4 Evaluating marginal influence………………………………………………………….33
CHAPTER 5: DISCUSSION ................................................................................................... 35
5.1. The evaluating the reality of regression ............................................................................ 35
5.2. The solutions for achieving applying multiple linear regression in Tien Du district ........ 36
5.2.1. Solution based on building land pricing system ............................................................. 36
5.2.2. Solution based on building data source .......................................................................... 36
5.2.3. Solution based on knowledge on multiple linear regression model on land pricing of
appraisers. ................................................................................................................................. 37
CHAPTER 6: CONCLUSION
CHAPTER 7: REFERENCES
CHAPTER 8: APPENDICES
3
LIST OF FIGURES
Figure 3.1. The map of Bac Ninh province ................................................................................ 6
Figure 3.2. The map of Tien Du District, Bac Ninh province .................................................... 8
Figure 3.3. Research framework ................................................................................................ 9
Figure 3.4: Factors influences the price of land ....................................................................... 13
Figure 4.1 Regression standardized residual………………………………………………….31
Figure 4.2 Normal P-P plot…………………………………………………………………...31
Figure 4.3 Scatterplot…………………………………………………………………………32
4
LIST OF TABLES
Table 3.1: Sampling design in Tien Du district........................................................................ 15
Table 4.1: Codebook of questionnaire items ............................................................................ 21
Table 4.2: Description of quantitative variables ...................................................................... 22
Table 4.3. Description of qualitative variables......................................................................... 22
Table 4.4 Multiple linear regression Model summary output .................................................. 24
Table 4.5. Multiple linear regression ANOVA output ............................................................................ 27
Table 4.6. Correlation between factors and land price ............................................................. 27
Table 4.7. Result of independent Samples Test for the social infrastructure affects to land
price .......................................................................................................................................... 28
Table 4.8. Result of independent Samples Test for the location affects to land price ............. 29
Table 4.9. Result of independent Sample Test for the security affects to land price ............... 23
Table 4.10. Result of independent Sample Test for the shape affects to land price ................. 24
Table 4.11. Coefficient table of multiple linear regression ..................................................... 31
Table 4.12. The contribution of independent variables……………………………………….32
5
CHAPTER 1. INTRODUCTION
Land is one of our most precious assets. It encompasses surface, space, soil,
provision of food and water which not only provide special energy for the living on Earth but
also create a basis for urban and industrial development by constructing economic, cultural,
society, security and defense (Verheye 2007). This resource is fixed in position and limited in
area. It can’t be increased or lost itself. Therefore, land is an irreplaceable resource. In
traditional societies it is a common good and cannot be alienated nor sold. However, in a
modern free market system, because of the overpopulation growth and the development of
economic society, the demand of using land become bigger and more necessary than ever
leading to land is a commodity that is desired and can be exchanged.
The exchanging of land associated with property. It is also called earnings of land. The
difference value between land in rural and urban environment is very clear. In a rural
environment land is primarily a basis for crop production and a source for food supply in
general. It provides space for living, construction and the development of a variety of social
activities so land has thus a production value; it is a primary commodity and a commercial
asset. While in an urban or suburban environment the expected earnings are mainly linked to
the type and nature of buildings that can be constructed on the land, and the services that can
be generated from them: business, commerce, residential, public services, etc. (Verheye
2007). With the development of population also the industrialization, people need more land
to produce food, construct infrastructure, etc. Land is sold and exchanged basing on the
valuation of them. This is created the real estate market. In this market, price of land is “the
value of ownership of stipulated rights in perpetuity, and equal to the estimated present value
of the expected future appropriations of rents. It is however also affected by uncertainties
about net rent, interest rates and inflation. In other words, the value of land depends as well as
1
on the evolution of rents (Dunkerley 1983). From determining the price of land, land pricing
activities occur.
Land pricing is considered as one of important fields in economy. According to land
pricing result, the government and the people who use land, will have the right decisions in
management, business and civil transactions. Land pricing is the foundation which is serviced
for buying and selling, exchanging and transferring land. It is also the basis for some policies
about compensation of land when the government collects land and calculates the property.
From that, Land pricing not only does stabilize the land market but also contributes in
ensuring the fairness in society, especially in dissolving the conflict about building and
implementation of the land laws.
Alternatively, nowadays, the price of land in market significantly changes year by year
leading to the land pricing activities meet a lot of difficulties. In some developed and
developing countries in the world, especially Western countries such as the UK, Sweden, etc.
with the development in clearly tasks about real estate of agencies that have detail valuations
land price from the central to local levels and train large of scientific or professional staff in
specialized universities. They recovered this problem and made the land pricing is established
consistently and develop fast by estimating property value in a specific way. Mass appraisal
(It incorporates mathematical and statistical techniques and at present) has been developing
since 1970s by determining all the factors such as location, security, surrounding, etc., from
that , evaluate how them can affect to price of land. To analyze the factors of influence to the
real estate value, hedonic theory (or the real estate valuation theory) are applied primarily. As
a technique multiple regression method mostly was used in mass appraisal. This made the
land market has high exclusiveness because it provides precise property information for
appraisers and clients (BOŽIĆ, MILIĆEVIĆ et al. 2013), and creates the foundation for the
developing of economy and absolutism while this field has still been new in Vietnam.
2
Vietnam saw the significant difference between land price from government and land
price from real market. The price of land in real market is not recorded in exact paper. In land
contract which is collected by the governors, the people make value of real estate equal 1/10
the value that they make a deal. This lose the tax contributing for the country. In addition to,
the lack of the unity between two prices causes the people who is revoked land by the officials
don’t reach the agreement on price compensation for land users when land acquisition, site
clearance and relocation. This make a lot of shortcomings in managing and using land.
Therefore, dealing with the limitations, building the table for land price is necessary with
determining factors and how they affect to price of land according to suitable way is
necessary.
Tien Du Commune, Bac Ninh Province is on the way to integrate and develop. On
recent years, the social- economic activities also the projects relating to them become more
diverse and abundant. Especially, the development of infrastructure that puts more pressure on
land. The land is used more and more and its price is fluctuated leading the problems related
to the disparity in land price between the government and reality. Therefore, the determining
the factors which affects to the price of land by using multiple linear regression (which based
on the hedonic method) to build efficient assorted- land price bracket is the important thing to
reduce this difference .This also is useful for regulating the land market.
Although, the determination of factors affecting the price of land is necessary, until
now, there has no specific research about it for predicting land price in Tien Du district, Bac
Ninh Province. With the purpose is application land price method into practicality, I have
chosen “Applying Multiple Linear Regression for predicting land price in Tien Du
District, Bac Ninh Province” to be my research.
3
CHAPTER 2. STUDY GOALS AND OBJECTIVES
2.1 Goal
Applying Multiple Linear Regression Model to predict the land price in Tien Du
District, Bac Ninh Province.
2.2 Specific Objectives
To analysis the different factors which affect to price of land in Tien Du District, Bac
Ninh Province.
To find out how impact of factors on determining price of land in Tien Du District,
Bac Ninh Province.
To build Multiple Linear Regression model for predicting land price in Tien Du
District, Bac Ninh Province
4
CHAPTER 3. STUDY AREA AND RESEARCH METHODOLOGY
3.1. Study area
3.1.1. Bac Ninh Province
The area of Bac Ninh province is the smallest in Vietnam with 822,7km² (GSO, 2014).
However, the province has population density (1,375 persons / km²) classed 3 out of 64
provinces and cities in country. It is the second highest province’s population density just only
lower than population density of Ha Noi and Ho Chi Minh City and is higher 5 times
compared with the average population density of the country (274 people / km²). This
significantly affected to meet the needs of land use of 1.1312 million people (GSO, 2014)
inside the province. Located in the North of Vietnam. It borders the Hanoi City to the west
and southwest, Bac Giang province to the north and east, Hai Duong province to the southeast
and Hung Yen province on the south. Bac Ninh is one of 13 provinces of Minh Mang King,
was first established in Bac Ky in 1831. It also is a province in the north of the Red River
delta where existed the beauty of the traditional villages and folks through hundreds of years.
The topography is relatively flat with the dense network rivers from 1.0 – 1.2 km/km²
(Northern Hydrometeorological Observatory). Therefore, mostly slope direction is from north
to south and from west to east, is expressed through surface water runoff poured on Cau,
Duong and Thai Binh River. The topography not only affects to the slope direction but also
results in the climate of this province is representative for tropical monsoon, with distance
reasons and pretty cold and less rain in winter but hot and rainy in summer. The annual
temperature varies between 17.4 to 29.4 Degrees Celsius and the annual precipitation is
1500mm, depending on season. Bac Ninh is in focal economic region so it has high standard
living of population. The growth of GDP amounts to 17.86% (GSO, 2010). In 2012, the
provincial gross domestic product (GDP) of over 13607 billion (ranked 9th nationally and 2nd
Red River Delta region) and in 2016 the GDP is up to 50799 billion (statistic report of Back
5
Ninh Province, 2016). For only 4 years, GDP increases 4 times. The fast development of
economy bases on the shift economic structure towards industrialization: industrial area and
construction accounted for 77.82%; Services 16.57%; Agriculture, forestry and fisheries was
5.61%. This is the demand of land is increasingly.
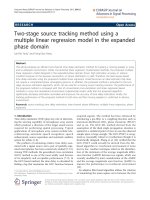
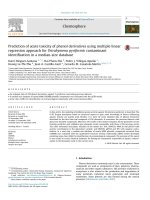
Tien Du District, Bac Ninh Province was chose to be a case study because of the
following reason. It is one of the main districts in province, restructuring economics into
industrialization. It needs more infrastructure so putting a lot of pressure on the land use.
Therefore, this area also is a focal point of reducing the different level between the land price
of government and market which plays an important role for land pricing effectiveness.
www.skyscrapercity.com
Figure 3.1. The map of Bac Ninh province
6
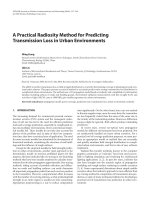
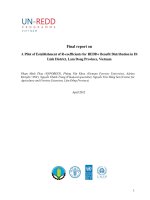
3.1.2 Tien Du District
a) Geographic location
Tien Du District is a rural area in BAC Ninh Province with total area is 956865 ha. It
bordered Yen Phong district to the north, Thuan Thanh district to the south, Que Vo district to
the east, Tu Son town to the west. The district has three national highways 1A, 1B, 38 and
276, 295 provincial road runs through the city connecting to Bac Ninh, Hanoi capital and
surrounding provinces which contributing the exchanges economy (consumption products)
and cultural of provinces with another places.
b) Topography
Tien Du district has the topography is quite flat with the slope smaller than 30˚ (except
from low mountainous such as Lim, Van Khang, Che, Phat Tich, etc. has elevation ranges
from 20-120m). This region is sloping to the sea, directs northwest- southeast. The average
elevation ranges from 2.5- 6.0 m compared with sea level.
Due to the tropical monsoon climate type, the region is hot, humid, rainy and directly
influenced by monsoon. During the year, weather is divided into two seasons: rainy and dry
seasons. The rainy season starts from May to October, precipitation is erratic fluctuations
through the year, rainfall / month from 125,2mm (10, May) to 283,3mm (August) and often
distributed unevenly throughout the year. Every year, there are two main monsoons: the
northeast monsoon and the southeast monsoon; northeast monsoon starts from October last
year to March next year and the Southeast monsoon is from April to September. Average
monthly temperatures ranges from 23.4˚C – 29.9˚C. The temperature also distributes on the
season, dry season average temperature> 23˚C, average winter temperature <20˚C.
7
/>Figure 3.2. The map of Tien Du District, Bac Ninh province
c) Soil and land use
Tien Du has different kinds of soil but almost are belongs to 2 main groups: Fluvisol
and Acrisol. Fluvisol group includes Recent Alluvial Gley Soils (on alluvium of the Red
River), Greyi- Eutric Fluvisols; Plinthic Fluvisol and Waterlogged Alluvial soil while Grey
soils on Old Alluvium belongs to Acrisol group. Therefore, soil in Tien Du district has high
porosity leading to well- drained water and be able to plant rice and crash crops.
According to land use state of Tien Du District, the area of land agriculture is 6955.75
ha, accounting for 64.17%; the land for non- agriculture (services, industry, etc.,) is 3815.58
ha (35.2%) and the non- land used is about 67.61 ha (0.63%).
8
d) Socio- economic characteristics
Population, Labor and GDP
Tien Du district had 35,000 households comprising 135,000 inhabitants (2015). There
are 71,099 people who are working and accounts for 52.8 % population.
The Gross domestic product (GRDP) average is 8.5% / year; including industry and
construction increased by 9.4%; trade and services increased by 8.9; agricultural, silvicultural,
aquatic products increased 1.9%. The percentage of economic structure by sector: industry
and capital construction is 75.5%; trade and services is 16.6%; agriculture, fishery and
forestry career 8.1%. Per capita income reached 42, 2 million / person / year, the poverty rate
fell from 6.72% in 2010 to 1.6% in 2015.
3.2 Research methodology
Figure 3.3 represents whole process of doing the analysis work.
Theory of Hedonic Regression and Multiple regression
Building Multiple Linear Regression with the influencing factors,
the observed variables
Data collection method
Data analysis method
Questionnaire revision
Statistical description and
comparison
Analyzing regression model
Proposing policy
Figure 3.3. Research framework
9
3.2.1 The theory of hedonic and multiple linear regression method
The hedonic method handled out a lot of aspects in society and economy. The original
hedonic study dealt with vegetables but the majority of the early hedonic studies were directed
toward the automobile (Fraley 2009). Waugh’s “Quality factors influencing vegetable prices
(1928) is considered the original paper in hedonic studies. Waugh attempted to measure the
physical qualities of food that influenced consumer choices. Waugh’s article was followed by
Court’s “Hedonic Price Indexes with Automotive Examples” (1939). The variables chosen
were horsepower, braking distance, window size, tires and seat width. Implicit price
coefficients (shadow prices) were Hedonic estimated for these characteristics. Court realized
consumer demand for a car could not be adequately expressed by a single price index.
Consumer’s satisfaction was based upon different combination of characteristics possessed by
a car and because consumers perceive differences in quality, differences in quality, different
models of cars sell at different prices. While Goodman (1998) identified three important
contributions from Court’s early work that have become part of the standard econometric
tools used in contemporary hedonic price studies. They are the use of linear semi- log
equations, the creation of a chained price index based on adjacent time periods, and the use of
time dummy variables. The time dummy coefficient is interpreted as an estimate of the pure
price change, holding the auto’s characteristics constant over the adjacent time periods. The
application of hedonic method become more and more developed. Until now hedonic models
are truly universally applied. Another important use of hedonic models is the appraisal of
individual housing units. It make general improvements in housing price indexes and real
estate in land market. Follain and Ozanne (1979), Chowhan and Prud’homme (2000),
Englund, Quigley and Redfearn (1998) and Tiwari and Hasgawa (2000) are among many
examples of studies we could cites that basically aim to improve the precision of housing
price benchmarks. Appraisers and other property market professionals increasingly use
10
hedonic models. They can be used to improve professional practice of appraisers and
chartered surveyors (Dubin 1998), or for undertaking mass appraisal for property taxation and
other public purposes. Besides that, many studies have tried to recover demand parameters
(and sometimes supply and demand parameters) for individual housing characteristics, or groups
of characteristics such as Awan, Odling-Smee and Whitehead (1982), Pasha and Butts (1996),
Witte, Sumka and Erekson (1982) and Kaufman and Quigley (1987).
The method of hedonic equations is one way expenditures on housing can be
decomposed into measurable prices and quantities, so that rents for different dwellings or for
identical dwellings in different places can be predicted and compared (Malpezzi 2003). At its
simplest, basing on the characteristics of houses, the hedonic equation with the independent
variables which represent the individual characteristics of the dwelling and the regression
coefficients may be transferred into estimates of the implicit prices of these characteristics.
The characteristics of houses (location, structure, neighborhood etc.,) have strong impact to
the price of house. This is similar to the determination price of land plot. Therefore, the
hedonic method used multiple linear regression model to determine the factors or
characteristic and how they can affect to price a parcel land.
Regression analysis is valuable tool for real estate professionals in determining the
correlation between building characteristics and the transaction price, as well as to predict
future transaction pricing.
The property appraisal in general and land appraisal in particular is of great
importance for one country and its economy. Having the information about land and its
values offer broad possibilities for market economy and strongly influence development of
the real estate market. However, to get the information, special attention should be paid to the
mass appraisal methods and its use in developing the tax system and framework for
11
appropriate property appraisal system (BOŽIĆ, MILIĆEVIĆ et al. 2013). Multiple regression
analysis is just one of the methods for this purpose.
Regression has been widely used for many years in economic analysis especially it is
useful for many appraisal purposes and for evaluating factors that impact the price of land.
Wilson, et al. (2014) used regression to estimate the value of different types of cropland,
which is valuable for appraisal work when puritan sales are difficult to find. Especially,
Postier et al. (1992) showed the use of regression for evaluating factors that affect the price of
land. Regression analysis is defined as a statistical tool for the investigation of relationships
between variables. . In real estate appraisal the price of property depends on the location and
the question is what the relationship between them is and how to quantify it. The statistical
significance of the relationship estimated and degree of confidence of the conclusions made
are of great importance for decision making process.
Multiple regression allows more factors to enter the analysis separately and to estimate
effect of each. In this study, Area, location, security and social infrastructure are entered in
multiple regression to show the influence of each to the price of land in market.
3.2.2 Framework of factors influencing factors the price of land in market
A wide range of factors that influence the price of land are identified in the literature
review. These factors are grouped into those that relate to characteristics specific to land; area,
location, Security, Surrounding that are discussed below (see figure 3.4)
12
Area
Location
Security
Surrounding
-
-Distance to
central building
of district.
-The level of
security in the
land located
(social evils, the
rate of crime)
-Near or far
social
infrastructures
such as school,
hospital,
market, park,
etc.
-
Total area
The width
of faỗade
Shape of
land
- Land plot
located in
commune or
town
Price of land
Figure 3.4: Factors influences the price of land
1/ Area
Many studies showed that the floor area have a positive relationship to the price of the
house (Nelson, 2003; Limsombunchai et al, 2004; Kim, 2001). This is similar to the price of
land. This is because buyers are willing to pay more for a larger space, especially the
functional space. The land with an area larger than meet the needs of families with many
members and those who can afford to pay for a better standard of living. For example,
Limsombunchai et al (2004) studied in the housing market in New Zealand found that adding
more area to increase the value of a land is about 0.08%. Bajari and Kahn (2007) reported that
large land area related to the price of land.
2/ Location
Location factors to be considered in most studies. Factors related to the location
identified in relation to the entire metropolitan area. Location factors easiest and most
common implementation is to measure position distance from the house to the center which
significantly impacted on land pricing which had been proven by researchers such as Follain
13
et al, 1985; So et al,1996; Bajari and Kahn, 2007; Frew and Jud, 2003; Limsombunchai et al,
2004; Keng, 2000. . In addition, the price of land also has influence to the location (commune
or town) has convenient transportation. Buyers tend to trade-off between the cost of housing
or land to build house to the cost of travel. Positive impact of public transport services on land
prices have been examined empirically. So et al (1996) study in Hong Kong about the
convenience of transportation, as measured by the distance to the station nearest public
transport (rail, bus) showed land prices depend on the means public transportation in the
territory. Therefore, buyers are willing to pay more for the property with easy access to the
workplace such as in town where has more convenient transportation.
3/ Security
The safety of the area in which the land as located or crime rate also plays an
important role in determining land value. If the area is one that is crime riddled then the value
will be lower. (Gregory Akerman, 2009). Babawale and Adewunmi (2011) also indicated that
the outside factors such as security, parking- lot, the distance from apartments to church…
impacts to the price of real estate. It is important to the explanation of variations in land prices
are variables derived from urban theory, such as distance to the CBD, and from the amenity
literature, such as a community's crime rate, arts, and recreational opportunities (Haurin and
Brasington 1996). Austin Troy and J. Morgan Grove (2008) using hedonic analysis of
property data in Baltimore, MD, they attempted to determine whether crime rate mediates how
parks are valued by the housing market. The results showed that parked proximity is positively
valued by the land market where the combined robbery and rape rates for a neighborhood are
below a certain threshold rate but negatively valued where above that threshold.
4/ Social infrastructure
The price of land also depends on how far social infrastructure (schools, hospitals,
supermarkets, parks etc.) from the land. Closing to shopping area or shopping center showed
14
the impact on the value of surrounding residential properties. Chin and Chau (2002) noted that
there is a shopping center within 2km radius making the price of land will increase by around
0.11% in Penang, Malaysia. Besides that, External benefits, including beautiful scenery, quiet
atmosphere and the presence of urban green space has been studied experimentally by Sander
and Polasky (2008) used data in the city of Ramsey, United States. Results showed that
people appreciated residential areas with green space and access to the recreation area with
trees. The impact of the quality of environment to price of apartments in Brazil by hedonic
method. The results showed that the apartments, are located near sewage treatment factory,
has low value. While near the public service establishment has positive impact to the
apartment’s price (Furtado 2009)
3.2.3 Data collection method:
In this study, 100 real estates were selected for survey. The survey covered an
“interview” component. The “interview” component comprised of a questionnaire designed to
collect data on general about land characteristic, factors influencing the price of land. A copy
of the questionnaire is available on request.
Table 3.1: Sampling design in Tien Du district
Commune/ Tower
Total surveyed about parcel land
Noi Due
40
Lim
30
Phu Lam
30
Total
100
Sampling design
Tien Du district has 13 communes and 1 town. First of all, the sample size was
required to have enough quantity for the analysis. Basing on five independent factors of the
conceptual model, the multiple regression analysis required sample size at least (Tabachnick
15
& Fidell, 2007): 50 + (8xm) = 50+ (8x5) = 90. Where m is the number of independent factors
of the model. Thus, we have sample size should be 100 because the number of independent
factors is seven. Two representative communes are Noi Due (40 real estates) and Phu Lam
commune (30 real estates); one town is Lim (30 real estates) have been selected to conduct the
interview. The interview design was followed by a stratified sampling approach to obtain
representative strata.
Using table questionnaires will be conducted in the research. This method will be easy
to analysis, data entry and tabulation for nearly all surveys can be easily done with many
computer software packages. It is useful for predicting land price by Multiple Linear
Regression model in SPSS software. Face to face methods also will be used to get information
about the land pricing methods were practiced by the government to evaluate the efficiency
applying Multiple Linear Regression Methods. The survey was conducted from 15th August
2016 to 28th August 2016.
Secondary data collection
The data for that question was obtained from official government records, academic
publication of different agencies such as Vietnam Statistic, Ministry of Agriculture and Rural
Development.
3.2.4 Data analysis method:
After data collection, the first step would be data preparation with editing, coding,
and data entry to ensure accuracy of data from raw data and detect errors or omission to
correct.
Next, IBM SPSS Statistic 16 was used for data analysis. To examine the research
question, a multiple linear regression will be conducted to assess if the independent variables
predict the dependent variable (criterion). A multiple linear regression assesses the
relationship among a set of dichotomous, or ordinal, or interval/ratio predictor variables on an
interval/ratio criterion variable. In this instance, the independent variables include location,
16
distance of the parcel of land to the central; area, the width of faỗade; shape; social
infrastructures, and security and the dependent variable is price of land. (See table 4.1) for a
full list of factors included in the analysis). The following regression equation will be used:
Y( LAND_PRICE)= β0+ β1( DISTANCE_CBD)+ β2(AREA)+
β3(SHAPE)+β4(WIDTH_FACADE)+ β5(SOCIAL_INFRASTRUCTURE) +β6(SECURITY)
+β7 (LOCATION) + εi
Explanation for the variances:
Dependent variables:
In the Multiple linear regression function, Y is the dependent variance which is
calculated by running the multiple linear regression model according to independent variables.
Y is the variable, shows the price of land (LAND_PRICE): this is quantitative variable, the
unit is million VND/m².
Independent variables:
X1(DISTANCE_CBD): this is variable showing the distance from piece’s land to the central
building of district.
This is quantitative variable, the unit is kilometers. The distance is measured from the
location of piece’s land to central of Bac Ninh. In reality, the land is nearer to the central, the
price of them is higher than the land which located in far from because the land closes to the
central, the ability to respond highly the essential needs such as the facility of transportation
also the development of social-economy system, etc., Expectation that, the DISTANCE
variable will be inversely proportional with PRICE variance, expected coefficient is (-).
X2 (AREA): is the variable shows the area of plat
This is quantitative variable, the unit is square meters, expected coefficient is (+). If
the area of plat is larger, the ability to meet the daily needs of people will be higher. In
addition to, the capacity to invest and develop is bigger leading to the price of land increases.
X3(SHAPE): is the variable shows the shape of plat.
17
This is qualitative variable. When applying the multiple linear regression model, this
variance will be coded with the values: the value is coded as “1” if the shape of land is
rectangular and is coded as “0” if it has others shapes (square, parallelogram, trapezoid,
reverse trapezoid etc.)
X4 (WIDTH_FACADE): is the variable represents the size of faỗade.
This is quantitative variable, the unit is meter, expected coefficient is (+). The size of
faỗade is larger, the more convenient for the commercial such as constructing building to do
business, advertise, etc. This factor also can affect the price of land.
X5 (SOCIAL_INFRASTRUCTURE): is the variable shows the social infrastructure around
the plat.
This is qualitative variable so it is also coded. If the location of plat is surrounded by
the school, hospital, market or super market, the value is coded as “1” and if it is far away
from these places, the surrounding would be coded with a 0, expected coefficient is (+).
X6 (SECURITY): is the variable, presents for the security of the plat.
This is qualitative variable. Security has 2 levels. 1= good security and 0= bad
security.
X7 (LOCATION): is the qualitative variable, presents for kind of location of land. This has 2
kinds. The first one is “1 = land belongs to commune unit” and the other is “2= land belongs
to town unit”.
εi: is the random error
β0 = a constant, the value of Y when all X values are zero
β1 = the slope of the regression surface (the β represents the regression coefficient associated
with each X1)
Besides the factors we mentioned above, the others factors such as the legality of land,
psychological factors, the polluted environment (noisy) also cause the increasing- decreasing
18
the price of land. However, in research area, they had no effect to price of land so can’t apply
in regression.
Then, standard multiple linear regression- the enter method- will be used. The standard
method enters all independent variables (predictors) simultaneously into the model. Unless
theory sufficiently supports a different method, enter is standard method of variable entry.
Variable will be evaluated by what they add to the prediction of the dependent variable which
is different from the predictability afforded by the other predictors in the model. Analyzing
correlation (including Pearson Correlation and Sig. (2-tailed) value) is used for showing the
strength of the linear relationship between each factor and land price also explaining what
single and double asterisks signify. Test the null hypothesis to express there is linear
correlation present (H0: p=0; H1: p#0). The null hypothesis of no linear correlation present in
population against the alternative that there is linear correlation present. Using guiding that
Evans (1996) suggests for the absolute value of r (Pearson correlation) .00-.19 “very weak”,
.20-.39 “weak”, .40-.59 “moderate”, .60-.79 “strong” and .80-1.0 “very strong” to evaluate
correlation between two variables.
The F- test (independent sample test) will be used to assess whether the set of
independent variables namely social infrastructure, security, shape and location collectively
predicts the dependent variable. It tells whether or not we can reject the assumption (the “null
hypothesis”) that the independent variables (jointly) are significant. R-Squared- the multiple
correlation coefficient or determination- will be reported and used to determine how much
variance in the dependent variable can be accounted for by the set of independent variables.
R- Squared must be between zero and one, with a higher number indicating more explanatory
power by the independent variables. The other relevant statistic “t- test” will be used to
determine the significance of each predictor and beta standardized coefficients will be used to
determine the magnitude of prediction for each independent variable. For significant
19