Applying GIS and remote sensing to assess water surface area change in hanoi city from 1994 to 2016
Bạn đang xem bản rút gọn của tài liệu. Xem và tải ngay bản đầy đủ của tài liệu tại đây (842.29 KB, 44 trang )
MINISTRY OF AGRICULTURE AND RURAL DEVELOPMENT
VIETNAM FORESTRY UNIVERSITY
STUDENT THESIS
Title
Applying GIS And Remote Sensing To Assess Water Surface Area Change
In Hanoi City From 1994 To 2016
Major: Natural Resources Management
Code: D850101
Faculty: Forest Resources and Environmental Management
Student: Nguyen Van Duc
Student ID: 1253090007
Class: K57 Natural Resources Management
Course: 2012 - 2016
Advanced Education Program
Developed in collaboration with Colorado State University, USA
Supervisor: Assoc. Prof. Phung Van Khoa
Co-supervisor:
Ha Noi, March /2016
ACKNOWLEDGEMENT
This thesis would not have been possible without the support and help from my
teachers, friends, families and several people. I would like to express our special
appreciation of following people who supported me with my sincere gratitude:
I would like to express my sincere thanks and appreciation to my supervisor Dr.
Phung Van Khoa for his untiring and excellent guidance, valuable suggestions in my
dilemmas. His comments and advices have helped me to finish my thesis.
I am also thankful to Prof. Lee MacDonald for his enthusiasm in guiding me to
construct thesis proposal. His comments and criticism on my proposal helped me to present
better final thesis.
Further, I would like to thank the Department of Natural Resources and
Environment in Hanoi for support and giving me the chance to study in. Besides, I also
thank the local authorities in Hanoi for providing valuable information and data of the area.
I wish to thank the Center of Laboratory and Practice of Vietnam Forestry
University for providing me with survey instrument (GPS Garmin) for field survey. I also
thank my friends for their enthusiastic help in the process collected data in field survey.
i
TABLE OF CONTENTS
ACKNOWLEDGEMENT ...................................................................................................... i
ABSTRACT........................................................................................................................... v
I. INTRODUCTION .............................................................................................................. 1
LITERATURE REVIEW ...................................................................................................... 3
Water surface related study.................................................................................................... 3
II. GOAL AND OBJECTIVES ............................................................................................ 5
2.1. Study Goal ...................................................................................................................... 5
2.2. Specific objectives .......................................................................................................... 5
2.3 SCOPE OF THE STUDY ................................................................................................ 5
III. METHODS ...................................................................................................................... 6
3.1. Data collection ................................................................................................................ 6
3.1.1. Interview data .............................................................................................................. 6
3.1.2. Field survey method..................................................................................................... 7
3.1.3. Integration of multi-temporal Landsat data and GIS ................................................... 7
3.1.4. Materials and data ........................................................................................................ 9
IV. STUDY SITE, NATURAL AND SOCIAL FEATURES ............................................. 10
4.1. STUDY AREA ............................................................................................................. 10
4.1.1. Climate ....................................................................................................................... 11
4.1.2. Topography ................................................................................................................ 11
4.1.3. Social-economic features .......................................................................................... 11
V.RESULT AND DISCUSSION ........................................................................................ 13
5.1. Image Classification ..................................................................................................... 13
5.2. Changes in Water surface cover in Hanoi from 1994 to 2016...................................... 14
5.2.1 Thematic Water surface cover in Hanoi ..................................................................... 14
ii
5.2.2. Accuracy assessment of Water surface cover classification ...................................... 28
5.2.3. Spatial Water surface area change in the study time ................................................. 30
5.3. Recommendations for better management of water surface area in Hanoi .................. 31
VI.GENERAL CONCLUSION, LIMITATIONS AND FURTHER STUDY .................... 33
6.1. General conclusion ....................................................................................................... 33
6.2. Limitations .................................................................................................................... 34
6.3. Further studies............................................................................................................... 34
VII. REFERENCES ............................................................................................................. 36
APPENDIX
iii
List of Tables
Table 5.1. List of Points for Image Classification
Table 5.3. Summary of area of water surface area classes from 1994 to 2016 (ha)
Table 5.4. Changes in area of Water surface covers in different periods
Table 5.5. Changes in area of Water covers in 2016 in comparison with previous years
(ha)
Table 5.5. Accuracy assessment Points
List of Figures
Figure 3.1: method proportion of each objectives
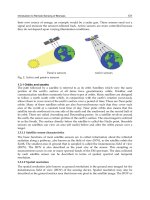
Fig.3.2: Flowchart of methodology for image classification and change mapping.
Figure 4.1. Study site
Figure 5.1 Thematic Land cover of Hanoi in 1994
Figure 5.2 Area of Water Surface in Hanoi in 1994(ha)
Figure 5.3: Thematic Land cover of Hanoi in 1998
Figure 5.4 Area of Water Surface in Hanoi in 1998(ha)
Figure 5.5: Thematic Land cover of Hanoi in 2000
Figure 5.6: Area of Water Surface in Hanoi in 2000(ha)
Figure 5.7: Thematic Land cover of Hanoi in 2005
Figure 5.8: Area of Water Surface in Hanoi in 2005(ha)
Figure 5.9: Thematic Land cover of Hanoi in 2010
Figure 5.10: Area of Water Surface in Hanoi in 2010(ha)
Figure 5.11: Thematic Land cover of Hanoi in 2013
Figure 5.12: Area of Water Surface in Hanoi in 2013(ha)
Figure 5.13: Thematic Land cover of Hanoi in 2016
Figure 5.14: Area of Water Surface in Hanoi in 2016(ha)
Figure 5.15: Land cover classes change in study time
Figure 5.16. Accuracy assessment site
iv
ABSTRACT
Water surface is considered as a fundamental component for sustainable
management of natural resource and monitoring environmental changes. In recent years,
with increasing in anthropogenic activities and climate change, water surface cover is
dramatically changed; and impact adversely affected to environment. Hanoi is the capital
city of Vietnam, it has vital role in contributed immeasurable socio-economic, cultural, and
environmental value at local, provincial, regional, national level. Therefore Hanoi’s Water
surface area is facing with decline in function and natural resource of the area by human
activities and natural calamities. This study is carried out with aim to assessing water
surface change in Hanoi from 1994 to 2016 using multi-temporal Landsat data combine
with GIS technique. From that, would have an overview about the trend of water surface
cover change which contributed better management of water surface cover in Hanoi city.
For this study, multi-temporal Landsat imagery includes Landsat 5 TM, Landsat 7
ETM+ and Landsat 8 OLI/TIRS were analyzed using ArcGIS software; and Global
Position System (GPS) was acquired for collected ground control points in the field.
Normalized Difference Vegetation Index (NDVI) was chosen to extract information from
satellite data with two land cover classes were identified including water, and Non-water.
The change detection of water surface cover is divided into four periods (1994-1998, 19982000, 2000-2005, 2005-2010, 2010-2013 and 2013-2016).
v
I. INTRODUCTION
Water is one of the prime elements responsible for life on earth. Water circulates
through the land just as it does through the human body, transporting, dissolving,
replenishing nutrients and organic matter, while carrying away waste materials. In
Vietnam, there are totally 2360 rivers totaling to more than 10 km and it would appear that
this should provide copious supply of water to the nation. However, due to the lack of
physical infrastructure and financial capacity there is low utilization of the supply along
with an uneven distribution of rain fall resulting in water shortages throughout the country
(Progress on Sanitation and Drinking Water – 2015 update and MDG assessment).
Realize the significance of water issues in Vietnam, Hanoi city in particular, this
research conducted with hope to provide insight information of how water surface area
change in Hanoi city between 1994 and 2016.
Hanoi is the capital of Vietnam where water surface degradation is seriously
happened. Water surface cover in Hanoi is decreased 80% compared with past 50 year and
water cover in Hanoi declined 72,540 m2 from 2010 to 2015 (Department of Statistic,
2015).
With the remote sensing technology widely applied in people’s lives today, the use
of that technological applications in the scientific research are also widely applied. The
remote sensing and GIS technology is a powerful tool to help people go deeper, discover,
describe, identify, supervise and assess the natural resources problems of the Earth. Many
fields have successfully applied the remote sensing technology to fully exploit their
advantages such as mapping, surveying the land, forest, environmental management,
census, survey and assess the forest, forest classification investigation. Especially in recent
years, the remote sensing technology has been a powerful application in the study of issues
relate to mangroves such as the mapping of status, investigating the change in forest,
1
assessment study the mangrove environment, forest classification survey. Despite the
advantages of GIS and remote sensing for conducting researches, there are no pre-existed
study about water cover change in Hanoi with application of GIS and remote sensing.
Because of that, we conduct the study: “Applying GIS and Remote Sensing to Assess
Water Cover Change in Hanoi City from 1994 to 2016”
* Hypothesis:
Hanoi water surface cover is decreasing significantly over 22 years between 1994
and 2016.
2
LITERATURE REVIEW
Water surface related study
Hanoi faces many challenges before every inhabitant has a secure water supply
connection meeting his/her needs. Water resources are distributed between households,
industry, hospitals and farms close to the urban area. The main water source is, at the
moment, groundwater but overexploitation of this resource calls for new sources of water
(FINNIDA, 1993). The city of Hanoi is constantly growing in size and number of
inhabitants. The water supply network does not keep up with the rate of urbanisation.
During recent years, much has been done to upgrade and expand the system. These efforts
have off course had a positive impact on the development, but much is still needed to be
done. The urbanisation seems to be a newer ending process; therefore, the development of
the network must also be a continuous process. Management of water resources in Hanoi is
not a new occurrence. Hanoi City’s Water Master Plan was developed in 1986-87 based on
data and documents compiled by Russian experts during the 70’s and 80’s (FINNIDA,
1993). The plan was in great need of revisions and updating something the Finnish
International Development Agency (FINNIDA) did between the years 1985 and 1997.
During this time, the Hanoi Water Supply Programme was implemented. Currently support
to the water sector comes mainly from the World Bank, Asian Development Bank and the
Japanese Overseas Economic Co-operation Fund (UNDP, 2000). The long-term
development objective of the Hanoi Water Supply Programme (HWSP) is: “To secure
adequate and safe water supply to citizens, industry and other consumers in the urban area
of Hanoi city by creating a sound public utility, which will provide self-financing, potable
water efficiently and at least cost.” (Sarkkinen, 1997) This ambitious objective shows that
the authorities recognise water to be an economic good consumers should pay for.
Recognition alone will not secure the water supply to all consumers. The question is how
3
well prepared the authorities are to realize their ambition. The overall responsibility for
water resources rests with the Office of Transportation and Urban Public Works Service.
Four companies have been established to assist the Office in its task. They are (FINNIDA,
1993): - Hanoi Water Business Company, responsible for management, operation and
maintenance of water supply in the urban areas of Hanoi City. - Hanoi Sewerage and
Drainage Company, responsible for operation and maintenance of the sewerage and
drainage system. 20 - Environmental Company responsible for the collection and
processing of domestic wastes. - Design Company for Urban Public Work, which carries
out all the design work for distribution pipelines and home connections. Effective
management of water use requires cooperation between these groups as well as the whole
consumer population. Until recently, water has been provided at an unmetered, fixed flat
rate heavily subsidized by the Government. This circumstance made water conservation
and at the same time keeping a well-functioning water network difficult (FINNIDA, 1993).
Integrated water management and a more aware population of water users should be the
main objectives for water planners in Hanoi. Currently interaction between stakeholders is
weak, causing ineffective management. Public participation in the water sector is very
limited (SIDA, 2003).
4
II. GOAL AND OBJECTIVES
2.1. Study Goal
Assessing the water surface area change in Hanoi from 1994 to 2016.
2.2. Specific objectives
(i) Create maps of water surface area in Hanoi each year of 1994, 1998, 2000, 2005, 2010,
2013 and 2016.
(ii) Analyze water surface changes in Hanoi in selected periods, namely 1994- 1998, 19982000, 2000- 2005, 2005-2010,2010-2013, 2010-2016.
(iii) Make recommendations for better management of water surface in Hanoi.
2.3 SCOPE OF THE STUDY
- Temporal scope
To achieve the study objectives, a series of multi-temporal Landsat imagine from 1994 to
2016 is selected based on their availability on USGS website and qualities.
- Timeline of the study
- Spatial scope: the entire area of Hanoi city, captured in one Landsat image, is
selected.
5
III. METHODS
This part describes the methods and materials that were used and applied in the
study, including data collection, data processing, data analysis with a view to achieve the
set objectives. First of all, flowchart below (Figure 3.1) will provide an overview about
method proportion of each object.
Investigate current status of water
Data collection
surface in Hanoi
Reference materials
Integration
Quantify water surface changes in Hanoi
from 1994 to 2016
Multi-temporal Landsat
imagery
Geographical positioning
system (GIS)
Identify key drivers of water surface
changes over the study time in Hanoi
Propose recommendations for better
Reference materials
management of Water surface in Hanoi.
Knowledge
Figure 3.1: method proportion of each objectives
3.1. Data collection
3.1.1. Interview data
Interview data was collected from interviews which are considered as a good way
to get information directly from people live in there. Due to they understand clearly about
this study site, so collecting information from them is very true and useful for research.
6
From interview, we can know the status current of land cover, schemes or regimes of
management, as well as driving factors of land cover change. To interview has good result,
survey questionnaire were designed.
3.1.2. Field survey method
In this study, GPS is used for marking points for image classification and checking
accuracy of the study.
3.1.3. Integration of multi-temporal Landsat data and GIS
An integration of multi-temporal remote data and GIS provides a useful method to
quantify Water surface change in Hanoi from 1994 to 2016. To have an overview of Water
surface change in Hanoi during 22 years, the study firstly constructed a single map of land
cover types in Hanoi each year of 1994, 1998, 2000, 2005, 2010, 2013 and 2016 to
evaluate and common status of water surface cover through each year.
7
Materials
GPS Field
survey
Landsat images
Of 7 years
Boundary of
study area
Clip study
area
Composite
bands
Band
combinations
Image Classification
NDVI
Accuracy assessment
Land cover
1994
Land cover
1998
Land cover
2000
Land cover
2005
Land cover
2010
Land cover
2013
Land cover
2016
Raster calculation
Area of water surface cover
Land cover change during 4 periods
1994-2000; 2000-2005; 2005-2010; 2010-2016
Fig.3.2: Flowchart of methodology for image classification and change mapping.
8
3.1.4. Materials and data
3.1.4.1. Landsat images
In this study, Landsat 5 TM imagery in 1994, 1998, 2000, Landsat 7 ETM+
imagery in 2005, 2010; and Landsat 8 OLI/TIRS imagery in 2013 and 2016 were used.
These images are freely available from the Landsat archive in the United States Geological
Survey (USGS).
This study site is the center of the north of Vietnam, the feature of area is easily
changed by natural factors such as cloud and smog. Therefore, choice in satellite image is
crucial for analyze water surface change in this area. An image without cloud is obviously
preferable. But the date of acquisition images ensures fewer differences in solar
illumination and atmospheric conditions between years. In addition, to study water surface
change between 20 years, it is crucial to have an exact time period of choosing satellite
images. Therefore, time period from November to March (dry season) is selected. All of
the images are acquired in the dry season, so the differences in water surface in these 22
years might be the changes of water surface.
9
IV. STUDY SITE, NATURAL AND SOCIAL FEATURES
4.1. STUDY AREA
Hanoi Vietnamese: Hà Nội is the capital of Vietnam and the country's second
largest city. Its population in 2009 was estimated at 2.6 million for urban districts and 7
million for the metropolitan jurisdiction. The population in 2015 was estimated at 7.7
million people. From 1010 until 1802, it was the most important political centre of
Vietnam. It was eclipsed by Huế, the imperial capital of Vietnam during the Nguyễn
Dynasty (1802–1945), but Hanoi served as the capital of French Indochina from 1902 to
1954. From 1954 to 1976, it was the capital of North Vietnam, and it became the capital of
a reunified Vietnam in 1976, after the North's victory in the Vietnam War (Wikipedia).
The city lies on the right bank of the Red River. Hanoi is 1,760 km (1,090 mi) north
of Ho Chi Minh City and 120 km (75 mi) west of Hai Phong city.
Figure 4.1. Study site
10
4.1.1. Climate
Hanoi features a warm humid subtropical climate (Köppen Cwa) with plentiful
precipitation. The city experiences the typical climate of northern Vietnam, with 4 distinct
seasons. Summer, from May until August, is characterized by hot and humid weather with
abundant rainfall. September to October is fall, characterized by a decrease in temperature
and precipitation. Winter, from November to January, is dry and cool by national standards.
The city is usually cloudy and foggy in winter, averaging only 1.5 hours of sunshine per day in
February.
Hanoi averages 1,680 millimetres (66.1 in) of rainfall per year, the majority falling
from May to September. There are an average of 114 days with rain.
The average annual temperature is 23.6 °C (74 °F) with a mean relative humidity of
79%. The highest recorded temperature was 42.8 °C (109 °F) on May 1926 while the
lowest recorded temperature was 2.7 °C (37 °F) on January 1955.
4.1.2. Topography
Hanoi is located in northern region of Vietnam, situated in the Vietnam’s Red River
delta, nearly 90 kilometers (56 miles) away from the coastal area. Hanoi contains three
basic kind of terrain, which are the delta area, the midland area and mountainous zone. In
general, the terrain is gradually lower from the north to the south and from the west to the
east, with the average height ranging from 5 to 20 meters above the sea level. The hills and
mountainous zones are located in the northern and western part of the city. The highest
peak is at Ba Vi with 1281 m, located in the western part of the region.
4.1.3. Social-economic features
4.1.3.1. Demographic
Hanoi's population is constantly growing (about 3.5% per year), a reflection of the fact
that the city is both a major metropolitan area of Northern Vietnam, and also the country's
11
political center. This population growth also puts a lot of pressure on the infrastructure,
some of which is antiquated and dates back to the early 20th century.
The number of Hanoians who have settled down for more than three generations is
likely to be very small when compared to the overall population of the city. Even in the
Old Quarter, where commerce started hundreds of years ago and consisted mostly of
family businesses, many of the street-front stores nowadays are owned by merchants and
retailers from other provinces. The original owner family may have either rented out the
store and moved into the adjoining house or moved out of the neighborhood altogether.
The pace of change has especially escalated after the abandonment of central-planning
economic policies and relaxing of the district-based household registrar system.
4.1.3.2. Economic
Hanoi has the highest Human Development Index among the cities in Vietnam.
According to a recent ranking by PricewaterhouseCoopers, Hanoi will be the fastest
growing city in the world in terms of GDP growth from 2008 to 2025. In the year 2013,
Hanoi contributed 12.6% to GDP, exported 7.5% of total exports, contributed 17% to the
national budget and attracted 22% investment capital of Vietnam (Wikipedia).
12
V.RESULT AND DISCUSSION
5.1. Image Classification
in this study, GPS is used for marking 30 points that are water surface cover(
Rivers, Lakes and Ponds) and from the table below, I concluded that NDVI ranging from
minus to 0.05 is defined as water.
Number Latitude
1 21° 7'54.04"N
2 21° 7'56.59"N
3 21° 7'52.83"N
4 21° 8'16.77"N
5 21° 8'37.09"N
6 21° 8'6.39"N
7 21° 8'34.95"N
8 21° 8'10.44"N
9 21° 7'53.15"N
10 21° 4'20.97"N
11 21° 4'16.63"N
12 21° 4'8.22"N
13 21° 3'59.81"N
14 21° 3'46.03"N
15 21° 2'29.90"N
16 21° 2'26.38"N
17 21° 1'50.77"N
18 21° 1'52.64"N
19 21° 0'26.90"N
20 21° 0'26.58"N
21 21° 0'18.74"N
22 21° 0'17.13"N
23 20°59'9.80"N
24 20°59'8.18"N
25 20°59'6.18"N
26 20°59'4.03"N
27 21° 2'43.44"N
28 21° 2'45.62"N
29 21° 0'42.05"N
30 21° 1'10.08"N
Longtitude
NDVI
105°40'20.98"E -1.33429
105°40'42.90"E -1.21371
105°40'43.19"E -0.78167
105°41'18.93"E -1.21371
105°41'26.49"E -0.79169
105°42'23.66"E -0.05763
105°42'26.56"E -0.05905
105°42'21.27"E -0.02182
105°42'38.91"E -0.12131
105°48'55.62"E -0.01291
105°48'52.44"E -0.02315
105°48'46.78"E
-0.0105
105°48'43.02"E -0.12131
105°48'42.30"E -0.14913
105°47'45.77"E -0.18236
105°47'42.76"E -0.19022
105°48'21.57"E -0.14575
105°48'36.81"E -0.22467
105°51'14.62"E -0.14851
105°51'15.77"E
-0.1492
105°51'11.55"E -0.21962
105°51'12.71"E 0.45131
105°51'17.16"E 0.38351
105°51'16.85"E -0.15551
105°51'16.48"E -0.14092
105°51'17.79"E 0.04921
105°49'42.09"E 0.034921
105°50'19.37"E 0.45291
105°50'39.95"E 0.49232
105°52'8.59"E
0.45213
Max
0.04921
Min
-1.33429
STD
0.431589
Note
Red river
Red river
West lake
Red river
West lake
Trucbach lake
Trucbach lake
Van Quan Lake
Van Quan Lake
Pond( unknown name)
Pond( unknown name)
Pond( unknown name)
Pond( unknown name)
Pond( unknown name)
Nghia Tan Lake
Pond( unknown name)
Pond( unknown name)
Linh Dam lake
Yen so lake
Pond( unknown name)
Linh Dam lake
Yen so lake
Pond( unknown name)
Linh Dam lake
Yen so lake
Yen so lake
Vinh ninh lake
Vinh ninh lake
Yen so lake
Linh Dam lake
Table 5.1. List of Points for Image Classification
13
5.2. Changes in Water surface cover in Hanoi from 1994 to 2016.
5.2.1 Thematic Water surface cover in Hanoi
5.2.1.1. Water surface covers in Hanoi in 1994
The Water surface cover in 1994 are shown in Figure 5.1; 5.2. as illustrated in the figure
5.1 with 17% of the total study area (equivalent to 39652.5 hectares) covered by water
bodies as lakes, rivers, aqua-cultural ponds and others, which is commonly found in the
Northern, Eastern and Southern parts of study site, bot more frequently found in the
Central part of Hanoi. The next Land cover class is No-water which constitute 83% of total
land cover in Hanoi (equals to 199132.2 hectares).
14
Figure 5.1 Thematic Land cover of Hanoi in 1994
Figure 5.2.Areas of Water surface cover in Hanoi in 1994(ha)
15
5.2.1.2. Water Surface cover in Hanoi in 1998
The land cover patterns in 1994 are shown in Figure 5.3; 5.4. as illustrated in the
figure 5.3 with 16 % of the total study area ( equivalent to 39053.1 hectares) covered by
water bodies as lakes, rivers, aqua-cultural ponds and others, which is commonly found in
the Northern, Eastern and Southern parts of study site, bot more frequently found in the
Central part of Hanoi. The next Land cover class Non-water which constitute 84% of total
land cover in Hanoi (199731.5 hectares).
16
Figure 5.3 Thematic Land cover of Hanoi in 1998
Figure 5.4.Areas of Water surface cover in Hanoi in 1998(ha)
17
5.2.1.3. Water Surface cover in Hanoi in 2000
The water cover patterns in 2000 are shown in Figure 5.5; 5.6. as illustrated in the
figure 5.5 with 16% of the total study area ( equivalent to 38620.8 hectares) covered by
water bodies as lakes, rivers, aqua-cultural ponds and others, which is commonly found in
the Northern, Eastern and Southern parts of study site, bot more frequently found in the
Central part of Hanoi. The next Land cover class is Non-water, which constitute 84% of
total land cover in Hanoi (equals to 200163.8 hectares).
18
Figure 5.5 Thematic Land cover of Hanoi in 2000
Figure 5.6 Areas of Water surface cover in Hanoi in 2000(ha)
19