Application of universal soil loss equation model on assessing soil erosion at bui river watershed in lam son commune luong son hoa binh
Bạn đang xem bản rút gọn của tài liệu. Xem và tải ngay bản đầy đủ của tài liệu tại đây (959.4 KB, 47 trang )
ACKNOWLEDGEMENT
I am pleased to have an opportunity to write my acknowledgements to many people
involved in the research, without whom this study would have never happened.
I would like to express my sincere gratitude to Dr. Dung for providing continuous
encouragement and guiding me to finish this thesis. Besides, I want to give a deep thanks to
staffs of Centre for Environmental Monitoring for providing me very useful datum.
Finally, I own my gratefully thank to my family and my friends for their endless love,
supports, and encouragements to me throughout all my life. Without their wonderful care, it
would have been impossible for me to complete this study.
TABLE OF CONTENT
ACKNOWLEDGEMENT
LIST OF TABLES
LIST OF FIGURES
ABSTRACT ............................................................................................................................... 1
I. INTRODUCTION ................................................................................................................... 2
II. OBJECTIVES ........................................................................................................................ 4
2.1. General objective ................................................................................................................. 4
2.2. Specific objectives ............................................................................................................... 4
III. STUDY AREA AND METHODS ....................................................................................... 5
3.1. Study area ............................................................................................................................ 5
3.2. Generalizations about soil erosion....................................................................................... 9
3.2.1. Soil erosion concept ......................................................................................................... 9
3.2.2. Summary about history of soil erosion research .............................................................. 9
3.2.3. Overview about USLE model ........................................................................................ 10
3.2.4. Soil erosion factor ........................................................................................................... 11
3.2.5. Effect of soil erosion....................................................................................................... 13
3.3. Methodology...................................................................................................................... 14
3.3.1. R factor ........................................................................................................................... 14
3.3.2. K factor ........................................................................................................................... 17
3.3.3. LS factor ......................................................................................................................... 18
3.3.4. C factor ........................................................................................................................... 19
3.3.5. P factor............................................................................................................................ 20
3.3.6. Potential erosion map ..................................................................................................... 21
3.3.7. Current erosion map ....................................................................................................... 21
IV. RESULTS AND DISCUSSION ........................................................................................ 22
4.1. Mapping factors ................................................................................................................. 22
4.1.1. R factor map ................................................................................................................... 22
4.1.2. K factor map ................................................................................................................... 24
4.1.3. LS factor map ................................................................................................................. 26
4.1.4. C factor map ................................................................................................................... 28
4.1.5. P factor map .................................................................................................................... 29
4.2. Erosion map ....................................................................................................................... 30
4.2.1. Potential erosion map based on R, K LS factor .............................................................. 30
4.2.2. Current erosion map ....................................................................................................... 32
4.2.3. Verifying by observation ................................................................................................ 35
4.3. Solutions ............................................................................................................................ 39
4.3.1. Farming method .............................................................................................................. 39
4.3.2. For erosion level 1, 2, 3 .................................................................................................. 39
4.3.3. For erosion level 4, 5 ...................................................................................................... 39
V. CONCLUSION AND RECOMMENDATION .................................................................. 40
5.1. Conclusion ......................................................................................................................... 40
5.2. Recommendation ............................................................................................................... 41
REFERENCES
LIST OF TABLES
Table1.1. Basis criteria datum of weather in the study area ....................................................... 6
Table 3.1. Some equations to calculate R factor ...................................................................... 15
Table 3.2. C index of Bui river basin ....................................................................................... 20
Table 4.1. R factor of Lam Son commune ............................................................................... 23
Table 4.2. K index of some types of soil in Lam Son Commune............................................. 24
Table 4.3. Slope analysis in Bui river watershed ..................................................................... 26
Table 4.4. LS coefficient table in Lam Son commune ............................................................. 27
Table 4.5. Classifying potential erosion in Bui river watershed .............................................. 31
Table 4.6. Classifying current erosion ...................................................................................... 33
Table 4.7. Comparison of current erosion in map and by observation ..................................... 37
Table 4.8. Soil Erosion estimation at observed locations ......................................................... 38
LIST OF FIGURES
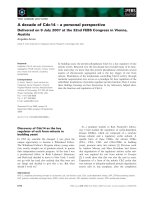
Figure 3.1. Research area ........................................................................................................... 6
Figure 3.2. Soil assessment process ......................................................................................... 12
Figure 3.3. Process of forming R factor map in Arcgis 10.1 .................................................... 15
Figures 3.4. Nomogram for calculatin K factor of Wischmeier and Smith (1978) .................. 16
Figure 3.5. Process of forming LS factor in Arcgis 10.1 ......................................................... 17
Figure 4.1. Annual Precipitation Interpolation map of Lam Son commune ............................ 20
Figure 4.2. R factor map in Lam Son commune ...................................................................... 21
Figure 4.3. K factor map of Lam Son commune ...................................................................... 23
Figure 4.4. Steep map in Bui river watershed .......................................................................... 24
Figure 4.5. LS factor map in Lam Son commune .................................................................... 25
Figure 4.6. Land use map in Lam son commune...................................................................... 26
Figure 4.7. C factor map ........................................................................................................... 27
Figure 4.8. Potential erosion map based on R,K, LS factor ..................................................... 28
Figure 4.9. Current erosion map ............................................................................................... 30
Figure 4.10. Distribution of erosion area .................................................................................. 31
Figure 4.11. Comparison between potential erosion and current erosion ............................... 33
Figure 4.12. Location in Doan Ket village (Level IV in the map) ........................................... 33
Figure 4.13. Location behind Phoenix golf resort (Level V in the map) ................................. 34
Figure 4.14. Location in Kem village (Level V in the map) .................................................... 34
Figure 4.15. Location near Phoneix golf resort (Level V in the map) ..................................... 34
Figure 4.16. Observed locations ............................................................................................... 36
ABSTRACT
Erosion is an environmental phenomenon, but due to human activities this
phenomenon has led to many serious problems. Up to the present, erosion researches work
need to be more exactly and promptly by the support of equation models and geographic
information system in calculating and processing data. With the aim of protecting soil
resource, as well as circumscribe damages by erosion, so the thesis of applying USLE on
assessing soil erosion at Lam Son commune was carried out to research. To reach the
purposes, the content of the thesis focus on collecting datum and using USLE, ArcGis
software to form rainfall map, erosion coefficient map, slope coefficient and slope length
map, canopy cover coefficient map. From those maps, we can form the erosion potential map
and current erosion map of the study area. The result of the thesis show that, the research area
is mountainous area with high slope and average precipitation is medium, so that the potential
of erosion is quite high, erosion level 4 and 5 counts for nearly 20 km2 (about 60% of the
area) this is a big number compared to the area. However, due to have a suitable plan for
exploiting and planting trees as well as crop the current erosion has decreased. In addition, the
local community as well as local people should focus more on planning the bare land area and
modifying the crop season. From that we can know more about the importance of plant on
limiting erosion. Besides, the work of assessing soil erosion requires long time, and condition
to survey and calculate factors so that the result of the thesis is for references purpose only.
1
I. INTRODUCTION
Erosion is the phenomenon of soil transferred due to water drop and wind, under the
impact of gravity of the Earth (Ellision, 1945). According to land use analyzed, Vietnam has
about 25 million of steep land, with huge potential of erosion, about 10 tons/ha/year (Vinh
and Minh 2009). According to systematic monitoring from 1960 until now, there is 10-20% of
area affected by erosion from moderate to strong (Xiem and Phien, 1999). Hence, each year,
the mountainous area in Vietnam has lost a huge amount of soil due to erosion. Erosion
makes soil loss, destroys the layer of surface soil, reduces the fertility of soil, makes soil
exhausted. In addition, depending on the characteristics of landform, erosion can be taken
along the flow to make suspended solid then accumulate in appropriate location, usually in
lying areas, this affect to the water quality and sediment. In the recent year, erosion has
occurred seriously. Bui river is an important source of water for many activities of local
people. So that it is necessary to estimate, evaluate about the erosion potential as a basis for
planning and using resources sustainably.
In the past to calculating the amount of soil loss due to erosion, researchers have to
build reservoirs to monitor the amount soil loss. However, this method is costly and timeconsuming .There are many different approaches and methods in researching soil erosion. The
common trend is to research oriented modeling by describing the dynamics of process of
erosion. There are many models of evaluating soil erosion based on USLE such as:
MUSLE(William, 1975). ANSWERS (Beasley et al, 1980), SLEMSA (Elwell, 1981),
SOILOSS model (Rosewell, 1993), RUSLE model (Renard, 1997), model. Those models
have both pros and cons in calculating the amount of soil eroded.USLE model is an empirical
technology that has been applied around the world to estimate soil erosion by raindrop impact
and surface runoff. In Vietnam, there are some researches which apply USLE model such as
there search of Tu (2011),Ha (2009), those researches were success in point out the level of
2
erosion ateach research area and proposed very good solutions to limit erosion such as ground
cover, ladder field or wetland method which has been successfully applied in the world.
Those researches were appreciated and considered as dependability references which contain
high scientific content and can be use as references for the work of land use planning.
Therefore this thesis aim to use USLE to calculate the amount of soil erosion in Bui river
watershed in Lam Son commune Luong Son Hoa Binh where has more than 70% of
topography are mountain with huge potential of erosion. Up to the present, there is no
research about soil erosion in Bui river watershed so the study on application of USLE to
assess the soil erosion there is necessary.
3
II. OBJECTIVES
2.1. General objective
This study provides scientific basic to propose possible solutions for soil erosion
management in Bui river watershed at Lam Son commune, Luong Son district, HoaBinh city.
2.2. Specific objectives
Forming maps of rainfall erosion index (R), soil erodibility index (K), slope index to
form potential and present condition map.
Giving estimation about eroding rate as well as proposing the best solution for limiting
soil erosion at Bui basin.
4
III. STUDY AREA AND METHODS
3.1. Study area
The study area is carried out in Lam Son commune- belongs to Luong Son district,
Hoa Binh province to the west.
Total area: 35.54km2
Slope : 8-25o
Location: Northern latitude: 20045’ – 21001’
Eastern latitude: 105024’ – 105039’
The study area has border:
-
To the West: DanHoa, DanHa of KySon, HoaBinh
-
To the North: TienXuan, DongXuan commune
-
To the East: LuongSon district
-
To the South: TanVinh, TruongSon commune of LuongSon, HoaBinh.
Lam Son lies about 10km along the 6 highway, it is about 45km far from HaNoi city
Study area has a lot rivers, streams, ponds, lakes which are provide water from 1796.3
ha of forest (1692.2 ha of planting forest, 22.4 ha of bamboo forest, 91.7ha of mixed forest)
with forest cover is 56.1%. Land for domestic used is 55.1ha, land for other purposes is
562.3ha and vacant land is 557.9ha (Forest Inventory and Planning Institute of VFU). The
rainy season comprises above 70% of total rainfall so that lead to flood at headwater
catchment in Bui River. However, dry seasons usually occurs lack of water for production and
living. Lam Son commune has two main ethnics: Kinh people and Muong people. The
economic depends much on agriculture, forestry and some services: golf, crafts. People in
Lam Son commune planting rice, maize, fruit trees, woody trees and grazing cattle, poultry.
The basic data of weather condition is shown in the table below:
5
Table1.1. Basis criteria datum of weather in the study area
Weather criteria
Average
Maximum
Average
Amount
Humidity
temperature
temperature
precipitation
of rainy
(%)
Month
(0C)
(0C)
(mm)
days
January
16
33.7
15
7.7
84
February
17.3
35.6
21
8.8
85
March
20.6
38.1
28
11.2
85
April
24.3
38.7
96
11.8
84
May
27
41.2
234
16.5
82
June
28.1
39.9
259
16.2
83
July
28.2
39.3
331
18
84
August
27.6
37.9
342
18.5
86
September
26.4
36.6
343
14.4
86
October
23.9
39
178
10.3
82
November
20.6
35.2
54
7.5
84
December
17.4
32.7
12
5.1
83
Whole year
23.1
23.1
1913
146
84
(Source: Bioclimatology software-Institute of ecological forest resources and environmentVietnam National University of Forestry)
Lam Son has tropical monsoon climate with two seasons:
-Rainy season with more vapors and last from April to October
-In dry season, humidity is low, dry and last from October to March in the next year.
Temperature regime: Average temperature per year is 23.1oC, July is the hottest month on
average and the coldest month is in January.
6
Rain regime: Average precipitation per year is 1913mm. Rainy season is mainly in summer
(July, August, September ). December has the lowest amount of precipitation. Average
humidity per year is 84% but it is not the same, October has the lowest humidity and the
highest is in August with 86%.
Wind regime: There are two main directions of wind are Southeast wind (blows in rainy
season from April to October) brings along hot air and vapor. The Northeast wind is dry and
blows from November to April next year. Besides, the study area is also affected by hot and
dry westerly wind and North wind.
Hydrology: The area has many streams, ponds and gully because of the fragmentation of
topographic. Due to has more than 70% of precipitation, the area usually suffered from flash
flood in upstream of Bui river. However, there usually lack of water for production and
domestic use.
7
Figure 3.1. Research area
8
3.2. Generalizations about soil erosion
3.2.1. Soil erosion concept
Erosion is a natural process, where energy provided by water, wind, and gravity drives
the detachment, transport, and deposition of soil particles. Detachment occurs when the forces
hold a soil particle in place is overcome by the forces of raindrop impact, moving water or
wind (Joy et al. 2002; Rose 1960).
3.2.2. Summary about history of soil erosion research
3.2.2.1. In the world
According to Baver (1939), studies about the issue of soil erosion carried out by
German scientists in 1877 (Huson, 1995). In 1907, researches on soil erosion has been carried
out when America‘s Ministry of agriculture announced the policy of protecting soil source.
The first detailed researches performed by Laws (1941) analyzed the mechanical of raindrops
on soil and then gave out the erosion process. Zingg (1940) introduced mathematical equation
to access the effect of slope and length of downhill slope on erosion.
In 1947, Musgrave et al. developed an empirical equation called Musgrave equation
(Hudson, 1995). This equation had been applied until it was replaced by the universal soil loss
equation (USLE) in 1958. Since the mid-1980s to the early 1990 different erosion models had
been developed based on USLE in many place in the world such as: Soil Loss Equation
Model for South America-SLEMSA (Elwell, 1981), SOILOSS model (Rosewell, 1993) was
developed in Australia and ANSWERS model was expanded in the late of 1970s to assess the
level of aggradation at river basin (Beasley et al,1980)
3.2.2.2. In Viet Nam
In Vietnam, erosion occurs gradually because the country has mountainous
topography so, researches about this problem have been carried out early. Tung and Moorman
(1958) had some basic researches about soil erosion. After completing the study, they
9
concluded that terraced farming method help to reduce soil erosion. Up to 1960 erosion
researches raised the influences of slope to soil erosion, which contribute to make the so il
protection criteria, using and exploiting steep soil, Chu Dinh Hoang (1962, 1963) had
researched about the effect of rain of on soil erosion and how to prevent erosion by
farming method.
From 1980s research works has begun to use USLE of Wischmeier and Smith (1978)
such as: Dung (1991) researched about application of universal soil loss equation on
predicting soil erosion potentiality and raising possible solutions to prevent erosion in Tay
Nguyen, Xiem and Phien (1996) also had some researches about mountainous land in
Vietnam.
3.2.3. Overview about USLE model
The Universal Soil Loss Equation (USLE) is hailed as one of the most significant
developments in soil and water conservation in the 20 thcentury. It is an empirical technology
which has been applied around the world to estimate soil erosion by raindrop impact and
surface runoff. The development of the USLE was the culmination of decades of soil
erosion experimentation conducted by university faculty and federal scientists across the
United States.
Universal Soil Loss Equation A = R x K x L x S x C x P
The USLE was developed at the USDA National Runoff and Soil Loss Data Center at
Purdue University in a national effort led by Walter H. Wischmeier and Dwight D. Smith.
The USLE is based on extensive erosion data from studies throught out the USA, and
provides a quick approach to estimating long-term average annual soil loss (A). The equation
is comprised of six factors:
R - rainfall and runoff
K - soil erodibility
10
L - slope length
S - slope steepness
C - cover and management
P - support practice
In Vietnam, application of GIS in soil erosion assessment has just been developed
since 1990. However the major model used to assess soil erosion is USLE model for example:
Dung (1991), Ha (2009), Vinh and Minh (2009). The basic of using this model is the model
that was calculated and measured empirically (data analysis from 47 areas at 21 states of
America). In this model, erosion process is influenced by climate, topographic, component
and structure of soil and human activities, those factors are shown by 6 erosion coefficients
included: rain fall (R), Slope length (L), Slope steepness (S), Cover and Management (C),
support practice (P). USLE has been improved by many researchers in Vietnam and in the
World to suit with the condition of specific areas such as Ha (1996). Up to now, methods of
calculating coefficients model based on GIS and cutting-edge technology has increased the
accuracy of the results of model.
3.2.4. Soil erosion factor
According to researches of soil erosion process of Ellision 1994, Wishmeier and
Smith 1978 etc, soil erosion factors include: rain, topography, ground cover, human.
3.2.4.1. Rainfall Erosion Index
After doing many researches of soil erosion systematically, scientists found that the
most factor of soil erosion is raindrop.
The first person pointed out that raindrop caused erosion is Elision (Elision 19940. In
1985, Hudson N. W. concluded that raindrops have the dynamic of 256 times more than its
surface flow.
11
So, mainly the impact of the raindrops is the structural break topsoil by its own kinetic
energy, this very activity made the grain detached from ground. In addition, rain also made
flow to transfer grain to sediment area.
3.2.4.2. Soil Erodibility Index
Soil erodibility is the factor, which determines the level of erosion. Raindrops cause
two effects on soil erosion process:
- Energy of raindrops splash and break the combination of soil, it also impacts on
chemical and biological property of soil and integrate soil particles
- Soil particles transformation process:
If soil is structured and maintained equilibrium, it is hard to be broken. If soil isn’t
structured, soil particles do not connect to each other, so when they are under impact of
raindrops, they will be broken easily. Soil erodibility is not only affected by soil components,
it also depend on soil structure
3.2.4.5. LS factor
Slope affect directly to the amount of soil erosion, because slope determine the
potential of soil particles and the flow arising on the soil surface. The steeper of the slope, the
stronger is the flow in the soil surface. Land with steep slope is easy to be eroded because of
some erosion factor such as: soil splashes, surface erosion, deposition and move the blocks
with greater impact to the steeper slope. Each shape of the slope has different effect on
erosion. The amount soil eroded on the flat slope is more when the slope is concave and less
when slope is protrusion. Besides, erosion is also affected by slope length.
3.2.4.3. Crop management factor
Under the impact of rain, bare lands with steep slope have high potential of erosion.
But when there are ground cover, vegetation layer will have two functions:
12
- Firstly, ground cover absorb the energy impact of raindrops, disintegrate the impact
of rain, water move along the stem of tree will be reduced the impact on soil
- Secondly, leaves and branches when fall down will deposit and form a slime layer,
which limit the surface runoff.
3.2.4.4. Practice Human factor
Human activities impact on nature both positive and negative way, those activities
may directly and indirectly lead to soil erosion. Practice human factor can be ploughing,
deforestation, livestock raising for long time.
3.2.5. Effect of soil erosion
Soil erosion has made huge impact on agricultural activities, natural and ecosystem:
- Soil loss, nutrient loss: The amount off soil loss by erosion is very big. It reduces
the soil source for agricultural production. Nutrient in soil surface is eroded so that trees do
not have nutrient to growth. Besides, nutrient loss also changed the physicochemical
characteristic of soil.
- Plant productivity: the productivity of plant is reduced due to nutrient loss.
Seriously, some area lost all crop because of erosion.
- Harmful for environment and ecosystem: Nutrient is wash away by flow with soil
particles which were abort by plant (usually algae).When algae die, the decomposition of
organic matter by microorganism reduce oxygen in water and threat to the living of fish and
other animals, finally it will destroy the balance of water ecosystem. Soil erosion also causes
water pollution because soil particle contain phosphorus, nitrate or it absorb pesticide which
harm people’s health.
13
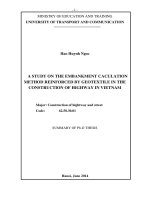
3.3. Methodology
To make a map of soil erosion for study site based on USLE and GIS, we need to
make map of R index, K index, LS index, C index. After that, gather those maps to form
potential erosion map. Finally, gathering map of C index with potential erosion to form
present condition erosion map.
Figure 3.2. Soil assessment process
3.3.1. R factor
R factor represents for Rain fall and runoff erosivity. It is the key to calculate the
strength of rain erosion and the surface runoff. R is not only precipitation, it is calculate by
sum of precipitation and rainfall intensity.
14
After many researches, with 8.250 experimental indice of 35 stations, Wishmeier
(1985) found the product between kinetic energy of rain and maximum rainfall intensity in 30
minutes singned EI30. This value reflect the relationship between ammount of soil loss and
rain mode.
Wishmeier proposed equation to calculate R fsctor based on EI30 as follow:
R = E*I30/1000 (3.1)
In which: R: Rainfall and runoff erosivity index
E: Kinetic energy of rain (J/m2)
I30: Maximum rainfall in 30 minutes (mm/h)
Table 3.1. Some equations to calculate R factor
Authors
Equation
Roose (1975)- Erosion index calculated by annual R = 0.5 x P x 1.73
precipitation (P)
Morgan (1974)- Erosion index calculated by annual R = 9.28 x P -8.838
precipitation (P)
Foster et al (1981) - Erosion index calculated by annual R = 0,276 x P x I30
precipitation (P) and I30
El-Swaify and others (1985) - Erosion index calculated R= 38.5 + 0.35 (P)
by annual precipitation (P)
Wanapiryarat et al (1986)- Erosion index calculated by R = -3,2353 + 1,789 Ln(x)
daily precipitation (X)
Ha
Nguyen
Trong
equation
(Water
resources
R = 0.548257 x P – 59.9
University)- Erosion index calculated by annual
precipitation (P)
Source : Loi Nguyen Kim (2005).
15
Forming equation to calculate R factor depend on the location of research areas due to
the differences among rainfall, rain distribution, rain characteristic, etc. The stronger and
longer of rainfall intensity and raining time, the higher potential of erosion. R factor changes
year to year, so it’s difficult to identify this factor. To get the exact value, it’s necessary to
collect the data of precipitation and rain mode of many years. When calulating R factor, we
need to consider the most suitable equation for the research area.
R factor map show the distribution of rain and flow in Bui river watershed. Forming
equation to calculate R factor require the annual precipitation and the rainfall intensity in 30
minutes (I30) of Wishmeier (1985). But due to lack of data of rainfall intensity in 30 so R
factor in Bui river watershed will be calculated according to average precipitation and applied
equation of Ha (1996)
R = 0.548257 x P – 59.9 (3.1)
In which: R is erosion coefficients of rain and flow
P: Average precipitation/year
After overview some documents, I see that this equation was studied in Vietnam
climate condition, so it will be more accurate than other equation of calculating R factor.
According to the data of precipitation at Lam Son weather station (Table 1.1), the average
precipitation/year of Lam Son commune is quite high. Based on the average precipitation, I
use interpolation algorithm to calculate and form the map of the distribution of precipitation
in Lam Son commune.
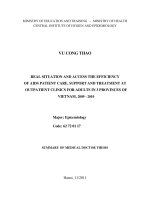
The result was carried out by Arcgis 10.1 software. The process is as follow:
Spatial Analys Interpolate to Raster Inverse Distance Weighted….
After interpolation, we conducted to overlay the class area of rain on the boundary
map and digitize them to form the map of average precipitation.
16
Figure 3.3. Process of forming R factor map in Arcgis 10.1
3.3.2. K factor
K factor represents for soil erodibility. The higher value of K, the higher potential of
erosion. K depends on soil characteristics and the stable of soil structure, components. There
are many ways to calculate K factor:
Author
Wishchmeier and
Equation
100K= 2.1x10⁻⁴M1.14(12-a) + 3.25(b-2) + 2.5(c-3)
Smith (1978)
Rosewell (1993)
100K= 2.27M1.14(10-7)(12 – a) + 4.28(10-3)(b-2) + 3.29(10-3)(c-3)
ISSS (1995)
100K= 2.241 [2.1. 10-4 (12-a)M1.14 + 3.25(b-2) +2.5(c-3)]
In which: M is defined as: (%) M = (%limon + %fine sand)(100% - %clay)
a: percent organic matter
b: classes for structure
c: permeability
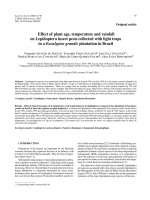
For more easily in calculating K factor, Wischmeier and Smith proposed nomogram based on
equation of Wischmeier and Smith (1987) to look up for K factor.
17
Figures 3.4. Nomogram for calculatin K factor of Wischmeier and Smith (1978)
Source: A.F Bouwman, 1985)
In this thesis, K factor is referenced from multiple sources.
To form K index map in Arcgis 10.0 I used algorithm to query any types of soil in soil
map to fill value of K index based on table 4.2. After fulfill K index, we turn to transform data
from vector to raster by Feature to Raster tool based on K fields.
3.3.3. LS factor
LS factor represents for the effect of slope steepness factor (S) and length (L) to the
process of erosion.
S is the slope steepness, soil loss much when the slope is steeper.
L is the distance between the beginning of water runoff on the land and location
of sediment deposition on the land or runoff enters a well-defined channel. The slope length
factor computes the effect of slope length on erosion. Slope length longer than 1000 ft are not
used in this interactive calculator because the calculation may not be reliable.
L and Sare two factors to be considered when calculating erosion.
Wischmeier and Smith (1978) proposed formula o calculate LS factor as follow:
- LS = (x/22.13)n (0.065 +0,045* s + 0.0065*s)
In which: x: the length of the slope (m)
18
s: percent of slope
n: actual parameter
n = 0.5 when S > 5%; n = 0.4 when 3.5 < S< 4.5%
n = 0.3 when 1% < S < 3.5%; n = 0.3 when S < 1%
Figure 3.5. Process of forming LS factor in Arcgis 10.1
3.3.4. C factor
According to Wischmeier and Smith (1978), C factor is a simple relation between
erosion on bare soil and erosion observed under a cropping system. The C factor combines
plant cover, its production level and the associated cropping techniques. It varies from 1 on
bare soil to 1/1000 under forest, 1/100 under grasslands and cover plants, and 1 to 9/10 under
root and tuber crops
To define C factor for the study area, it is necessary to have long-time observations.
There are two methods to calculate C factor.
o Surveying method Wischmeier and Smith (1978)
19
o Using current land use status map or satellite figures to forming plant cover, after
that collecting C factor of each status from other documents
In this thesis, C is considered as the cover of surface vegetation. The thicker of the
cover layer, the bigger of cover area and lower of erosion and vice versa. C index map can be
formed as mentioned in the methodology above. However, due to lack of data of satellite
figures, C index will be divided based on land use map and consulted from other resources.
From the land use map, we divided we distributed coating the surface of the study area with
the government of the types of values corresponding C index (table 3.2).
Table 3.2. C index of Bui river basin
C index
Total area(km2)
0
8.46
Protective forest land
0,001
2.9
Productive forest land
0,008
17.3
Rice field land
0,06
0,04
Perennial crop land
0,08
0,8
Annual crop land
0,2
2.1
1
4.37
Soil Type
Mountain, river
Bare land
3.3.5. P factor
In USLE equation, P factor assess the effectiveness of farming methods, it reflect the
effect of practices to protect and limit soil erosion. In RUSLE, P factor is formed of three supfactors:
P = Pc * Pst * Pter
In which:
Pc: Contour tillage sub-factor
Pst: Contour plant sub-factor
Pter: sub-factor of embankment to prevent erosion
20