Analyzing the livelihood assets of farmer households in lam son commune hoa binh province
Bạn đang xem bản rút gọn của tài liệu. Xem và tải ngay bản đầy đủ của tài liệu tại đây (588.94 KB, 48 trang )
ACKNOWLEDGEMENT
After a period of study at the Faculty of Forest Resources and
Environmental Management - Vietnam National University of Forestry, with
the assistance of teachers and friends, I finally completed my graduation
thesis. I would like to express my gratitude to the teacher - Prof.Dr. Dien
Pham Van, who has directly supported, enthusiastically helped me throughout
the course of doing graduation thesis.
I sincerely thank the cadres of the People's Committee of Lam Son
Commune, Luong Son District, Hoa Binh Province for creating favorable
conditions and helping me throughout the internship. Especially the support
of Mr. Hoang Van Hung has helped me a lot in collecting information.
Last but not least, I must express my very profound gratitude to my
parents and my friends who providing me with unfailing support and
continuous encouragement throughout the process of studying this thesis.
Sincerely thank!
I
ABSTRACT
In this thesis, a study on the livelihood assets of farmer households in
Lam Son commune - Hoa Binh Province was conducted. In this commune,
forestry production accounts for 32.3% of the commune economy, plays a key
role to improve the income of local communities. This study focuses on
analysis of 5 groups of livelihood assets of 30 households participating in
forest conservation and development in the study area. Data analysis of the
thesis has helped to classify households based on characteristics of their
livelihood assets, and to propose support direction that may help improve
livelihoods associated with forest conservation and development. Interviews
were applied to collect data for this research. Descriptive statistics were used
to analyze the collected data. Results shows that there are 4/5 household
livelihood assets in Lam Son commune are still weak (human asset, natural
asset, financial asset, and social asset). The households were classified into 2
main groups: the first group with 3 households is the poor households; the
second group with 27 households is the non-poor households. The
recommendations are opening more courses of vocational training, intensive
farming training, land use planning, and sustainable cultivation; organizing
the meeting, club for people to share and expand their knowledge, facilitating
for production households to improve their knowledge so that they can
expand their production and diversify livelihood activities. Insights from this
study might contribute to developing future plans for helping improvement of
livelihoods linked to forest protection and development.
II
LIST OF FIGURES
Figure 4.1. Map of the study site .................................................................... 13
Figure 5.1. The loans of the households in Lam Son Commune .................... 23
Figure 5.2. Similarity of households in the human assets group .................... 25
Figure 5.3. NMDS of households in the human assets group......................... 25
Figure 5.4. Similarity of households in the natural assets group
Figure 5.5. NMDS of households in the natural assets group
............... 26
................... 27
Figure 5.6. Similarity of households in the physical assets group
............ 28
Figure 5.7. NMDS of households in the physical assets group
............ 28
Figure 5.8. Similarity of households in the financial assets group
............ 29
Figure 5.9. NMDS of households in the financial assets group
............ 30
Figure 5.10. Similarity of households in the social assets group
............ 31
Figure 5.11. NMDS of households in the social assets group
............ 31
Figure 5.12. Similarity of households in 5 groups of livelihood assets .......... 33
Figure 5.13. NMDS of households in 5 groups of livelihood assets ............ 33
Figure 5.14. The educational level of the householders ................................. 34
Figure 5.15. The proportion of cultivation of the households
................. 36
Figure 5.16. Participation of the households in the local mass organizations 37
III
LIST OF TABLES
Table 5.1. Information of householders .......................................................... 13
Table 5.2. Demography and labor force of each household ........................... 16
Table 5.3. Area of cultivated land of the households ..................................... 17
Table 5.4. Water used in households .............................................................. 18
Table 5.5. The level of the using living and production facilities in the
households ....................................................................................................... 19
Table 5.6. The value of the properties of the households ................................. 2
Table 5.7. The number of livestock in the households ................................... 21
Table 5.8. Percentage of income sources of the households .......................... 22
Table 5.9. The participation in social activities of the households in Lam Son
commune ......................................................................................................... 23
IV
TABLE OF CONTENT
ACKNOWLEDGEMENT ................................................................................. I
ABSTRACT ..................................................................................................... II
LIST OF FIGURES......................................................................................... III
LIST OF TABLES .......................................................................................... IV
Chapter 1. INTRODUCTION ........................................................................... 1
Chapter 2. SPECIFIC OBJECTIVES ............................................................... 4
Chapter 3. METHODS ...................................................................................... 5
3.1. Data collection ........................................................................................ 5
3.1.1. Desk research ....................................................................................... 5
3.1.2. Sampling............................................................................................... 5
3.1.3. Interviewing ......................................................................................... 6
3.2. Data processing ....................................................................................... 6
Chapter 4. STUDY AREA ................................................................................ 9
4.1. Overview of Luong Son district.............................................................. 9
4.1.1. Topography .......................................................................................... 9
4.1.2. Natural conditions ............................................................................... 9
4.1.3. Socio-economic conditions ................................................................ 11
4.2. Overview of Lam Son Commune ......................................................... 13
4.2.1. Natural and social conditions ............................................................ 13
4.2.2. Economy ............................................................................................. 14
Chapter 5. RESULTS AND DISCUSSION ................................................... 15
5.1 Characteristics of household livelihood assets in Lam Son commune .. 15
5.1.2 Natural assets ...................................................................................... 17
5.1.3 Physical assets .................................................................................... 18
5.1.4 Financial assets................................................................................... 20
5.1.5 Social assets ........................................................................................ 23
5.2. Household classification based on characteristics of their livelihood
assets ............................................................................................................ 24
V
5.2.1. Household classification based on characteristics of human assets . 24
5.2.2. Household classification based on characteristics of natural assets 26
5.2.3 Household classification based on characteristics of physical assets 27
5.2.4 Household classification based on characteristics of financial assets
...................................................................................................................... 29
5.2.5 Household classification based on characteristics of social assets ... 30
5.2.6 Household classification based on characteristics of the 5 livelihood
asset groups.................................................................................................. 32
5.3. Recommendations for support direction that may help improve
livelihoods associated with forest conservation and development .............. 34
5.3.1. Solutions for human asset development ............................................. 34
5.3.2. Solutions for natural asset development ............................................ 35
5.3.3. Solutions for financial asset development ......................................... 36
5.3.4. Solutions for social asset development .............................................. 37
Chapter 6. CONCLUSION ............................................................................. 38
REFERENCES ................................................................................................ 41
APPENDIX ..................................................................................................... 42
VI
Chapter 1
INTRODUCTION
Livelihood is understood as a way of making a living to achieve one’s
goals and aspirations. Livelihoods are also necessary for generating income
(Robert Chambers and Gordon Conway, 1992; Ellis et al., 2003).
Sustainable livelihoods are the primary concerns of human today. It is a
necessary condition for the development and improvement of human life but
still meets the requirements of natural environment quality. In fact, there are
many programs and organizations supporting the community to aim stable
and sustainable development. Choosing livelihood activities of people is
greatly influenced by many factors: natural conditions, society, human
factors, material, infrastructure... Assessing the effectiveness of livelihood
activities helps us to understand whether people's livelihoods are suitable for
local conditions, sustainable, long-term and stable development.
Developing sustainable livelihood and poverty reduction strategies are
the basic support policies aimed at human development especially the poor,
created opportunities for them to participate in the socio-economic
development process of the country, to give the poor the opportunity and
condition that help access resources to develop the production, get out of
poverty and get a stable life. However, in reality, people still have difficulty in
accessing resources for economic development. They have less access to
capital sources such as finance, information, and facilities for development.
Improving livelihoods for local people and communities linked to
forest conservation and development is not only a goal, a requirement, but
also an important solution which is defined in the legal documents, policies of
forestry development in our country. This becomes special meaning for
remote, upland areas where nearly 10% of the population is poor and ethnic
minorities live inside or near natural forests (approximately 10.2 million
hectares). These forests can be special use forests, protection forests or
1
production forests - need to be strictly protected or closed, and prohibited to
harvest timber according to the policy of the government. Thereby, we see
that sustainable livelihood is a top concern of human beings today. It is the
necessary condition for the process of development and improvement of
human life but still meets the requirements of natural environment quality.
The livelihood assets, also known as livelihood capitals, of an
individual, household or community, and consist of five groups of factors:
-
Human capital: mostly skills, knowledge, capacity for and efficiency at
work, and education level.
-
Natural capital: mostly forests and forested lands.
-
Financial capital: mostly income, and accumulation of and access to
credit.
-
Physical capital: mostly housing, utilities, supplies, and production
equipment.
-
Social capital: mostly social relations and the level of participation in
social organizations.
Both the poor and the rich are pursuing livelihoods. However, the poor
are more likely to be vulnerable to the effects of climate change or resource
degradation. Therefore, we need to focus on the livelihoods of poor rural
people (Lase Krantz, 2001). Their livelihoods will be sustainable when have
ability to adapt or tolerate in the context of vulnerability, maintain or increase
livelihood assets, no destruction or causing degradation of natural resources
(Pham Van Dien, Nguyen Thi Thu Huyen, 2017). Human livelihoods often
occur in the context of vulnerability (such as economic shock, health, natural
disasters, pests, conflicts; trends in population change, resources, technology,
government actions; seasonality such as changes in prices, production,
employment opportunities). The livelihood assets are central and also the
starting point of each object. They have to approach these assets at certain
levels. These assets will change through its interactions with the legal, policy,
2
institutional and administrative environment. This environment will
determine people's livelihood strategies and generate livelihood outcomes
(Kollmair et al, 2002).
Experience has shown that livelihood improvement linked to forest
protection and development is a wise choice to achieve a "balance" between
"people's lives" and "forests’ survival and development" (Pham Van Dien,
Nguyen Thi Thu Huyen, 2017). From this point of view, the state
responsibility is to set up high-incentive policies to encourage people to
participate in social forestry, in order to improve and enhance the quality of
life for the people, as well as to protect and develop forests and effectively
respond to natural disasters, risks and climate change. However, the current
data on livelihood assets of farmer households have not been received much
attention from researchers and so have been insufficient.
Hoa Binh is a province which located at the Northwest of Vietnam,
where has abundant natural resources and especially forest resources. Forest
is a very valuable resource - the most important factor that constitutes the
natural balance of Hoa Binh province. Moreover, the forest is also the
residence, living and major economic source of some ethnic groups in the
province. The forest ecosystems are diverse and abundant with different
economic value. The livelihoods of the local people mainly depend on
agriculture and forestry; have created great pressure for forest management
and conservation. Therefore, the title of this study is “Analyzing the
livelihood assets of farmer households in Lam Son commune, Hoa Binh
Province” with the aim to propose support direction that may help improve
livelihoods linked to forest protection and development.
3
Chapter 2
SPECIFIC OBJECTIVES
To analyze 5 groups of livelihood assets of households that participate
in forest conservation and development in the study area.
To classify households based on characteristics of their livelihood
assets.
To propose support direction that may help improvement of livelihoods
linked to forest conservation and development.
4
Chapter 3
METHODS
3.1. Data collection
3.1.1. Desk research
-
Collecting data to find out the nature and reality of the research objects.
On the basis of inheriting published materials, research works, journals,
internet, books, newspapers, and documents collected from the People's
Committee of Lam Son commune for the most objective and accurate
assessments.
History of the commune
Weather/climate characteristics of the province
Demographic Information: number of people and households,
immigration history, gender division
Physical characteristics of the commune (topography, soil type, etc.)
Government/state’s policies to help the commune
3.1.2. Sampling
Interviewing farmer households by questionnaires to collect detailed
information
about farmer household
livelihoods, including detailed
information about the value collected from types of land use. The sample size
will be based on Slovin's formula (1960).
(3.1)
Where n: sample size
N: the population
e: a margin of error
Households are selected by random method.
There are two villages have the most forest area in Lam Son Commune
were selected for research, namely, Rong Can and Rong Tam. The two
5
villages have about 200 households living. According to the formula of
Slovin, with 200 households in total, 140 households should be surveyed.
However, in order to meet the objectives of livelihoods associated with forest
protection and development, need to select the households that own at least 1
hectare of forest land. Thus, in the 140 households that need to be surveyed
only 30 households which have all the necessary factors were surveyed.
3.1.3. Interviewing
Data on 5 groups of livelihood assets of farmer households were
collected by interviewing. Some other information are also needed and
collected such as:
-
Personal information
-
Housing status, agricultural infrastructure, species and quantity of
livestock, business assets, etc.
-
Family population, education, age structure, gender composition, the
quantity of labor force
-
Household wage income, access to loans (low-interest, interest-free or
usury), employment, subsistence allowance, etc.
-
Land plot area owned by the family, irrigation conditions, crop types,
crop yield per unit
-
Local culture
-
Strength, weakness, opportunities, and threat of household in linking
livelihood improvement to forest protection and development.
3.2. Data processing
From the data collected from the research, fieldwork and survey
interviews will conduct statistical analysis and processing to make the results
as a basis for the report.
(1) Human assets. Human capital represents the skills, knowledge, and
the ability to work as well as good health that together enable people to
pursue different livelihood strategies and achieve livelihood objectives. At the
6
household level, human capital is a factor of the amount and quality of labor
available, and this varies according to household size, skill level, leadership
potential, and health status.
(2) Natural assets. Natural capital is the term used for natural resource
stocks from which resource flow and services (e.g., nutrient cycling and
erosion protection) that are useful for livelihoods are derived. Natural capital
is constituted by a wide variation in resources from intangible public goods
such as the atmosphere and biodiversity to divisible assets used directly in the
production of goods (such as trees, land).
(3) Physical assets. Physical capital comprises the basic infrastructure
and producer goods required to support livelihoods. This infrastructure
consists of changes to the physical environment that helps people meet their
basic needs and to become more productive. Producer goods are the tools and
equipment that people use to function more productively.
(4) Financial assets. Financial capital denotes the financial resources
that people use to achieve livelihood objectives. The definition applied here is
not economically robust. In this definition, it includes flows as well as stocks,
and it can contribute to consumption as well as production.
(5) Social assets. Social capital – mainly are social relationships and
participation in social organizations. In the context of the Sustainable
Livelihoods Framework, it is taken to mean social resources in which people
draw from the pursuit of livelihood objectives.
To analyze characteristic: Use qualitative and quantitative methods to
analyze. Some specific methods are the analysis of frequency, average,
variation, maximum and minimum values, the coefficient of variation, and
synthesizing data related to livelihoods. Using partial analysis and integrated
analysis methods combined with system analysis. From the results analyzed
associate with comparative analysis to find the difference. Then apply the
livelihoods framework to explain the problem.
7
Mean:
Standard deviation:
̅
∑
∑
√
Coefficient of variation:
(3.2)
(
̅)
̅
(3.3)
(3.4)
To classify: The classification of farmer households was based on
multicriteria methods such as dendrogram, PCA with the support of R
software; from the result of dendrograms, analyze the similarities between the
households to separate groups with different similarity level.
To give recommendations: Based on the characteristics to identify what
assets are still weak and why they are weak. From that, I suggested some
solutions to improve household livelihood assets.
8
Chapter 4
STUDY AREA
4.1. Overview of Luong Son district
4.1.1. Topography
Luong Son is a gateway district to the east of Hoa Binh province,
adjacent to Hanoi and the Northwest of the country, close to Hoa Lac Hi-tech
Park, Phu Cat urban area, Mieu Mon, National University, Vietnam National
Village for Ethnic Culture and Tourism. The district is located in geographical
coordinates: from 105025'14"- 105041'25" East longitude; 20036'30"20057'22" North latitude. It borders Ky Son district to the west, Kim Boi and
Lac Thuy districts to the south, My Duc and Chuong My districts to the east,
and Quoc Oai district to the north (Hanoi city).
The total natural area of the district is 36,488.85 ha, divided into 20
administrative units, included 19 communes and 1 town (Cao Dam, Cu Yen,
Hoa Son, Hop Hoa, Lam Son, Lien Son, Nhuan Trach, Tan Vinh, Thanh Lap,
Tien Son, Truong Son, Trung Son, Tan Thanh, Cao Duong, Hop Chau, Cao
Thang, Long Son, Thanh Luong, Hop Thanh, and Luong Son town). The
district center is located in Luong Son town - It is the economic, political and
cultural center of the district. The distance from Luong Son to Hanoi is about
40km to the west; to Hoa Binh is about 30km to the east. There are National
Highway 6A and Ho Chi Minh Road crossing; plentiful resources and
abundant labor force.
Luong Son has advantages in geographical position, as the hub for
economic, social and cultural exchanges between the mountainous Northwest
and the Red River Delta (as well as Hanoi).
4.1.2. Natural conditions
Luong Son district is the transition area between the plains and the
mountainous area, so the terrain is very diverse. The low mountainous terrain
9
has the same height about 200-400m, formed by magma, limestone, and
terrigenous sediments, with a dense network of rivers and streams.
The climate of Luong Son is tropical monsoon, with cold winters, less
rainfall; hot summer, heavy rain. The annual average temperature is 22.9 23.3°C. The average rainfall is from 1,520.7 to 2,255.6 mm/year, but
unevenly distributed throughout the year and even in the season is also very
erratic.
Luong Son has a network of rivers and streams that are distributed relatively
evenly in the communes. The largest river flowing through the district is the
Bui River, originated from the Vien Nam Mountain with 1,029m of height in
Lam Son commune, stretched 32km. As the beginning, the river flows in the
direction of northwest-southeast, when it comes to Tan Vinh commune, it
merges with Bu stream (originating from Truong Son commune), and then the
river turns to winding direction towards the West-East to the end of the
district. Bui River is characterized by an old river, wide valleys, flat bottom,
and small slope, capable of the reservoir.
In addition, there are some small "inland" rivers and streams which
potentially are good drainage.
The features of the system of rivers and streams in the district are
economically significant, facilitate the construction of reservoirs are used for
combining flood control with irrigation in agricultural production.
It can be seen that the characteristics of climate, hydrography and rivers
have created favorable conditions for Luong Son to develop agriculture,
diversify crops and animals, and develop forestry. The system of rivers,
streams, reservoirs, and dams are not only a source of water for living and
people's life but also effective in regulating climate, improving the ecological
environment and developing aquatic resources.
10
4.1.3. Socio-economic conditions
The total population of the district is 98,856, consisting of 3 main
ethnic groups: Muong, Dao, Kinh, in which Muong ethnic group accounts for
about 70%. There is abundant labor force, the number of non-agricultural
labors is increasing, the percentage of trained laborers account for 55%,
which show that the district has strength in labor resources.
In 2016, despite the difficulties and challenges, under the leadership of
District Party Committee, supervision of the People's Council, the direction
and management of the district People's Committee and the efforts of all
departments, branches, local people, the business community, so that the
economy - society of Luong Son district continue to be maintained and
developed. Total social investment reached VND 1930 billion; state budget
revenue was VND 183.2 billion, increased by 21.5% over the estimate;
economic structure shifted in the right direction, the proportion of industry construction accounted for 54.8%, trade and services 29%, agriculture,
forestry, and fisheries fell to 16.2%; export turnover increased 73.5% to reach
$ 347 million; average income per capita reached 43 million VND/year;
maintained 5 communes meeting the new rural standards and rose 1 more
commune to reach 19/19 criteria, raise the average rate of communes in the
district to 15.7 criteria/commune; rapid urbanization; the percentage of trained
workers is 55%; the percentage of population participating in health insurance
reaches 78.8 %; the life quality of the people has been improved remarkably
with 92% of households using hygienic water; stabilize forest cover at 46%.
In 2016, Luong Son district has 15/16 socio-economic indicators which meet
and exceed those of the Resolution set by the People's Council (1 indicator is
not completed is the poverty rate decreased 1.3/1, 7% of plan). These are
favorable conditions for the development of Luong Son district to become an
economically dynamic region of Hoa Binh province.
11
In the implementation of the Resolution No 06-NQ/TU dated 11/5/2012
of Hoa Binh Provincial Party Committee, Luong Son district will develop
quickly and sustainably on the basis of planning, management of the rational
use of natural resources, and ecological environment protection. With the goal
is to mobilize resources, construct the center of Luong Son district become
the grade - IV urban center by 2020, create a premise to become Luong Son
borough in 2025 in order to strongly attract domestic and foreign capital
sources to invest into the district, expand the manufacturing business lines
diversified, create new economic strength for Hoa Binh in general and Luong
Son district in particular. The resolution has proposed the urban development
indicators up to 2020 and orientation to 2025; the targets orientate to become
a borough in 2025. Accordingly, Luong Son will become a general center, the
hub of transportation, economic, cultural and social exchanges, plays the role
of promoting socio-economic development of the province, confirming the
position of Hoa Binh in the Capital development strategy.
With the advantages of geographical location, natural conditions and
population, the direction of Hoa Binh province, in the past years, Luong Son
district has attracted 151 domestic and foreign projects to invest in, including
17 foreign direct investment (FDI) projects with total registered capital of US
$ 276 million; 134 domestic investment projects with total registered capital
of 14,467 billion VND, so that created many jobs for laborers, contributing to
increasing local budget revenue and boosting the economy of the district to
develop strongly towards industrialization and modernization of rural
agriculture, step by step shift the economic structure in a positive way to raise
the proportion of industry - handicraft, trade - Services and gradually reduce
the proportion of agriculture, forestry and fishery, towards to the construction
of Luong Son district soon became the nucleus of the dynamic economic
region of Hoa Binh province.
12
Information was taken from People's Committee of Luong Son district,
2014.
4.2. Overview of Lam Son Commune
4.2.1. Natural and social conditions
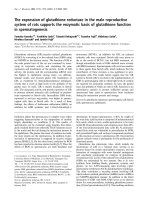
Lam Son commune is located in the northwest of Luong Son district.
The East borders Luong Son Town; the West borders Dan Hoa commune, Ky
Son district; the southwest borders Tan Vinh commune and Truong Son
commune; the north borders on Dong Xuan commune, Quoc Oai district and
Tien Xuan commune, Thach That district, Hanoi. The total natural area is
3,554.64 ha.
Figure 4.1. Map of the study site
Commune population is 4380 inhabitants / 1,100 households (Muong
ethnic group accounts for 49%, Kinh ethnic group 51%) including 9 villages
are distributed along 7 Km national highway 6A. Geographic location and
13
transportation are convenient, infrastructure is gradually being invested,
companies and enterprises continue to invest in manufacturing business
effectively in the locality. Currently, there are 10 companies in the commune
are doing manufacturing business. In which, Phuong Hoang Golf Course
Company with 100% foreign capital is doing business very effectively,
creates jobs for about 300 laborers, offers many opportunities to develop
service business.
4.2.2. Economy
Along with the communes in the district, promote the tradition of
industriousness and creativity, cadres and inhabitant of Lam Son Commune
have taken initiative in implementing solutions for socio-economic
development. In recent years, Lam Son commune has made breakthroughs in
socio-economic development, the average economic growth rate in the period
of 2010 - 2014 estimated at 14%/year; the budget revenue of the next year is
higher than that of the previous year, in 2010 the commune budget revenue
reached 1,989 million VND, in 2014 reached 5,383 million. The economic
structure shifted dramatically towards increasing the proportion of industry,
trade, and services; gradually reducing the proportion of agriculture. At
present, the commune has an economic structure: the values of industrial
production, handicraft, construction account for 29.2%; trade and services
account for 38.5% and agricultural and forestry production account for
32.3%; the socio-cultural fields are concerned and progress; the material and
spiritual life of the people has been improved and improved significantly;
security, politics, social order, and safety are strengthened and maintained,
facilitate the renewal and development of Lam Son Commune. As of
December 2014, the new rural construction of Lam Son Commune has
reached 14/19 criteria, 2015 strive to gain one more criterion of new rural
construction.
Information was taken from People's Committee of Luong Son district,
2015.
14
Chapter 5
RESULTS AND DISCUSSION
5.1 Characteristics of household livelihood assets in Lam Son commune
5.1.1 Human assets
The analysis results in Table 5.1 shows that the number of male
householders accounted for 86.7% with 26/30 people, while the number of
female householders accounted for 13.3% with 4/30 people. This represents
that men are more respected than women. On the total of 30 householders,
there are 3 people were not able to attend school (accounting for 10%) due to
war conditions or poor family circumstances. The majority of household
heads have the educational level at primary school (accounting for 43.3%)
and at secondary school (accounting for 36.3%). There are 3 people who
graduated from high school (accounting for 10%), because of the conditional
family or belonging to the next generation.
Table 5.1. Information of householders
Gender
Number
of
people
Percentage
Educational level (grade)
Male
Female
No level
1-5
6-9
10-12
26
4
3
13
11
3
86,7%
13,3%
10%
43,3%
36,6%
10%
There are many reasons leading to the situation of the low educational
level of the local people. The main reason is that the population in the
commune formerly came from purely farmer families, and their life was
difficult, so they did not have enough conditions to study to raise the
intellectual standard of people. However, in recent years, parents have been
aware of the importance of improving their children's education. They are
aware that the low level of education is the cause of poverty. Therefore, all
families in the commune send their children to school, with the aim of raising
15
the level of future generations, creating qualified human resources to serve the
country.
Table 5.2. Demography and labor force of each household
Demography
Coefficient
Min
Max
Average
Number of people
2
8
5,1
26,9%
Number of laborers
2
6
3,4
27,6%
Number of dependents
0
3
1,7
54,5%
of variation
Table 5.2 shows the demographics, labor composition and dependents
of 30 households surveyed. In the surveyed households, on average, each
household has 5.1 members, with at least 2 members and a maximum of 8
members. Of which, the average number of laborers is 3-4 people per
household, with at least 2 laborers and maximum of 6 laborers, including both
the main and secondary labors. Accordingly, each household has an average
of 1.7 people do not generate income. Households that have the highest
number of non-laborers are 3 people, and even some without dependents. The
coefficient of variation of the number of family members and laborers
accounted for 26.9 and 27.6%, so quite homogeneous. Whereas the
coefficient of variation of the number of non-laborers accounted for 54.5%,
there was a slight difference and not significant. Table 5.2 also shows that the
ratio of labor to dependents is 2:1, which means that two laborers taking care
one dependent. This does not affect the economic development of farming
households. This data was collected based on family members that are
currently residing in the locality, excluding people who separated from the
household.
16
5.1.2 Natural assets
Table 5.3. Area of cultivated land of the households
Area of cultivated land
Area
of
acacia
plantation
Area
of
eucalyptus
plantation
Area
of
citronella
plantation
Area of tea plantation
Coefficient of
Min (ha)
Max (ha)
Mean (ha)
1
7
2,63
58,3
0
5
2,33
61,1
0
3
0,17
388,6
0
1
0,4
529,2
0
1
0,3
538,5
variation (%)
Table 5.3 shows the area of cultivated land of the households in Lam
Son commune. On average, each household has 2.63ha of cultivated land,
with 2.33ha of acacia plantation, 0.17ha of eucalyptus, 0.4ha of citronella and
0.3ha of tea. The surveyed households were selected on the criteria of at least
1 ha of forest land, but in terms of minimum area of each plantation type,
there is no hectare in each type. Meanwhile, the household owns the largest
area of cultivated land is 7ha, with a maximum of 5 hectares of acacia
plantation, 3 ha of eucalyptus, 1 ha of citronella and tea. The coefficient of
variation of cultivated area is 58.3%, so there are differences between
households but not significantly. With 61.1% coefficient of variation, the
acacia plantation area of the households is also not too different. However, the
coefficient of variation of eucalyptus plantation area in each household is very
high, accounting for 388.6%; In particular, the cultivated area of citronella
and tea of the households has the highest coefficient of variation, accounting
for 529.2% and 538.5%. As can be seen, most of the households in Lam Son
17
commune plant acacia because the coefficient of variation is not too large. In
contrast, there are very few households planting citronella, tea and eucalyptus,
so the coefficient of variation is really large.
From the survey results, 100% of the surveyed households have land
ownership (red book). In general, most of the cultivated land is forestry land,
only very little agricultural land left in Lam Son commune. In 30 surveyed
households, there is no household owned agricultural land. From about more
than 10 years ago, the households of Rong Can and Rong Tam villages were
relocated to the current residence. Previously they had been subject to land
reclamation for construction of the golf course project so that there is almost
no agricultural land left (sources of interview results).
The analysis results in Table 5.4 show that most of the households in
Lam Son commune are using hygienic water sources with 86.7% of the
sample (26/30 households surveyed); only a few households still use
rainwater in their lives, accounting for 13.3% (4/30 households surveyed).
Table 5.4. Water used in households
Water sources
Total (household)
Percentage (%)
Hygienic water
26
86,7
Rainwater
4
13,3
Water sources are often used in the daily life of households in Lam Son
commune called hygienic water because it is mainly water from bored wells
that have not been filtered and treated. They do not have access to water
supply and drainage services such as clean water supply, waste treatment, etc.
5.1.3 Physical assets
The physical asset is an essential element in our lives, which includes
infrastructure, housing, production tools, etc. Physical capital is also
expressed in the total value of household assets; in this study, the greater the
18
value of the property, the better the housing, and the better living and
production facilities.
Table 5.5. The level of the using living and production facilities
in the households
Facilities
Coefficient
Average
Min
Max
Filtering machine
0,27
0
1
168,7%
Motorbike
2,70
1
4
32,5%
Television
1,03
1
2
17,7%
Fridge
0,93
0
1
27,2%
Air conditioner
0,43
0
2
156,7%
Hot-water heater
0,87
0
1
39,9%
Washing machine
0,47
0
1
108,7%
Computer
0,33
0
2
198,3%
Production facilities
0,30
0
1
155,4%
of variation
Table 5.5 shows the level of the using living and production facilities of
the households in the commune. In general, it can be seen that all the
surveyed households have at least one television and one motorbike, even a
household has four motorbikes. The coefficient of variation of living facilities
such as motorbike, television, fridge, hot-water heater are all less than 40%,
so there is no significant difference because they are all common in the
households; On average, each household has 2.7 motorbikes, 1.03 televisions,
0.93 fridges, and 0.87 hot-water heater. In contrast, living facilities such as
filtering machine, air conditioner, washing machine, computer, and
production facilities have a large variation coefficient (over 100%), especially
computers with a variation coefficient of 198.3%. The means have a large
coefficient of variation are often used only in the households that have better
19