Analyzing nearest neighborhood characteristics of a tropical evergreen forest at k’bang district gia lai province using time series data
Bạn đang xem bản rút gọn của tài liệu. Xem và tải ngay bản đầy đủ của tài liệu tại đây (665.33 KB, 43 trang )
MINISTRY OF AGRICULTURE AND RURAL DEVELOPMENT
VIETNAM NATIONAL UNIVERSITY OF FORESTRY
STUDENT THESIS
ANALYZING NEAREST NEIGHBOR CHARACTERISTICS OF A
TROPICAL EVERGREEN FOREST AT K’BANG DISTRICT, GIA LAI
PROVINCE, USING TIME SERIES DATA.
Major: Natural Resources Management
Code: D7850101
Faculty: Forest Resources and Environmental Management
Student: Vu Manh Cuong
Student ID: 1453091211
Class: K59A Natural Resources Management
Course: 2014 – 2018
Advanced Education Program
Developed in collaboration with Colorado State University, USA
Supervisor: Dr. Nguyen Hong Hai
Hanoi, June 2018
CONTENTS
CONTENTS
LIST OF FIGURE
CHAPTER 1 - INTRODUCTION ......................................................................................... 1
1.1. Forest and forestry in Vietnam ....................................................................................... 1
1.2. Selective logging in tropical forests ................................................................................ 1
1.3. Selective logging in Vietnam .......................................................................................... 2
1.4. Forest structure and Dynamics ....................................................................................... 3
1.5. Nearest Neighbor Characteristics ................................................................................... 5
CHAPTER 2 - MATERIALS AND METHODS .................................................................. 7
2.1. Study site......................................................................................................................... 7
2.2. Topography and soil ....................................................................................................... 9
2.3. Forest resources ............................................................................................................ 12
2.4. History of silvicultural and forest management practices in the study site .................. 13
2.5. Data collection and analysis ......................................................................................... 14
2.5.1. Sampling design ......................................................................................................... 14
CHAPTER 3 - RESULTS AND DISCUSSION ................................................................. 19
3.1. Tree species diversity and composition ........................................................................ 19
CHAPTER 4 – CONCLUSION .......................................................................................... 30
4.1. Tree species diversity and composition ........................................................................ 30
4.2. Tree dynamics ............................................................................................................... 31
4.3. Nearest neighbor characteristics ................................................................................... 32
REFERENCES .................................................................................................................... 33
APPENDIX .......................................................................................................................... 38
LIST OF FIGURE
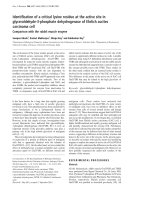
Figure 2.1 The location of the study site in Gia Lai Province, Central Highlands of ........... 8
Figure 2.3 Climate diagram of Vinh Son, near the study site, data recorded from 1990 to
2010 (Nguyen et al., 2011). ................................................................................................. 11
Figure 2.5 Layout of a 1 ha sample plot. ............................................................................. 15
Figure 2.6: Definition of the spatial parameters: Mingling (a), Dominance (b) and Uniform
Angle Index (c). ................................................................................................................... 18
Figure 3.1. Simpson diversity indices of three forest types from 2004-2012. ..................... 19
Figure 3.2. Shannon diversity indices of three forest types from 2004-2012. ..................... 19
Figure 3.3. Evenness diversity indices of three forest types from 2004- 2012.................... 20
Figure 3.4. Species richness of three forest types from 2004 - 2012 ................................... 21
Figure 3.5. Tree abundance of three forest types from 2004- 2012..................................... 21
Figure 3.6 Change diameter of three forest types from 2004- 2012 .................................... 24
Figure 3.7 Change High of three forest types through time series. ..................................... 25
Figure 3.8. Mortality of three forest types through time series. .......................................... 26
Figure 3.9. Recruitment of three forest types through time series. ...................................... 27
Figure 3.10. Mingling characteristics of all trees in three study plots ................................. 28
Figure. 3.11. DBH characteristics of all trees in three study plots ...................................... 28
Figure. 3.12. Uniform Angle Index characteristics of all trees in three study plots ............ 29
CHAPTER 1 - INTRODUCTION
1.1. Forest and forestry in Vietnam
Forest vegetation in Vietnam is diverse as a result of differing climatic conditions and
topographic/latitudinal variations (Thai, 1978; USAID, 2013). Vietnam has at present 13.9
million hectares of forest covering 39.9% of its total land area; of these, 10.4 million
hectares (75.2%) are natural forests (FPD, 2013) that can be classified into eight major
forest groups: (1) close-mixed evergreen broad-leaved rainforest, (2) semi-deciduous
mixed forest; (3) mixed limestone forest; (4) coniferous and mixed coniferous broadleaved forest; (5) sparse forest, seasonal deciduous forest, and Dipterocarps-dominant
forest; (6) mangrove forest; (7) Melaleuca forest (i.e., forest on alum land); and (8)
bamboo and mixed timber-bamboo forest. As it is the case concerning other tropical
forests, Vietnam‟s forests are high in diversity, and up to hundreds of different tree species
can be found within one hectare (Whitmore, 1990; Richards, 1996). The result is a high
level of biomass and productivity (Vanclay, 1991a; Le, 1996; Sam, 2004; Gunter et al.,
2011).
1.2. Selective logging in tropical forests
The term "selective logging" is used to describe forest management techniques, namely
harvesting valuable trees on a stem diameter with rules designed to maintain forest cover
(Lobo et al., 2007). According to Rapera (1977) cited by Johns (1985), selective logging is
defined as “the removal of mature, over mature and defective trees in such a manner as to
leave uninjured an adequate number and volume of healthy residuals of commercial
species and other tree species, necessary to assure a future crop of timber and forest cover
for the protection of soil and water”. Silviculture systems are usually classified as multiring or round depending on the number of harvested activities in a forest in a rotation
1
system (Smith and Nichols, 2005); Selective mining is a multi-ring system (Lamprecht,
1989).
Selective logging is considered a better practice than clear cutting (Gatti et al., 2014). It
is increasingly being accepted as an approach to protecting forest integrity and enabling the
proper use of resources. This silvicultural technique is widely used because the growers
want to keep the immature seedlings alive for future crops. In other words, after the
selective logging, the rest retained the main structural elements of the forest as well as the
various ecological niches maintaining high levels of biodiversity and keeping the
ecosystem functioning in a way to facilitate faster recovery of pre-harvested values
(Nzogang, 2009).
However, in practice, selective logging systems tend to intensify to the extent that they
lead to the conversion of logged forests into secondary forests (Gadow, 2012). The longterm sustainability of such forests for particular species and size of timber is uncertain. The
future success of a selective harvesting system may depend on the number of commercial
trees extracted per unit area (Whitmore, 1984). A highly mechanized logging operation is
largely random in its effects because the overall damage is severe and certainly not limited
to commercially important crops (Johns, 1985).
1.3. Selective logging in Vietnam
Selective logging is the most popular and widely employed method for commercial
timber production in Vietnam. This silvicultural system has been applied to natural forests
since 1960, often under the name “selected cutting with natural regeneration” (MARD,
1993; Le, 1996; Ho, 1999; MARD, 2005a). This method was also implemented in the
study site. The main objective of this silvicultural system is to improve the efficiency of
harvesting operations, avoid unnecessary damage to the remaining trees, decrease forest
degradation, and increase the high yield for the next cutting cycles (MARD, 1993; Le,
1996; MARD, 2005a).
2
The selected cutting with natural regeneration system (MARD, 1993) can be described
as follows:
Applied forests have a standing volume ≥ 130 m3 per ha;
The minimum diameter at breast height (DBH) for cutting is determined by timber
groups; it ranges from 40 to 50 cm DBH;
The cutting cycle is 35 years,
The maximum cutting intensity is 38 % of the total standing volume.
In Vietnam‟s selective logging practice, only commercial species and the best stems
are concentrated on, while other non-commercial species are not objectives despite their
mature status (Ho, 1999). Consequently, the quality of the remaining stems and forest is
adversely affected, and the number of individuals per hectare decreases. Such a harvesting
system not only directly affects species‟ resilience it also poses a risk to the genetic
diversity of natural forests and natural regeneration because it eliminates seed dispersals
(Le, 1996; Ho, 1999). Studying the effects of selective logging on forest structures, natural
regeneration, and forest dynamics in Vietnam is thus necessary.
1.4. Forest structure and Dynamics
Forest structure
Forest structure‟ refers to the way in which the attributes of trees are distributed within
a forest ecosystem (Gadow, 2012), this structure is a product of forest dynamics, a driver
of ecosystem processes and biological diversity (Speis, 1998). In other words, forest
structure is the result of natural processes and human disturbance (Gadow et al., 2002).
Understanding forest structure is key to determining harvest events and stimulating the
forest dynamics that follow them (Gadow, 2012). Without adequate descriptions and
understanding of forest structure and diversity, one runs the risk of being unable to follow
a silvicultural prescription or learn from the resulting successes or mistakes.
3
Oliver and Larson (1990) defined the forest structure as "the physical distribution and
time of the tree in a place." The main forest structure attributes are the type of structure,
size, shape and spatial distribution of the components (Speis, 1998). Forest structures can
be described based on inventory data such as tree abundance, average diameter, average
height, bottom area, standing mass and frequency distribution as well as quantitative
information (Brodbeck, 2004).
Forest dynamics
Forest dynamics encompasses the changes in forest structure and species composition over
time, as well as the forest‟s behavior in response to anthropogenic and natural disturbances
(Oliver and Larson, 1990). Understanding the dynamics of the forest is fundamental to
developing sound management systems for harvesting and/or conserving forest resources
by predicting future forest structures and development patterns (Oliver and Larson, 1990).
The determination of forest and tree growth, which is measured via tree diameter (Swaine
et al., 1987b), is of major importance for forest managers. Information on diameter
increments and growth patterns for each species relates to forest stand productivity. It is
therefore essential data for sustainable forest management (SFM). In addition, the diameter
increment has become the most important variable for an allometric equation (Vanclay,
1994) and as such plays a key role in examining the dynamics of a natural forest. Changes
in the species composition reflect the natural restoration of disorders (Okali and OlaAdams, 1987). In tropical forests, it is difficult to estimate these changes as many species
are represented by only a few individuals (Swaine et al., 1987b). According to Okali and
Ola-Adams (1987), the species composition of the large canopy and the emergence species
in the secondary rainforest can be identified early in the development of a standing tree.
Basic knowledge about the changes in species composition in tropical forests remains
limited due to the lack of long-term studies on demographic change and tropical forest
species.
4
1.5. Nearest Neighbor Characteristics
Structural characteristics of forest stand can be describe as the distribution
characteristics of individuals of the same species, which is typically represented by
different diameters and tree ages. In a given space, population structure is vulnerable to
isolation from other populations within the same community, therefore, for any tree species
in a mixed forest, interspecific and intraspecific differences in tree size, species mingling
and distribution patterns may be the most important characteristics of population structure.
Distribution patterns directly reflect the way individuals assemble or scatter in space,
which may in turn be associated with conditions of competition and utilization of
environmental resources among adjacent trees. Tree size is directly related to the degree of
maturation of a tree population and to the competitive advantage of the population within
the community, it may also be directly related to the survive viability and ecological niche
of the population. Intraspecific aggregation involves isolation between species in the same
community, and the process is close to seed dispersal, regeneration capacity and growth.
A number of methods for describing forest structural attributes have been largely
developed for decades. However, an exact description of small-scale structural attributes is
considered to be increasingly importance. Recently, new individual tree indices, such as
uniform angle index, species mingling and dominance (Gadow et al.1999; Hui et al. 1999),
have been developed. The basic idea of these indices is to characterize the neighborhood of
a reference tree by its using n-nearest neighbors. The techniques of nearest neighbor
statistics allow us determining the relationship within neighborhood groups of trees such as
species and size class at small scales. This method has several advantages over using
expression frequency to depict the attributes among individuals when compared to the
traditional methods. For instance, greater inhomogeneity in species and homogeneity in
size classes indicate greater structural diversity (Gadow et al. 2012).
5
Our overall goal is to characterize spatial attributes of neighborhood trees by applying
the current techniques of nearest neighbor statistics. For a better understanding of
structural units, we combined three structural units for each species in analyses, such as
mingling-uniform angle index, mingling-dominance and dominance-uniform angle index.
6
CHAPTER 2 - MATERIALS AND METHODS
2.1. Study site
This study was conducted in the Kon Ha Nung region of Vietnam‟s Central
Highlands, a region with one of the highest amounts of forest cover (50% of the total land
area) (Nguyen, 2009). The total forest area in Kon Ha Nung is approximately 126,000 ha,
most of which is classified as moist evergreen forests (Le, 1996; Ho, 1999). These forests,
in one of the major production forest areas in Gia Lai Province (Joern, 2010), are
considered to be an area of exceptional biological and cultural diversity (Pollard, 2005).
However, forest cover in the central highlands has declined in recent years from 53,9% in
1999 to 50,9% in 2012 (FPD, 2013). Increasing demands for forest products such as
timber, non-timber products, and firewood. It is possible to put more pressure on some of
the remaining forest areas. However, the secondary forest area is increasing (Le, 2012).
But without exception, the rate of deforestation in Kon Ha Nung remains high, leading to a
decline in overall forest quality (Le, 1996; Ho, 1999; Joern, 2010). As a result, increased
concern about the remaining forests must be protected and forest disturbance restored.
7
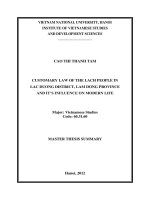
Figure 2.1 The location of the study site in Gia Lai Province, Central Highlands of
Vietnam.
In the early 1980s, Kon-Nung Experimental Station (KES) forests were subjected
to a variety of exploitation intensities, creating a condition from high impact to low-impact
untreated forest (Le, 1996). Ho, 1999). However, understanding the effects of logging on
forest structure, diversity, and restoration processes in Kon Ha Nung is limited (Vu, 1985),
perhaps due to the complexity of the forest and the time is relatively long - the next stage
appears. Knowledge of the long term impacts of selective logging on forest structure, plant
species composition and natural regeneration in Kon Ha Nung forest is needed.
Furthermore, it is unclear whether ecological consequences may occur in these forests in
the long term. Although the current level of logging is sustainable enough to ensure SFM,
it is unclear. To develop silvicultural concepts and potential species components for longterm management, restoration of wet evergreen forest in Kon Ha Nung and knowledge of
the structure, regeneration and dynamics of this forest after logging should be clarified.
8
In order to solve these problems, several initial investigations were carried out by
establishing permanent sample plots and repeating tree measurements. However, the data
on growth rate obtained from these experiments were either unavailable or insufficient to
interpret values for the entire lifespan of tropical trees (Le, 1996; Ho, 1999). Therefore, to
address the raised questions, designing and conducting experiments that monitor forest
response to different logging intensities over prolonged periods of time is necessary as an
efficient approach for determining the details of such changes in these forests.
The results of this study mainly derived from long-term permanent plots, focusing
on the structural recovery of forests over time through the observation of changes in
species composition, mortality, recruitments, and other variables pertaining to forest
structures. The research findings are expected to contribute to practical procedures for
forest management activities as well as the maintenance of diverse forest functions in
Vietnam. In addition, this study aims at contributing to the improvement of sustainable
management for Kon Ha Nung‟s forests.
The current study took place in the Kon Ha Nung forests of K‟Bang District,
belonging to Gialai Province, Central Highlands of Vietnam (Figure 2.1). The study site is
located in Northeastern Gialai Province (14°00‟ - 14°30‟ N and 108°17‟ - 108°44‟ E) (Ngo
Van Cam, 2015).
2.2. Topography and soil
Topography
The topography in K‟Bang District tends to become gradually lower from west to
east and from north to south. The district is mainly characterized by ridges of hills around
700 m a.s.l in elevation (Le, 1996; Joern, 2010); the western part of the study area includes
medium and high hills, whereas the eastern part consists of small hills and some plainlands. These hills have narrow valleys with slopes usually not exceeding 25° (Le, 1996).
9
Kon Ka Kinh is the highest mountain in the area under scrutiny; it is located in Western
K‟Bang District and has an altitude of 1,748 m.
Soil
According to Le (1996), four main soil types are found in K‟Bang District:
I.
Haplic nitisols, which is developed from acidic magma parent rock and has
medium soil horizons;
II.
Rhodic ferralsols, developed from neutral to alkaline magma parent rock
and with a deep humus layer and a high humus ratio;
III.
Plinthic ferralsols, formed in valleys as a result of alluvial deposits; and
IV.
Ferralic acrisols originating from granite parent rock. The composition and
distribution of soil types varies among areas. Other soil types are recorded
but in small amounts.
Climate
The study area is located in a tropical monsoon zone (Le, 1996); climatic data
recorded over a 20-year period (from 1990 to 2010) were collected at Vinh Son
Meteorology and Hydrology station (Table 2.2), located about 12 km from the study site.
There are two distinct seasons in the study site (Le, 1996; Ho, 1999): the rainy season is
from April to November, while the dry season is from December to March. The mean
annual temperature is 23.6oC. The warmest months of the year are usually June and July,
when the highest air temperatures can reach 29.6oC. The lowest air temperatures (usually
around 13.6oC) are recorded in January - December (Nguyen et al., 2011).
10
Table 2.2 Climatology information of the study site (Nguyen et al., 2011; NCEF, 2014)
Months
Temperature (o Rainfall (mm)
C)
No. of days Air humidity
with rainfall
(%)
January
February
March
April
May
June
July
August
September
October
November
December
Total
Average
19.4
20.5
22.6
25.3
26.5
27.1
26.9
26.6
25.5
22.8
21.1
19.6
6
4
3
5
14
11
10
12
17
17
17
14
130
40
23
46
80
231
188
169
235
311
318
270
131
2,042
84
84
82
82
80
77
75
77
84
86
86
85
82
23.6
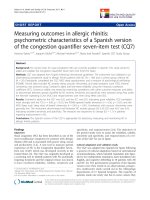
Annual rainfall is 2,042 mm, and more than 90% of total rainfall occurs during the
rainy season. The maximum monthly average observed rainfall in October was 318 mm; In
February, this figure is less than 40 mm. The average monthly humidity is 82%.
Figure 2.3 Climate diagram of Vinh Son, near the study site, data recorded from 1990
to 2010 (Nguyen et al., 2011).
11
2.3. Forest resources
In K'Bang district, the forest covers an area of 126,000 ha (Sub-FiPi, 1999),
accounting for 68% of the total land area. Most vegetation types are classified as tropical
moist evergreen forests (Le, 1996; Ho, 1999; Sub-FiPi, 1999) are commonly found
between elevations of 500-900 m. However, there are also very small montane forests on
mountain peaks and ridges over 900 m at altitudes (Le, 1996, Pollard, 2005). The forest
cover in K'Bang district is much higher than in other parts of Vietnam (68% compared to
only 39.9% of the national forest area). However, only about 20% of these are considered
"rich" forests; Other areas are covered by "medium", "poor" and plantation (PPC, 2008). In
terms of functional forest classification, 36% of forests (or about 48,000 hectares) are
classified as "special use", 10% (about 13,000 hectares) of protection forest and 54%
(about 72,000 hectares) is "production". Forest (Ngo Van Cam, 2015).
According to Pollard (2005), K‟Bang District is an area of exceptional biological
and cultural diversity; as such, K‟Bang has been recognized by many national and
international conservation organizations as hot spot for biodiversity in Vietnam (Pollard,
2005), one that combines the characteristics of four floristic regions: Indian, Malaysian,
Sino-Himalayan, and Indochinese. According to data from the Sub-FiPi in Quy Nhon City,
Binh Dinh Province (Ngo Van Cam, 2015), 546 vascular plants belonging to 376 genera
and 122 families have been recorded in Kon Ha Nung forests. Of these species, 201 are
woody, 120 are medicinal plants, and 48 are classified as “other” and can, for example be
used for ornamental purposes.
Regarding forest management, most of the forest area in K'Bang district is under
the direct management of local government agencies, including 8 state forest enterprises,
national parks, nature reserves and Forest test station (PPC, 2008). Provincial governments
have responded to local forest management in accordance with the plan approved by
MARD (MARD, 2006). Like other natural forests in the central highlands, forests in
12
K'Bang district are commercial benefits for timber production (i.e. medium and large trees)
and are one of the main production forests in the province. Gialai (Joern, 2010). The total
volume of timber harvested in 1980 was 65,000 m3, and increased gradually, reaching its
peak in 1988 with more than 123,000 m3. Timber output has since declined; In 1997,
logging was banned in almost all natural forests in Vietnam and the volume of timber
harvested was estimated at 20,000 m3 per year from 2000 to 2010. Currently, logging
permits are only granted. In some small areas of great mass.
2.4. History of silvicultural and forest management practices in the study site
Kon Ha Nung Experiment Station (KES) was established in 1980 as an experimental
site for the study of tropical and forestry forests, including silvicultural practice. KES is
managed by the Tropical Forest Research Center (TFRC) of the Forest Science Institute of
Vietnam (VAFS) and is covered by 1,400 ha of forest. The same forest formation in all
study areas before logging in 1980, and the silvicultural treatments to be applied during the
course of this study were “selected cutting with natural regeneration” (Ho, 1999). The
difference in elevation in the KES is less than 20 m, leading to homogeneous topographical
conditions in the study site.
In 1980, different logging intensities consisting of low (i.e., extracted timber was less
than 30% standing volume) and high (30% - 50% standing volume) were carried out in a
part of the KES. The remaining areas (around 100 ha) are considered unlogged. The forests
were well protected after logging and no harvesting or serious damage to them has been
done, with the exception of some unusual activities by the local people who have been
known to collect non-timber forest products.
The logging operations are as follows: First, the tree is marked with consecutive
numbers using the yellow plastic card, and then cut with a chain saw. Deltas are mainly
controlled and carried along or on slopes for their proximity to transport. Loggers used
bulldozers to construct roads, sideways, timber piers and transport timber outside the
13
system by winches. After logging, no other treatments (egg, cutting, climbing, grafting of
non-commercially valuable species, and removal of the hairs of logged logs) are carried
out.
2.5. Data collection and analysis
2.5.1. Sampling design
This study was part of a project begun in 2004 to assess the species composition, forest
structures, natural regeneration, and forest dynamics in some of the main forest ecosystems
of Vietnam. This project aimed to evaluate the impacts various silvicultural treatments
have on natural forests logged in the past. To achieve these objectives, a stratified random
sampling was combined with field observations to represent the entire range of stands. The
three forest types in this study are ranked according to the degree of past disturbance (Ho,
1999) and can be described as follows:
Unlogged (UF)
Low-impact Logging (LIL), where the standing volume extracted was less than
30% of the total standing volume
High-impact logging (HIL), where logging ranged from 30% to 38% of the total
standing volume.
For each of three forest types UF, LIL, HIL one-ha permanent sample plots (PSPs)
were established in 2004.
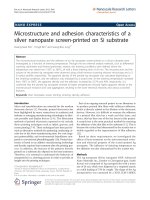
In each forest types, one ha sample plot (100 x 100 m) was established, and was
further divided into 25 subplots of 20 m x 20 m each (Figure 2.5). These plots are aligned
north. The corners are clearly marked with concrete beams (15 cm x 15 cm x 75 cm) and
marked on the site map using the Garmin GPSMAP-76 CSx. Using these measured posts
as a reference, „hip-chain‟ threads were used to create the 20 by 20 m grid over the plot,
where each thread carrier started out on a compass bearing but was called to the correct
14
post 25m ahead by an individual. The procedures for establishing, measuring, and
maintaining such study plots were recommended by Alder and Synnot (1992).
Figure 2.5 Layout of a 1 ha sample plot.
Data were collected in fixed sample plots, all trees with DBH ≥ 10cm were
numbered and marked with red paint. Tree placement is also mapped and linked to a GIS
database (MapInfo professional 11.0). Field work is done with the following rules:
Species were identified directly in the field. In case of unidentifiable stems, specimens
including leaves and/or flowers, fruits and bark were taken for further identification by
taxonomists in Laboratory.
15
-
Total tree height was measured by a mechanical-optical device (Blume- Leiss
altimeter).
-
Tree diameter was measured at 1.3 m height above ground by using tape.
The data were offered by Dr. Ngo Van Cam, Tropical Forest research Center, Pleicu,
Gialai.
2.5.2. Data analysis
Importance Value Index
Importance Value Index (IVI): is a measure of how dominant a species is in a given
forest area.
IVI (%) = (Relative density + relative Basal area)/2
Relative density (RD) is the number of individuals per area as a percent of the
number of individuals of all species.
Relative basal area is the total basal area of Species A as a percent of the total basal
area of all species.
Diversity indices
The Shannon-Wiener index is an information statistic index, which means it
assumes all species are represented in a sample and that they are randomly sampled. In the
Shannon index, p is the proportion (n/N) of individuals of one particular species found (n)
divided by the total number of individuals found (N), ln is the natural log, Σ is the sum of
the calculations, and s is the number of species.
( )
∑
The Simpson‟s index is a dominance index because it gives more weight to
common or dominant species.
( )
16
∑
In this case, a few rare species with only a few representatives will not affect the
diversity. In the Simpson index, p is the proportion (n/N) of individuals of one particular
species found (n) divided by the total number of individuals found (N), Σ is still the sum of
the calculations, and s is the number of species.
Species evenness refers to how close in numbers each species in an environment is.
Mathematically it is defined as a diversity index, a measure of biodiversity which
quantifies how equal the community is numerically. The evenness of a community can be
represented by Pielou's evenness index:
()
Nearest Neighbour statistics
Species mingling (M): describes the species composition and spatial pattern of forest
trees. It is defined as the proportion of the n nearest neighbours that are different species
from the reference tree (Figure 2.6a).
∑
vj = 1 if neighbor j is not the same species as reference tree i, otherwise vj = 0.
Dominance (U): describes the size differentiation between a reference tree and its four
nearest neighbors. It is defined as the proportion of n nearest neighbors that are smaller
than reference tree (Figure.2.6b).
∑
vj = 0 if neighbor j is smaller than reference tree i, otherwise vj = 1.
Uniform angle index (W): describes the degree of regularity for the four nearest neighbors
as reference tree. It is defined as the proportion of angle () smaller than the standard angle
0 (Figure.2.6c).
17
∑
Wi = 1 if j<0, otherwise Wi = 0, 0= 360°/(n+1).
Figure 2.6: Definition of the spatial parameters: Mingling (a), Dominance (b) and
Uniform Angle Index (c).
The methods described above were implemented by using softwares Past 3.0
(Paleontological STatistics), Microsoft Excel and Crancord ( To
eliminate the edge effect of the estimates in Mi, Wi and Ui calculation, we applied the
nearest neighbor edge correction method proposed by Pommerening & Stoyan (2006).
18
CHAPTER 3 - RESULTS AND DISCUSSION
3.1. Tree species diversity and composition
Simpson diversity
Simpson index
1
0,9 0,9 0,9
0,9 0,9 0,9
0,9 0,9 0,9
UL
LIL
HIL
0,8
0,6
0,4
0,2
0
2004
2008
2012
Figure 3.1. Simpson diversity indices of three forest types from 2004-2012.
Comparing three forest types shows that Simpson diversity indices tend to same with
the levels of disturbance (UL, LIL, and HIL) from D= 0.9.
Compare for each forest type through time, we can see UL has no change in Simpson
index for 3 years (2004-2012), D=0.9
LIL has no change in Simpson index for 3 years (2004-2012), D=0.9
HIL has no change in Simpson index for 3 years (2004-2012), D=0.9
Shannon-Weiner diversity
3,95
3,9
3,9
3,9
Shannon index
3,9
3,85
3,8
3,8
3,8
3,8
3,8
3,8
3,75
3,7
3,7
3,65
3,6
UL
LIL
2004
2008
HIL
2012
Figure 3.2. Shannon diversity indices of three forest types from 2004-2012.
19
Comparing three forest types shows that Shannon indices tend to increase with the
levels of disturbance (UL, LIL, and HIL) from H= 3.7 to 3.9.
Compare for each forest type through time, we can see UL has no change in Shannon
index for 3 years (2004-2012), H= 3.8
In LIL, Shannon indices tend to increase from 2004-2008 (from H= 3.7 to 3.8) after
that it is no change with H= 3.8.
HIL has Shannon index higher than 2 different forest types (UL= 3.8, LIL= 3.8) but, it
has tend to same for three years (2004-2012) with H= 3.9
Evenness diversity
0,62
0,61 0,61
0,61
Evenness index
0,6
0,6
0,59 0,59
0,59
0,58 0,58
0,58
0,58
0,57
0,57
0,56
0,55
UL
LIL
2004
2008
HIL
2012
Figure 3.3. Evenness diversity indices of three forest types from 2004- 2012.
Comparing three forest types shows that Evenness indices tend to increase with the
levels of disturbance (UL, LIL, and HIL) from J= 0.57 to 0.61.
Compare for each forest type through time, we can see UL tend to increase for 3 years
(2004-2012), J= 0.58 to 0.6.
In LIL, Shannon indices tend to same from 2004-2008 (from J= 0.59) after that it
decrease with J= 0.59 to 0.57
HIL has Evenness index higher than 2 different forest types (UL= 0.6, LIL= 0.59) but,
it tend to decrease from 2008- 2012 with J= 0.61 to 0.58
20
Number of species
Species richness:
100
90
80
70
60
50
40
30
20
10
0
89
77
77
79
75
74
UL
2008
93
79
LIL
2004
88
HIL
2012
Figure 3.4. Species richness of three forest types from 2004 - 2012
Comparing three forest types shows that species richness tend to increase with the
levels of disturbance (UL, LIL, and HIL) from 74 to 93(number of species).
Compare for each forest type through time, we can see UL change in species richness
for 3 years (2004-2012), species = 77 to 79(number of species).
In LIL, species richness tend to increase from 2004-2012 with species = 74 to
79(number of species).
HIL has species richness higher than 2 different forest types (UL= 79, LIL= 79) from
species = 89 to 93(number of species).
Tree abundance
800
Number of trees
700
600
626 619
672
649 641 674
529 503 537
500
400
300
200
100
0
UL
LIL
2004
2008
HIL
2012
Figure 3.5. Tree abundance of three forest types from 2004- 2012.
21
Comparing three forest types shows that Tree abundance tend to increase with the
levels of disturbance (UL, LIL, and HIL) number of trees= 503 to 674(number of trees).
Compare for each forest type through time, we can see UL has change in Tree
abundance for 3 years (2004-2012), number of trees= 529 to 537(number of trees).
In LIL, Tree abundance tend to decrease from 2004-2008 (from number of trees = 626
to 619) after that it tend to increase from 2008-2012 with number of trees= 619 to
672(number of trees).
HIL has Tree abundance tend to decrease from 2004-2008 (from number of trees = 649
to 641) after that it tend to increase from 2008-2012 with number of trees= 641 to
674(number of trees).
Important Value Index (IVI)
UL:
2004: 17.27AG + 9.81GP + 5.01BH + 4.85WP + 0.10 DF + 0.10PB + 0.10SL
2008: 17.49AG + 10.75GP + 4.99BH + 4.55WP + 0.11DR + 0.10SL + 0.10DF
2012: 17.14AG + 10.25GP + 4.72 BH + 4.32 WP +0.11PN + 0.103PB + 0.101LD
Note:
AG- Aglaia gigantea; GP- Garuga pierii; BH- Baccaurea harmadii; WP- Wendlandia
paniculata; DF-Dimocarpus fumatus; DR- Diospyros rubra; PN- Polyalthia nemoralis;
SL- Symplocos lucida; LD- Lansium domesticum, PB -Podocaropus brevifolius
Almost dominant trees species composition does not change over time.
HIL:
2004: 7.13MB + 5.18DC + 5.17Ms + 4.65Qs + 4.32NB + 4.03As + 3.78Ss + 2.99Ds +
0.09AP + 0.09MA + 0.09Ns
2008: 7.24MB + 5.42DC + 4.87Qs + 4.59Ms + 4.37NB + 3.82Ss + 3.48As + 2.99Ds
+0.09AP + 0.09MA + 0.09Ns
22