Soil erosion and overland flow response to clear cutting of acacia hybrid plantation in headwater catchment of hoa binh province
Bạn đang xem bản rút gọn của tài liệu. Xem và tải ngay bản đầy đủ của tài liệu tại đây (2.38 MB, 40 trang )
MINISTRY OF AGRICULTURE AND RURAL DEVELOPMENT
VIETNAM NATIONAL UNIVERSITY OF FORESTRY
STUDENT THESIS
SOIL EROSION AND OVERLAND FLOW RESPONSE TO CLEAR
CUTTING OF ACACIA HYBRID PLANTATION IN HEADWATER
CATCHMENT OF HOA BINH PROVINCE
Major: Natural Resources Management
Faculty: Forest Resource and Environmental Management
Student: Nguyen Van Cong
Student ID: 1553090035
Class: K60 – Natural Resources Management
Course: 2015 – 2019
Advanced Education Program
Developed in collaboration with Colorado State University, USA
Supervisor: Assoc. Prof. Bui Xuan Dung
Ha Noi, 2019
ACKNOWLEDGEMENT
First and foremost, to be able to conduct this research, we would like to
express our sincere respect to our supervisor - Assoc. Prof. Dr. Bui Xuan Dung for his
enthusiastic and patient support with invaluable comments. In addition, we appreciated
the support of other lectures during the time we analyzed the data.
Not only that, many thanks are due to our friends when we started to collect
and analyze data. They always give our team the support whenever we needed. In
terms of difficulties, the transport to study sites was hard without our companions.
Lastly, I express my gratitude to local people who own the Acacia
plantation model for allowing us to conduct this research in this site. They also
informed us about the weather which extremely support us to get the data.
i
CONTENTS
ACKNOWLEDGEMENT ............................................................................................ i
LIST OF FIGURES .................................................................................................... iv
LIST OF TABLES....................................................................................................... v
ABBREVIATIONS .................................................................................................... vi
ABSTRACT .............................................................................................................. vii
CHAPTER I ................................................................................................................ 1
INTRODUCTION ....................................................................................................... 1
CHAPTER II ............................................................................................................... 4
GOAL AND OBJECTIVES ........................................................................................ 4
2.1. Goal................................................................................................................... 4
2.2. Objectives .......................................................................................................... 4
CHAPTER III .............................................................................................................. 5
STUDY SITE AND METHODS ................................................................................. 5
3.1. Study Site .......................................................................................................... 5
3.2. Methods............................................................................................................. 6
3.2.1. Legacy data ................................................................................................. 6
3.2.2. Installing monitoring plot ............................................................................ 7
3.2.3. Survey time ................................................................................................. 8
3.2.4. Rainfall and soil physical characteristics measurement. ............................. 10
3.2.5. Runoff and Soil erosion measurement ....................................................... 12
3.2.6. Vegetation observation measurement ........................................................ 14
3.2.7. Topographic survey: Slope, coordinate system and altitude of four plots are
measured by using GPS and compass. ................................................................. 14
3.2.8. Data Analysis: Data was processed by using Microsoft excel and SPSS. ... 15
CHAPTER IV ............................................................................................................ 16
RESULTS AND DICUSSION................................................................................... 16
4.1. Soil physical factors and vegetation on study sites. .......................................... 16
4.2.
Precipitation characteristics .......................................................................... 16
4.3. Response of surface runoff to clear cutting Acacia plantation. ......................... 18
4.4. Response of soil erosion to clear cutting Acacia plantation .............................. 22
ii
V. CONCLUSIONS, LIMITATION AND RECOMMENDATION .......................... 26
5.1. Conclusions ..................................................................................................... 26
5.2. Limitation ........................................................................................................ 26
5.3. Recommendation ............................................................................................. 26
REFERENCES
iii
LIST OF FIGURES
Figure 3. 1. The map of study site: ............................................................................... 6
Figure 3. 2. Establishing plot model ............................................................................. 7
Figure 3. 3. Location of 2 plots .................................................................................... 8
Figure 3. 4. Harvesting Acacia process ....................................................................... 9
Figure 3. 5. Two plots before cutting ........................................................................... 9
Figure 3. 6. Two plots after cutting .............................................................................. 9
Figure 3. 7. Rain gauge site ........................................................................................ 10
Figure 3. 8. Porosity measurement process ................................................................ 11
Figure 3. 9. Surface runoff measurement process ....................................................... 12
Figure 3. 10. Soil erosion measurement process ......................................................... 13
Figure 3. 13. Excel and SPSS software ...................................................................... 15
Figure 4. 1. Storm events ........................................................................................... 17
Figure 4. 2. Precipitation, surface runoff at 2 plots before and after cutting................ 18
Figure 4. 3. Precipitation, runoff coefficient at 2 plots before and after cuttin ............ 19
Figure 4. 4. Precipitation accumulation, runoff accumulation at 2 plots before and after
cutting........................................................................................................................ 20
Figure 4. 5. Correlation of surface runoff between 2 plots before and after cutting .... 21
Figure 4. 6. Precipitation, soil erosion at 2 plots before and after cutting.................... 22
Figure 4. 7. Precipitation accumulation, soil erosion at 2 plots before and after cutting
.................................................................................................................................. 23
Figure 4. 8. Correlation of soil erosion between 2 plots before and after cutting ........ 24
iv
LIST OF TABLES
Table 4. 1. Observation plots characteristic at the study site ...................................... 16
Table 4. 2. Precipitation, API7 and rainfall intensity on study sites after cutting ........ 17
Table 4. 3. Surface runoff, runoff coefficient analysis between 2 plots before and after
cutting........................................................................................................................ 19
Table 4. 4. Independent samples t-test for the response of surface runoff to clear
cutting........................................................................................................................ 20
Table 4. 5. Soil erosion analysis between 2 plots before and after cutting .................. 22
Table 4. 6. Independent samples t-test for the response of soil erosion to clear cutting
.................................................................................................................................. 23
Table 4. 7. TCVN 5299: 2009 - Method for determination of soil erosion by rainfall 24
v
ABBREVIATIONS
API7
Antecedent precipitation index for 7 days
Cm3
Cubic centimeter
g
gram
mm
millimeter
hr
hour
df
Degree of freedom
GPS
Global position system
ha
Hectare
P-value
Probability
R2
Coefficient of determination
RUSLE
Revised Universal Soil Loss Equation
SPSS
Statistical Package for the Social Sciences
USA
United States of America
Std. Deviation
Standard Deviation
TCVN
Vietnam standard
vi
ABSTRACT
To assess the response of surface runoff generation and soil erosion to clear
cutting of Acacia plantation in headwater catchment of Hoa Binh province, 2 plots (15
m2/plot) of Acacia plantation 5- year- old were set up and monitored in 2 periods from
22 April,2018 to 12 May, 2019 (before cutting and after cutting) with 70 storm events
in Truong Son commune, Luong Son district, Hoa Binh province. The main finding
included: Surface runoff and runoff coefficient in plot 2 (0.26 mm/15m2/storm and
0.56%/15m2/storm)
were
higher
than
plot
1(0.1
mm/15m2/storm
and
0.23%/15m2/storm) after cutting. Besides, after cutting, the amount of soil erosion in
plot 2 (309.27 g/15m2/storm) was also higher than plot 1 (240.37 g/15m2/storm). The
correlation of surface runoff and soil erosion between 2 plots had strong relation after
cutting (p<0.00).
Key words: Acacia plantation model, bare land, field study, headwater,
runoff generation, soil erosion, period.
vii
CHAPTER I
INTRODUCTION
Land is not only an extremely valuable resource, but also an important
component of the natural environment.
Moreover, Land is the main source of
agriculture and forestry. However, according to the data of the Ministry of Agriculture,
the mountainous area in the North of our country is annually lost about 1cm of surface
soil. Especially in the Northwest region, it takes up to 3cm of topsoil, equivalent to
about 150 - 300 tons of land / ha (Dao Chau Thu, 2006). The amount of soil is lost, the
nutrients in the soil are also reduced, affecting the quality of local people's forests,
resulting in socio-economic losses.
Surface runoff arises when precipitation intensity is greater than infiltration. On
the other hand, when surface flow appears, it usually leads to soil erosion, so the
process of generating surface flow has certain effects on soil erosion. Soil erosion has
long been recognized as a major cause of soil degradation in mountainous areas
(Nguyen Tu Siem and Thai Phien, 1999). Soil erosion is a natural phenomenon, but
this phenomenon is happening more and more serious. It not only significantly affects
the ecosystem, degrades the structure of forest soil and watersheds, but also directly
affects the productivity of forestry cultivation and the livelihood of local people and
the people in the downstream areas. According to the results announced by H.Eswaran
et al (2001), the manufacturing capabilities of some areas in the world will be reduced
to 50% due to erosion and desertification; “In South Asia, cereal production fell by
about 36 million tons per year due to water erosion equivalent to $ 5.4 billion; At
global level, the surface of the earth loses 75 billion tons of land annually, equivalent
to the economic value of 400 dollars billion, In per capita, every citizen on Earth loses
approximately 70 USD/years” (H.Eswaran et al., 2001).
The process of generating surface runoff and soil erosion is a complex process.
The soil erosion is determined by various factors such as rainfall, rainfall intensity, soil
properties, topography and vegetation (Vo Dai Hai, 1996, Nguyen Van Dung and Tran
Duc Vien, 2005; et al., 2009).
In which, vegetation is considered an important
contributing factor in soil protection, reducing surface runoff and erosion (Pham Van
1
Dien, 1998; Vo Dai Hai, 1996; Castillo et al., 1997, Canton et al., 2001, Vo Dai Hai,
2006; Miyata et al., 2009). In general, natural forest land has the ability to penetrate
and retain water well due to its high water consumption, strong roots rooted deep into
the soil, while natural forests also have a thick mat of thick soils, from which soil
erosion was significantly reduced (Bonell, 1998; Descorix et al., 2001). The
coefficient of surface runoff where no tree is 0.23%, where no tree but having carpet is
0.085%, and where having tree is 0.028%. Soil erosion also depends on high tree
canopy layer (Pham Van Dien, 1998; Nanko et al, 2006). The more canopy layer in
forest, the more ability to retain water and soil as possible, forest with a canopy layer
has soil erosion rate three times higher than the forest with three canopy layers (Vo
Dai Hai, 1996). The previous study also showed that in species of different plants, the
ability to regulate water, reduce erosion is different (Vo Dai Hai, 1996, Chao Thi Yen,
2014; Bui Xuan Dung, 2016). There have been many domestic and foreign researches
on the importance of vegetation to reduce soil erosion and surface runoff (ex. Ligdi.
Etafa Emama, R.P.C. Morgan, (1995), Morgan, R.P.C. (2007). But when raising the
question of the impact of mining on soil erosion, the literatures and research thesis
about this issue are very limited.
In Vietnam, about 24% of the forest area is planted forest, of which Acacia
hybrid is a popular crop, bringing high economic value (Ministry of Agriculture and
Rural Development, 2012). Acacia hybrid, also known as hybrid, is a species of plants
indigenous to Northern Queensland (Australia), found in Indonesia's Irian Jaya,
Maluku (Doran and Skelton, 1982). This is a fast-growing species, which is widely
used for various purposes such as timber, firewood, agroforestry, land improvement
(Turnbull et.al, 1983). From the economic and social benefits of Acacia, Acacia
plantations are expected to increase annually (Ministry of Agriculture and Rural
Development, 2012). Besides, Acacia forest also plays an important part in protecting
the surface and structure of forest land, reducing soil erosion from heavy storms.
Truong Son commune, Luong Son district, Hoa Binh province has a total natural
area of 3,060 ha; in which agricultural and forestry land is 2,728 ha; non-agricultural
land 152 ha; Unused land is 180 hectares. Luong Son district is located in the midland
2
region - the transition area between the delta and the mountains, so the terrain is very
diverse. The low mountainous terrain has an average height of about 200 - 400m
formed by magmatic rocks, limestone and terrigenous sediments, with a dense network
of rivers and streams. Truong Son commune, Luong Son district, Hoa Binh province is
a land with suitable natural conditions
for the development of Acacia plantations.
Through the local people, most of the people in the area depend on afforestation.
Currently, there are 75 households in the village, 322 people mainly live on forest
planting.
Acacia is a high-value forestry tree, trusted by many people and planted on a
large scale. But in one place, if planting many continuous cycles can lead to soil
degradation, poor nutrition, then will affect crop yields. In addition, in many places,
the exploitation method for Acacia forests is mostly clear cutting, so there will be a
long time when the land is vacant and insufficient coverage. During recovery process,
the soil is easily washed away, eroded when rainfall and storms. But nowadays, there
is no study and data related to effects of harvesting forest on soil erosion. To further
clarify this issue, i have conducted a study on: “Soil erosion and overland flow
response to clear cutting of Acacia hybrid plantation in headwater catchment of
Hoa Binh province.”
3
CHAPTER II
GOAL AND OBJECTIVES
2.1. Goal
The goal of this project is contributing to provide scientific and practical basis to
minimize the generation of surface runoff and the amount of soil eroded by forest
planting and harvesting activities in Headwater catchment of Vietnam.
2.2. Objectives
Identify the effects of forest harvesting on the generation of surface runoff in
the study area.
Identify the effects of forest harvesting on soil erosion from Acacia hybrid
plantation model in the study area.
Proposing solutions to minimize the negative impact of clearly cutting Acacia
forest on soil and water environment in the study area.
4
CHAPTER III
STUDY SITE AND METHODS
3.1. Study Site
The study was conducted in Truong Son commune, Luong Son district, Hoa Binh
province. Truong Son commune covers an area of 30.64 km², with a population of
1871 people in 1999 and a population density of 61 persons / km².
About topography, Luong Son district in the midland - where the transition
between the delta and mountainous, so the terrain is very diverse. The low
mountainous terrain is approximately 200-400m in height, formed by magma,
limestone and terrigenous sediments, with a dense network of rivers and streams.
Luong Son climate is tropical monsoon, with cold winters - less rainfall; hot
summer - heavy rain. The average temperature of the year is 22.9 - 23.30°C. The
average rainfall is from 1,520.7 to 2,255.6 mm / year, but unevenly distributed during
the year and even during the season is very erratic. “The average precipitation is 276 –
322 mm/month. Each year, there are at least 2 Typhoons that affect the area, the wind
velocity is about 30m/s. The rainfall is unevenly distributed, mainly occurs on in some
months during the rainy season, it can generate huge amount of runoff, causing flood
and seriously landslide and erosion.” (Linh, 2017).
5
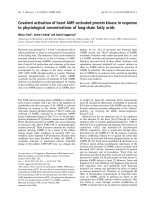
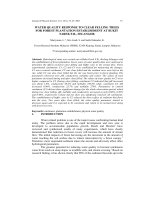
Figure 3. 1. The map of study site:
a) Location of Hoa Binh province on Viet Nam map; b) Location of Luong Son
district on Hoa Binh map; c) Location of Truong Son commune on Luong Son district
3.2. Methods
3.2.1. Legacy data
The data was inherited from previous science thesis: “Runoff generation and soil
erosion from different age of Acacia Plantation forest in Truong Son Commune,
Luong Son district, Hoa Binh province, Vietnam” (Chin Kolyan, 2018)
6
3.2.2. Installing monitoring plot
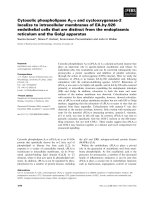
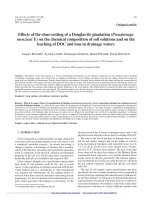
Figure 3. 2. Establishing plot model
a. Aluminum trough (collect soil erosion); b. Plastic pipe (conduct water
from trough to bucket); c. Border (prevent water outside); d. Bucket
(contain surface runoff)
We took 2 plot samples, standard plots were protected and had clear boundaries.
The area of each plot is 15m2 (3m x 5m).
The border of plots was built by aluminum plates. The aluminum plates’ foot was
buried at least 10cm deep to ensure it can withstand heavy winds and heavy rains.
Aluminum plates was 30cm high to prevent rain splash, held and reinforced to stand
upright by steel wires and bamboo piles. The plots were perpendicular to the contour
line. At the down slope end of each plot, an aluminum trough was inserted connecting
to a plastic pipe to transport overland flow and sediment to the buckets used to hold
water and soil after each storm. The aluminum trough had a plate to cover the trough
7
in order to prevent rain splash and rainfall from outside. After finished establishing
plot, we set the rain gauges beside these plots to measure the precipitation. The rain
gauges were set far from the tree canopy to avoid interception from overlying canopy.
3.2.3. Survey time
I set up 2 plots of Acacia plantation 5 –year –old and then, I divided survey
process into 2 phases: In Phase 1, the data was collected by Mrs. Chin kolyan in 6
months (from 22 April to 3rd September, 2018); in this phase, the trees in 2 plots was
not cut. In phase 2, the data was collected by Mrs. Ngoan (student at Standard
program) and me in 3 months (from 21st February to 12 May, 2019); when the trees in
plot 1 was not cut, besides the trees in plot 2 was clear cut; In phase 2, I implemented
full steps of harvesting process (cutting trees, burning and planting new trees).
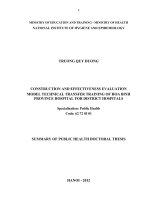
Figure 3. 3. Location of 2 plots
8
Figure 3. 4. Harvesting Acacia process
Figure 3. 5. Two plots before cutting
Figure 3.6. Two plots after cutting
9
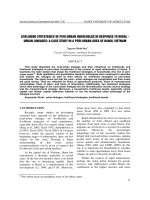
3.2.4. Rainfall and soil physical characteristics measurement.
a. Precipitation measurement
Rainfall was monitored by using US standard plastic rain gauge. Precipitation
was recorded each storm event in amount of water fall into the rain gauge from the
beginning to the end of the storm. An inter-storm period was defined as a period of at
least 6 hours without rain (Yen, 2014). Because the amount of overland flow decrease
quickly after precipitation, a 6-hr period without precipitation was sufficient to
distinguish storm events (Dung et al, 2011).
Figure 3.7. Rain gauge site
b. Soil moisture measurement
Using the Antecedent precipitation index for 7 days (API7) to determine the soil
moisture for each storm event was also figured out.
(
()
10
)
API (i): Precipitation index of the i dates
i: Daily number of days to calculate precipitation index (before) (API) (I € 1-n)
i, j must satisfy condition 0 ≤ i - j ≤ 10
n: number of days in whole observation period
Pj: The corresponding rainfall of rainy day j. If there is much rain on the jth day, it will
be equal to the total number of rains on that day. Any Pj that satisfies the condition 0 ≤
i - j ≤ 10 will be accrued into the API of the i th date in accordance with the above
equation. Outside this area, the rainy day will not affect the API of the ith day.
c. Soil properties measurement
We use Dry Bulk Density Tube to collect soil in order to determine bulk density.
Firstly, remove grass on the surface, use a hammer to close the density pipe with a
height of 6cm and a diameter of 6cm to the ground, note that the edges should be
closed and closed in the vertical direction. Then dug that land up into a tight plastic
bag to mark the location of the standard plots, weigh and record it all and then dry it
up.
Figure 3. 8. Porosity measurement process
i)
Dry Bulk density (D) is the weight of a unit volume of a loose material (such as a
powder or soil) to the same volume of water (g/cm3). Calculated by using the formula:
D=
In which:
D: Dry Bulk density (g/cm3)
M: Weight of dry land in its natural state (g)
11
V: The volume (cm3)
ii)
Porosity of the soil is the ratio of the pores in the soil compared to the volume
of soil. The porosity of the soil is determined by the particle density and the Dry Bulk
density of the soil. Porosity is calculated by using the formula:
X% =
* 100
In which:
d: is the particle density (g / cm3)
D: is the bulk density (g / cm3)
Because we only knew bulk density, so we can assume particle density is equal to 2.56
g/cm3 (Liesch, 2013)
Soil moisture content (%): Determination of soil moisture following steps
Step 1: Weigh the aluminum box, (W1) (g)
Step 2: Weigh soil and aluminum box, we got W2 (g)
Step 3: After 24 hours drying in an oven at a temperature of 105⁰C, weight soil and
aluminum and we got W3 (g). Calculated according to the following formula:
W% =
* 100
Soil depth was measured by measuring tape, we excavate the soil profile (surface cut
straight from the ground down to the bare rock layer.) then used the tap to have the
depth of soil.
3.2.5. Runoff and Soil erosion measurement
a. Surface runoff measurement
Figure 3. 9. Surface runoff measurement process
12
We collected water from buckets after each storm then use graduated cylinder to
directly measure amount of runoff from each plot.
Surface runoff coefficient = (𝑇𝑜𝑡𝑎𝑙 𝑎𝑚𝑜𝑢𝑛𝑡 𝑜𝑓 𝑠𝑢𝑟𝑓𝑎𝑐𝑒 𝑟𝑢𝑛𝑜𝑓𝑓) / (𝑇𝑜𝑡𝑎𝑙
𝑝𝑟𝑒𝑐 𝑝 𝑡𝑎𝑡 𝑜𝑛) * 100%
b. Soil eroded measurement
Soil eroded also came with surface runoff to the buckets, so after each storm, we
waited for soil to settled down to the bottom of the bucket then took the water to
cylinder to measured, the soil was left in the bucket would be collected then bring to
the laboratory as well as the soil from troughs and pipes in each plot. The soil then
dried in laboratory and weighted to determine the amount of soil erosion.
Figur������������������������������������������������������������������������������������������������������������������������������������������������������������������������������������������������������������������������������������������������������������������������������������������������������������������������������������������������������������������������������������������������������������������������������������������������������������������������������������������������������������������������������������������������������������������������������������������������������������������������������������������������������������������������������������������������������������������������������������������������������������������������������������������������������������������������������������������������������������������������������������������������������������������������������������������������������������������������������������������������������������������������������������������������������������������������������������������������������������������������������������������������������������������������������������������������������������������������������������������������������������������������������������������������������������������������������������������������������������������������������������������������������������������������������������������������������������������������������������������������������������������������������������������������������������������������������������������������������������������������������������������������������������������������������������������������������������������������������������������������������������������������������������������������������������������������������������������������������������������������������������������������������������������������������������������������������������������������������������������������������������������������������������������������������������������������������������������������������������������������������������������������������������������������������������������������������������������������������������������������������������������������������������������������������������������������������������������������������������������������������������������������������������������������������������������������������������������������������������������������������������������������������������������������������������������������������������������������������������������������������������������������������������������������������������������������������������������������������������������������������������������������������������������������������������������������������������������������������������������������������������������������������������������������������������������������������������������������������������������������������������������������������������������������������������������������������������������������������������������������������������������������������������������������������������������������������������������������������������������������������������������������������������������������������������������������������������������������������������������������������������������������������������������������������������������������������������������������������������������������������������������������������������������������������������������������������������������������������������������������������������������������������������������������������������������������������������������������������������������������������������������������������������������������������������������������������������������������������������������������������������������������������������������������������������������������������������������������������������������������������������������������������������������������������������������������������������������������������������������������������������������������������������������������������������������������������������������������������������������������������������������������������������������������������������������������������������������������������������������������������������������������������������������������������������������������������������������������������������������������������������������������������������������������������������������������������������������������������������������������������������������������������������������������������������������������������������������������������������������������������������������������������������������������������������������������������������������������������������������������������������������������������������������������������������������������������������������������������������������������������������������������������������������������������������������������������������������������������������������������������������������������������������������������������������������������������������������������������������������������������������������������������������������������������������������������������������������������������������������������������������������������������������������������������������������������������������������������������������������������������������������������������������������������������������������������������������������������������������������������������������������������������������������������������������������������������������������������������������������������������������������������������������������������������������������������������������������������������������������������������������������������������������������������������������������������������������������������������������������������������������������������������������������������������������������������������������������������������������������������������������������������������������������������������������������������������������������������������������������������������������������������������������������������������������������������������������������������������������������������������������������������������������������������������������������������������������������������������������������������������������������������������������������������������������������������������������������������������������������������������������������������������������������������������������������������������������������������������������������������������������������������������������������������������������������������������������������������������������������������������������������������������������������������������������������������������������������������������������������������������������������������������������������������������������������������������������������������������������������������������������������������������������������������������������������������������������������������������������������������������������������������������������������������������������������������������������������������������������������������������������������������������������������������������������������������������������������������������������������������������������������������������������������������������������������������������������������������������������������������������������������������������������������������������������������������������������������������������������������������������������������������������������������������������������������������������������������������������������������������������������������������������������������������������������������������������������������������������������������������������������������������������������������������������������������������������������������������������������������������������������������������������������������������������������������������������������������������������������������������������������������������������������������������������������������������������������������������������������������������������������������������������������������������������������������������������������������������������������������������������������������������������������������������������������������������������������������������������������������������������������������������������������������������������������������������������������������������������������������������������������������������������������������������������������������������������������������������������������������������������������������������������������������������������������������������������������������������������������������������������������������������������������������������������������������������������������������������������������������������������������������������������������������������������������������������������������������������������������������������������������������������������������������������������������������������������������������������������������������������������������������������������������������������������������������������������������������������������������������������������������������������������������������������������������������������������������������������������������������������������������������������������������������������������������������������������������������������������������������������������������������������������������������������������������������������������������������������������������������������������������������������������������������������������������������������������������������������������������������������������������������������������������������������������������������������������������������������������������������������������������������������������������������������������������������������������������������������������������������������������������������������������������������������������������������������������������������������������������������������������������������������������������������������������������������������������������������������������������������������������������������������������������������������������������������������������������������������������������������������������������������������������������������������������������������������������������������������������������������������������������������������������������������������������������������������������������������������������������������������������������������������������������������������������������������������������������������������������������������������������������������������������������������������������������������������������������������������������������������������������������������������������������������������������������������������������������������������������������������������������������������������������������������������������������������������������������������������������������������������������������������������������������������������������������������������������������������������������������������������������������������������������������������������������������������������������������������������������������������������������������������������������������������������������������������������������������������������������������������������������������������������������������������������������������������������������������������������������������������������������������������������������������������������������������������������������������������������������������������������������������������������������������������������������������������������������������������������������������������������������������������������������������������������������������������������������������������������������������������������������������������������������������������������������������������������������������������������������������������������������������������������������������������������������������������������������������������������������������������������������������������������������������������������������������������������������������������������������������������������������������������������������������������������������������������������������������������������������������������������������������������������������������������������low
and soil erosion in plot 2 increased dramatically while plot 1 only changed slightly.
5.2. Limitation
•
Limited experience in establishing plot and collecting data. So, the
implementation process is flawed and lacks professionalism.
•
The process of setting up plots in the study site is quite difficult (topography,
hard soil for digging, difficulties in equipment preservation, high risk, complicated
roads ...).
•
Limited in equipment and funding, so it is not possible to conduct research on
large scale.
5.3. Recommendation
With the above results, we can see that the exploitation of plantation forests has a
significant influence on the surface runoff and soil erosion, especially in the upstream
26
areas. And this is an alarming issue that need to be found a reasonable solution to
reduce surface runoff and the amount of soil erosion.
Barrier construction is a popular method to prevent soil erosion. This method
uses barriers made from ordinary materials such as wood, branches or bamboos lined
up in horizontal rows and fixed to the contour line.
In addition, local people can use stones to build walls. The purpose is to divide
the slope into smaller sections to reduce the flow of force down the foothills. The
distance between these obstructions depends on places with different gradients. If the
slope is high, the distance between walls is 3-4m; if the slope is low, the distance
between them can be from 5-6m.
For areas with medium depth, we can dig a horizontal trench along contour lines.
The purpose is to prevent soil eroded from being washed away, these trench also
reduce the overland flow, so that more water infiltrates into the soil results in retain
moisture longer when the storm events stop. Trenching and barriers along contour
lines must be conducted simultaneously. Moreover, we can build wide terraced fields
to prevent erosion. This method is very effective but it takes a lot of time and effort to
build.
For long-term, local people should extend planting time. Instead of after 5-6
years the local people exploit and plant young trees, they can keep for 7-8 years to
bring about wood's quality and minimize land degradation and soil erosion. At the
same time, they should change their forest harvesting method from clear cutting to
selected cutting and thinning. Avoid bare hills, then the forest land will be affected by
the rainfall, increasing surface runoff, degenerating, eroding and reducing soil's
nutrient.
Besides, the government also needs to implement policies to support people in
afforestation to increase wood's quality that helps improve the lives of local people,
and at the same time, they also should apply science in finding new plant species that
have growth time longer and economic value higher than Acacia hybrid.
27
REFERENCES
1. Bonell, M., 1998. “Selected challenges in runoff generation research in forests
from the hillslope to headwater drainage basin scale” 1. Jawra J. Am. Water
Resour. Assoc. 34, 765–785.
2. Chao Thi Yen, 2014. "Assessing the effect of vegetation cover on soil flow and
erosion in Luot Mountain, Vietnam National University of Forestry ". Graduated
from the Vietnam National University of Forestry.
3. Chin Kolyan, 2018. “Runoff generation and soil erosion from different age of
Acacia Plantation forest in Truong Son Commune, Luong Son district, Hoa Binh
province, Vietnam”. Master thesis in forest science from the Vietnam National
University of Forestry.
4. Dao Chau Thu, 2006. “Soil degradation due to erosion. Consequences and
solutions”. PhD thesis, Water Resources University, Hanoi.
5. Doran, J.C., and Skelton, D.J. 1982. “Acacia mangium seed collections for
international provenance trials”. Forest Genetic Resources Information No. 11,
FAO, Rome.
6. Dung. B.X, M.., Gomi..., 2011. “Effect of forest thinning on overland flow
generation on hillslopes covered by Japanese cypress.” Ecohydrology 4, pp. 367–
378.
7. Ligdi, E.E., Morgan, R., 1995. “Contour grass strips: a laboratory simulation of
their role in soil erosion control”. Soil Technol. 8, 109–117.
8. Linh, N.M., 2017. “Runoff generation and soil erosion from forest road in the
headwater of Vietnam”. Graduated from the Vietnam National University of
Forestry.
9. Ministry of Agriculture and Rural Development, 2012. “Information of forestry
situation”.
10.
Nguyen Tu Siem and Nguyen Thai Phien, 1999. “Upland Soils in Vietnam:
Degradation and Rehabilitation”. Hanoi: Agriculture Publishing House.
11.
Pham Van Dien (1998), "Initially studying the hydrological characteristics of
some forest vegetation as a basis for establishing the standards of water retention
in the critical area of Hoa Binh Hydropower Plant." Master thesis on forestry
science. Forestry University.
12.
Turnbull, J.W., Boland, D.J, Doran, J.C., and Gunn, B.V. 1983. “Handbook on
Seeds of Dry-Zone Acacias”. FAO, Rome.
13.
Vo Dai Hai, 1996, "Research on the Structural Forms for Watersheds in
Vietnam". PhD thesis on agricultural science. Forest Science Institute of Vietnam,
Hanoi.
APENDIX
Surface
runoff
Precipi
Period
Date
tation
(mm)
API7
(mm)
Runoff
coeficient
Plot
Plot
Plot
Plot
1
2
1
2
Soik erosion (g)
Plot 1
Plot 2
22/4/2018
32,0
0,00
0,11
0,18
0,34 0,58
235,22
155,33
cutting 25/4/2018
43,5
10,70
0,20
0,23
0,45 0,54
235,45
155,78
30/4/2018
35,7
8,70
0,12
0,20
0,35 0,56
235,65
156,13
02/05/2018
28,8
11,90
0,10
0,13
0,36 0,46
235,79
156,49
03/05/2018
24,8
21,50
0,09
0,11
0,38 0,43
235,89
156,87
08/05/2018
29,0
14,00
0,11
0,12
0,38 0,41
236,01
157,25
12/05/2018
54,0
10,80
0,21
0,29
0,38 0,54
236,30
157,63
13/05/2018
7,3
59,80
0,00
0,00
0,00 0,00
236,30
157,63
16/5/2018
10,9
16,00
0,03
0,04
0,31 0,37
236,34
157,94
18/5/2018
42,0
15,90
0,19
0,44
0,45 1,05
236,79
158,39
19/5/2018
5,0
54,50
0,00
0,00
0,00 0,00
236,79
158,39
21/5/2018
12,0
18,70
0,04
0,05
0,33 0,43
236,84
158,72
24/5/2018
5,7
12,00
0,00
0,00
0,00 0,00
236,84
158,72
26/5/2018
34,5
6,00
0,18
0,28
0,52 0,81
237,12
159,24
27/5/2018
83,6
38,30
1,27
0,51
1,52 0,61
237,63
160,76
28/5/2018
6,1
108,50
0,00
0,00
0,00 0,00
237,63
160,76
29/5/2018
20,0
46,60
0,05
0,06
0,23 0,30
237,69
160,99
30/5/2018
14,5
60,40
0,00
0,00
0,00 0,00
237,69
160,99
01/06/2018
14,2
37,90
0,00
0,00
0,00 0,00
237,69
160,99
02/06/2018
59,5
44,00
0,79
0,52
1,33 0,88
238,21
162,32
04/06/2018
54,5
41,60
0,16
0,27
0,29 0,50
238,48
162,61
06/06/2018
6,5
47,00
0,00
0,00
0,00 0,00
238,48
162,61
09/06/2018
2,5
21,50
0,00
0,00
0,00 0,00
238,48
162,61
10/06/2018
25,5
13,20
0,15
0,10
0,61 0,39
238,58
163,22
11/06/2018
7,5
35,80
0,01
0,02
0,09 0,29
238,61
163,31
14/6/2018
5,0
9,30
0,00
0,00
0,00 0,00
238,61
163,31
16/6/2018
19,5
8,60
0,05
0,03
0,27 0,17
238,64
163,58
Before