Small scale spatial variability of water infiltration and its influencing factors
Bạn đang xem bản rút gọn của tài liệu. Xem và tải ngay bản đầy đủ của tài liệu tại đây (645.09 KB, 35 trang )
Contents
Acknowledgements
Abstract
1. Introduction ....................................................................................................................... 1
2. Review of literature ........................................................................................................... 4
2.1. Variability of hydraulic conductivity (Ks)...................................................................... 4
2.2. Role of vegetation cover ................................................................................................. 4
3. Methods ............................................................................................................................. 7
3.1. Site conditions ................................................................................................................ 7
3.2. Soil samples .................................................................................................................... 9
3.2.1. Soil dry bulk density..................................................................................................... 9
3.2.2. Experimental design and infiltration measurements .................................................. 10
4. Results ............................................................................................................................. 12
4.1. Infiltration rates ............................................................................................................ 12
4.1.1. Infiltration rate of soil under shrub site ..................................................................... 12
4.1.2. Infiltration rate of soil under plantation forest site .................................................... 13
4.2. Asymptotic infiltration.................................................................................................. 14
4.2.1. Asymptotic infiltration of soil under shrub area ....................................................... 14
Table 4.21: Asymptotic infiltration of soil under shrub area ............................................... 14
4.2.2. Asymptotic infiltration of soil under forest plantation .............................................. 15
5. Discussion ....................................................................................................................... 18
Limitations of using ring infiltrometer ................................................................................ 19
6. Conclusions ..................................................................................................................... 20
References ............................................................................................................................ 21
Acknowledgements
First of all, I would like to express my deepest gratitude with special thanks to
MSc. Phi Dang Son for his guidance and encouragement. Similarly, I am so grateful and
thankful to Prof. Lee McDonald for his guidance. To complete the research I also received
a lots of helps from Dr. Le, Dr. Bui Xuan Dung and Ms. Huyen who work in the
Laboratory of Vietnam Forestry University, therefore I would like to say thank you to all
of them for lending me the equipment to measure the parameters of my thesis. . Finally, I
would thank all friends and everybody who contributed to this thesis.
Abstract
This research was conducted to examine the small scale variability of infiltration
and the effect of the lower vegetation layer (under plantation forest and shrub) on the water
infiltration characteristics using the single ring infiltrometer method on Luot Mountain.
Infiltration rate was measured under plantation forest and shrub with 3 replicates for each
type of vegetation. Findings of this study showed the asymptotic infiltration rate of soil
under shrub area ranges from 1.6 to 2.5 higher than that under plantation forest. Soil
porosity and infiltration rate have a positive relationship.
1. Introduction
The role of water as a driver of erosion has received considerable scientific study.
The loss soil due to erosion, much stronger than the creation of soil in a natural process, a
few centimeter of soil can be lost only after some rains, thunderstorm or cyclone while to
get a few inches of soil. That should take hundreds of years, even thousands of years to
create amount of soil.
Infiltration is the process by which water on the soil surface penetrates the soil. The
infiltration capacity of soil determines the amount of water which will go into the soil and
the amount of water which will become runoff (Hillel, 1982). Therefore, the water
infiltration rate can be considered as an important soil property which significantly
influences the amount of surface runoff and subsequently soil erosion and water quality.
Quantifying the soil infiltration capacity is of great importance to understand and predict
the hydrologic behavior of a system.
Water infiltration and movement in soil are controlled by the characteristics of pore
space in soil, which are determined by the soil physical properties such as soil texture,
aggregate stability, cracks and crusts at the soil surface. The presence of macro pores and
the consequently high soil porosity promote the infiltration process. Other soil properties,
such as the soil organic matter content, soil biological activities have strong effects on the
soil structure and therefore they have impacts on the water infiltration. Plant roots are also
proved to enhance the water infiltration rate by creating channels within the soil.
Until now, soil conservation researches were aiming at erosion control. However,
soil protection also needs more knowledge about the impacts of vegetation type on other
indicators, such as water infiltration into the soil profile. Therefore, more concentration is
1
required on the strong relationship between the vegetation cover types and their influences
on water infiltration into soil.
The land cover (forest, shrubs) have different impacts on the infiltration capacity
and water storage in the soils. The knowledge about these relationships is very important to
prevent or minimize soil water erosion and to guarantee high infiltration rates that will be
beneficial under different climatic conditions. In the case of humid region facing excessive
rainfalls, increased soil infiltration capacity results in the storage of a great proportion of
precipitation, reducing overland flows and flooding occurrence. Whereas, in the arid areas
where the rainfall is limited, high soil infiltration capacity keeps most of rainwater inside
the soil preventing water loss by surface runoff and evaporation. The presented study is a
contribution to the investigations on factors influencing the water infiltration capacity of
forest soil.
In Vietnam, the research on infiltration capacity of the soil is often accompanied by
research forest hydrology, soil erosion, and surface runoff. So far, there is few researches
worked detail in infiltration capacity of the soil. The majority of studies address only the
flow velocity in one aspect is a factor influencing erosion and surface runoff. Therefore,
research on infiltration is necessary to provide good data for future researches in hydrology
at the site, to estimate spatial variability of infiltration rates and identify the effects of
vegetation types on the infiltration capacity of the soil. Originating from that problem I
have chosen the topic” Small-scale spatial variability of soil water infiltration and its
influencing factors”
It is assumed that the water infiltration characteristics would be varying
significantly even within a relatively small scale as a result of those controlling factors
evenly under the same vegetation cover.
2
Objectives
- To examine the variability of infiltration rate at a small scale
- To identify the effects of vegetation types on the infiltration capacity of the soil
- To provide field data for future researches on hydrology at the site Kết thúc cuộc trò
chuyện
3
2. Review of literature
2.1. Variability of hydraulic conductivity (Ks)
Saturated hydraulic conductivity is one of the most important parameters for soilwater-plant interactions, water and solute movement and retention through the soil profile.
It is a critically important parameter for estimation of various other soil hydrological
parameters necessary for modeling the flow through the naturally unsaturated vadose
zone. Among different soil hydrological properties, the Ks is reported to have the greatest
statistical variability by several authors (Biggar and Nielsen, 1981; Hern and Melancon,
1986; Webb et al., 2000). The variability of Ks is associated with soil types, land uses,
positions on landscape, depths, instruments and methods of measurement and
experimental errors (Stockton and Warrick, 1971). It has been suggested that more studies
are required on the variability of Ks across different landscapes. The variability of Ks has
a profound influence on the overall hydrology of the soil system. Therefore, focus of this
review is centered on the variability of saturated /unsaturated hydraulic conductivity due
to a large number of factors.
2.2. Role of vegetation cover
Many studies on streamflow in the world have shown the result that it often
accounts for 1-3% of the total rainfall. This is a low rate compared to other water balance
components. Many forest hydrologists observed that, in many cases amount of streamflow
of bigger diameter trees is less than the small ones. This may be due to differences in way
branching by water in the amount falling down from the canopy of trees on the top floor to
the lower layer.
Soil hydrologic condition is the result of interactions between soil and vegetation.
Infiltration rate and sediment yield integrate these factors and are good indicators of
hydrologic condition (Thurow, 1986). Vegetation succession is the results of interactions
between soil and vegetation, which induced changes in soil hydrology. One consequence
4
of this change is the amelioration of soil (Fisher 1990) resulting in an alteration of the
hydrologic characteristics of the site (Thurow 1991). Under the cover of the vegetation,
the accumulation of organic matter and the moderation of soil microclimate (Kittredge
1948). The enhanced soil structure that results from these factors improves infiltration.
The type and extent of vegetation are of primary importance in determining the
amount and timing of infiltration and surface runoff (Dabrowolski et al. 1990). Vegetation
contributes to determine interception, infiltration, runoff, and erosion processes (Gifford
1985, Wood 1988, Calder 1993). Plants disperse raindrop energy, increase infiltration,
reduce surface runoff velocity, filter sediment from runoff, and bind soil particles
(Wischmeier and Smith 1978). The effect of plant cover in processes like interception,
infiltration, and runoff can be expressed as a simple function of percentage of water that is
intercepted by plants and the percentage of plant cover (Armstrong and Mitchell 1988). At
the soil surface, plants and litter reduce the impact of rainfall energy and then increase
infiltration and reduce surface runoff (Thompson and James 1985).
Vegetation influences infiltration through the reduction of raindrop impact and the
subsequent maintenance of favorable soil conditions for infiltration. Soil texture, structure,
and pore volume directly affect infiltration. Maintenance of good soil structure, especially
at the soil surface, will greatly increase the infiltration rate of water. Temperature, seasons
of the year and slope also have some minor influence on infiltration.
Plant cover probably has the greatest impact on infiltration which in turn defines
other hydrologic processes such as surface runoff, percolation, and detention, as well as the
erosion processes (Gifford 1985, Wood 1988, Wood and Eldridge 1993). Plant cover
influences some of the rainfall properties as drop size and spatial distribution, which in
turn are important factors for infiltration, surface runoff, and soil detachment (Armstrong
and Mitchell 1988).
5
Plant cover is an important parameter in water distribution within a watershed
because: plants intercept raindrops and then reduce surface sealing and soil detachment by
raindrops; plant stems and litter increase surface roughness and hydraulic resistance, and
decrease surface runoff velocity; and plant roots bind soil and diminish soil erodability
(Wischmeier and Smith 1978, Branson et al. 1981, Abrahams et al. 1988, Johnson and
Gordon 1988, Brooks et al. 1991).
Consequently, infiltration rates are often observed to vary under different life forms
(Blackbum 1975; Wood 1981; Knight 1984; Thurow, 1986). Recently, number of studies
demonstrated the effect of increasing cover of ground-storey plants, particularly grasses,
on reducing runoff and erosion (Pressland, 1982; Eldridge, 1993). Perennial plants are
generally more effective than annual or ephemeral plants (Eldridge, 1992).
Vegetation or plant cover is the percentage of ground surface covered with plant
material, and must be referred to only as the vertical projection of the vegetation parts onto
the ground, such vegetation is the one in which a person is interested (Barbour et al. 1987,
Causton 1988, Bonham 1989). Plant canopy depth is the distance from the top of the
canopy to the bottom of the canopy (Armstrong and Mitchell 1988). Plant cover is
normally expressed as a percentage (Causton 1988). Vegetation cover is of special
importance in studies of competition for radiation, nutrients, and soil moisture. Also, plant
cover is very important in studying the water balance of a watershed and the soil water
redistribution.
Scientists just focused on the interception role of lower vegetation cover as a
second or third layer reduces the rainfall intensity. They ignore the role in influencing
water infiltration rate. Therefore, I decided to investigate the role of lower vegetation on
infiltration rate.
6
3. Methods
3.1. Site conditions
The research was conducted in Luot Mountain, which is a part of Vietnam Forestry
University campus and has large area of Pinus massoniana plantation, Imperata
cylindrica grass, and shrubs. The mountain has moderate mountainous terrain with two
small mountains, the upper mountain is 133 meters above sea level and the lower
mountain is 99 meters above sea level. The average slope is relative high with about 15 20 º. Luot Mountain has tropical monsoon climate. The average temperature is 23.9◦C, the
lowest temperature is 17.1◦C in January and the highest temperature is 28.5 ºC in June and
July. Average relative humidity is 81.5%, the highest humidity is 85.5% in March and the
lowest humidity is 78 % in December. Annual precipitation is 1647 mm/year. The highest
precipitation is in July and August above 300 mm and the lowest is 22 mm in December.
Soil is clay loam.
7
Site map
A
Study Site
B
W1
S3
W3
S1
W2
S2
C
D
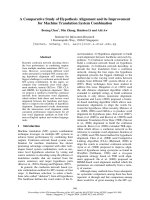
Figure 1: Map of study site
8
A: Map of Luot Mountain
B: Detail study site map
C: Under forest layer with shrubs
D: Under forest layer without shrubs
3.2. Soil samples
3.2.1. Soil dry bulk density
Soil dry bulk density was determined by taking undisturbed soil samples from soil surface
using metal ring-tubes (cylinders) with a volume 106 cm3. From every horizon, 6
replicates were taken. The samples were oven-dried at 105 0C for 24 hours. Before and
after drying, the samples were weighed. Soil dry bulk density was calculated as the ratio
of the mass of oven-dried solids to the bulk or total soil volume according to the following
equation:
Bulk density: ρb = Mm/Vs = Mm/(Va + Vw + Vm)
Where Vs is the total volume of the soil sample, and Va, Vw and Vm are the volumes are
the air, water and mineral components of the soil.
Porosity: Φ = (Va + Vw)/Vs = (1- ρb / ρm)
9
3.2.2. Experimental design and infiltration measurements
A simple pairwise comparison method has been adopted in this study to quantify
the difference in the water infiltration rates at locations of different vegetation cover types
and earthworm activities. A preliminary site study was determined to identify varying
vegetation cover types (forest layer with shrubs vs forest without shrubs).
Vegetation type was a factor in the experiments (under forest layer with shrubs vs
under forest layer without shrubs). Two replicates were made under each treatment making
6 infiltration measurements in total. I labeled them as S1, S2, S3for three points under
forest layer with shrubs, and W1, W2, W3 for three points under plantation forest.
A relatively simple and accurate approach is the ring infiltrometer method. A metal
infiltration ring was pushed into the soil. Water is poured into the ring, and the rate at
which the water soaks into the soil is measured. The water infiltration rate was determined
by a single ring infiltrometer with 25 cm in diameter. The ring infiltrometer was driven 6
cm into the soil. Blows of heavy sledge on block were of medium force to prevent undue
fracturing of soil structure. The wood block was moved around the edge of driving cap
every one or two blows, so the cylinder penetrated the soil surface uniformly, without the
tilting back and forth that results in a disturbance of soil. After installing infiltrometer, nail
(5cm) has been used as a guide for ponding depth. Water was added to the ring and 3 cm
depth of water in infiltrometer was maintained throughout the experiments.
10
The water volume supply to the ring, in order to maintain a constant head, will be recorded
as a function of time and then used for infiltration computation. The average soil
infiltration rate for a given time period will be estimated from the volume of the water
supplied to the ring divided by the area of the ring.
Figure 2. Infiltration measurements
The infiltration rate was calculated by using the following equation:
Volume added water per minute
Cm/min
Infiltration rate =
Infiltrometer’s edge area
11
4. Results
4.1.Infiltration rates
infiltration rate(cm/hr)
4.1.1. Infiltration rate of soil under shrub site
240
220
200
180
160
140
120
100
80
60
40
20
0
S1
S2
S3
5
20
35
50
65
80
95
110
Time(min)
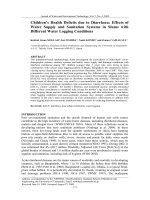
Figure 4.11: Infiltration rates with shrubs
It can be clearly seen figure in 4.11; S1 has the highest infiltration rate in the shrub area
(figure 4.41). Curve S1 almost higher than the two other curves during nearly all
measurement time. The infiltration rates of S2 and S3 are quite similar as to be seen in
figure 4.11
12
4.1.2. Infiltration rate of soil under plantation forest site
90
infiltration rate(cm/hr)
80
70
60
50
W1
40
W2
30
W3
20
10
0
5
20
35
50
65
80
95
110
Time(min)
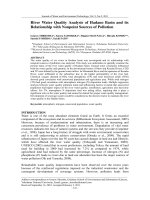
Figure 4.12: Infiltration rates without shrubs
Several key trends are revealed by the figure 4.12 showing the infiltration rates
under forest layer without shrubs. All three points have very similar infiltration rates, but
the quantities or the infiltration rate are different. In general, W1 shows a maximum in
infiltration rate after 5 minutes, while the minimum can be found in W2. From the 105th
minute the infiltration started stabilizing.
13
4.2.Asymptotic infiltration
4.2.1. Asymptotic infiltration of soil under shrub area
Table 4.21: Asymptotic infiltration of soil under shrub area
Location
S1
S2
S3
Infiltration rate
Infiltration rate
Infiltration rate
Time(min)
(cm/hr)
(cm/hr)
(cm/hr)
110
50
33
33
111
54
31
31
112
51
27
32
113
54
26
29
114
49
24
31
115
46
27
28
116
48
24
27
117
45
27
28
118
44
26
28
119
42
26
27
120
42
24
27
48
27
29
Asymptotic
infiltration
Asymptotic infiltration at S1 is 1.8 time higher than infiltration at S2 and 1.7 times at S3
(table 4.21). Asymptotic infiltration of point S2 and S3 are nearly equal (27 and 29 cm/hr).
14
4.2.2. Asymptotic infiltration of soil under forest plantation
Table 4.22: Asymptotic infiltration of soil under forest plantation
Location
W1
W2
W3
Infiltration
Infiltration
Infiltration
Time(min)
rate(cm/hr)
rate(cm/hr)
rate(cm/hr)
110
22
20
16
111
18
17
18
112
20
18
17
113
20
18
18
114
18
17
16
115
20
18
20
116
18
17
17
117
20
17
18
118
18
20
17
119
20
18
17
120
18
16
16
121
18
17
16
19
18
17
Asymptotic
infiltration
From table 4.22, asymptotic infiltration of W1, W2 and W3 only ranges with 2 cm of
difference.
15
4.3. Soil porosity and infiltration rates
Table 4.3: Soil porosity and infiltration rates
Asymptotic infiltration
Cover type
Bulk density
Porosity
(g/cm3)
(%)
No.
rate
(cm/hour)
With shrubs
Without shrubs
S1
1.13
57
48
S3
1.2
56
29
S2
1.17
55
27
W1
1.0
62
19
W2
1.1
58
18
W3
1.16
56
17
Soil porosity was measured from Luot Mountain in two different vegetation cover
types (under shrub area and without shrubs) as shown in Table 4.3 with the highest
porosity of 62 percent and the lowest of about 55 percent. According to the results listed in
Table 4.3, the asymptotic infiltration rates range of soil under shrubs is from 27 to 48
cm/hour compared to 17 to 19 cm/hour nearly two times higher than under forest layer
without shrub. Infiltration rates under forest layer with shrub were significant higher than
under forest layer without shrub. Both infiltration rates of soil under shrub are significant
greater than that under plantation forest. Table 4.3 shows that the asymptotic infiltration
rate of soil under shrub area ranges between 1.6 and 2.5 higher than that under plantation
forest. The variability of infiltration within shrub cover area is ranged between 1.7 and 1.8
times and 1.1 times change in plantation forest.
16
Asymptotic infiltration (Cm/hr)
Asymptotic infiltration (Cm/hr)
50
19.5
R² = 0.9643
19
18.5
18
17.5
17
R² = 0.8242
40
30
20
10
0
54
16.5
55
60
Porosity%)
55
56
57
58
Porosity(%)
65
Figure 4.31: Porosity and asymptotic infiltration
4.32: Porosity and asymptotic infiltration
under plantation forest
under shrub area
The relationship between porosity and asymptotic infiltration of site without shrubs
is best represented by the linear function with coefficient of determination R² = 0.96. a
higher porosity leads to faster infiltration. Under forest layer without shrub porosity is 56
%, the asymptotic infiltration rate is 17 cm/hour. Porosity is 58%; the asymptotic
infiltration rate is 18cm/hour. Porosity is 62%, the asymptotic infiltration rate is 19
cm/hour.
The relationship between porosity and asymptotic infiltration of soil plantation
forest is best represented by the linear function with coefficient of determination R² = 0.82.
A higher porosity leads to the faster infiltration. Under forest layer with shrubs, porosity is
55%; the asymptotic infiltration rate is 26 cm/hour. Porosity is 56%; the asymptotic
infiltration rate is 28cm/hour. Porosity is 58%; the asymptotic infiltration rate is 46
cm/hour.
17
5. Discussion
I will now discuss (a) why infiltration rate under forest layer with shrubs is higher
than under forest layer without shrubs, (b) why infiltration rate at S1 has a strange trend,
(c) limitations and recommendations.
Some studies mentioned effects of vegetation types on infiltration rates such as Pho
(1992), Dzung (1993). They affirmed that forest trees can consume large amount of water.
In addition, they also affirmed forest soil also was a factor that affected permeable
velocity. The higher infiltration rate under forest layer with shrubs is due to the loosening
of surface soil arising from lateral spread of roots. Tree roots aid in improving soil
structure in several ways. One of the most significant plant-induced changes in soil
structure is the formation of continuous macro-pores (i.e., channels) by penetrating roots
(Angers and Caron 1998). A large proportion of pores formed by roots fall into the macropore range (>30 μm) (Gibbs and Reid 1988). These macro-pores facilitate soil aeration and
water percolation and storage as well as create zones of failure, which help fragment the
soil, form aggregates, and decrease resistance for further root growth. Roots form macropores by creating compressive and shear stresses when growing through the soil matrix.
Radial pressure exerted by growing roots compresses adjacent soil (Dexter 1987), which
enlarges existing pores and creates new ones. Bartens et al. (2008) demonstrated that live
roots can create channels through compacted soils and vastly increase water infiltration,
although flow may be greater once roots die and decay (Mitchell et al. 1995). As root
decay occurs, tissue remnants and associated micro-flora coat pore walls, which may
enhance water transport efficiency (Barley 1954; Yunusa et al. 2002)
Point S1 in under forest layer with shrubs did not follow Horton’s law because at
this point there a dead root under soil that made an about 0.3cm diameter hole that
18
enhanced water go through soil faster. There also was a big stone at 10 cm under soil
surface. That leaded to a strange curve as we saw at (Figure 4.11)
Limitations of using ring infiltrometer
Although this method has the advantage of being easy to use and easy to interpret,
it does have its disadvantages. For example, the water inside the infiltration ring often
flows horizontally through the soil as well as vertically, thus giving results greater than
they would be achieved if the flow was confined only to downward movement through the
soil profile. There are ways for correction this but for comparative purposes they are not
necessary. There assumption has to be made that the proportion of the water which moves
sideways is always similar. As only a small area is used, this technique is very sensitive to
worm and root holes and other cracks in the soil. Any crack in the soil surface will result in
much faster flow than would otherwise be achieved. As these cracks are often not visible at
the surface it is not always possible to avoid them when choosing a site.
19
6. Conclusions
I investigated the variability of infiltration and the effects of vegetation types on the
soil infiltration capacity by measuring infiltration rates and soil porosity in two different
vegetation cover types (under plantation forest and shrubs). The vegetation cover types
contribute different role in protecting soil especially forest soil. The research data provided
us a relationship between vegetation cover types and infiltration rates; infiltration rates and
soil porosity. After conducted this project, our findings were that the. The asymptotic
infiltration under forest plantation ranges between 17and 19 cm/hour and between 27 and
48 cm/hour with shrubs present. Findings of this study showed (1) the asymptotic
infiltration rate of soil under shrub area ranges between 1.6 and 2.5 higher than that under
plantation forest; (2) soil porosity and infiltration rate have a positive relationship; (3) the
average initial infiltration rate of soil under shrub is more than 2 times higher than the one
under plantation forest; (4) the variability of infiltration within shrub cover area ranges
between 1.7 and 1.8 times and 1.1 times change in plantation forest.
20
References
Akinbile, C. O. (2010). Comparative Analysis of Infiltration Measurements of Two
Irrigated Soils in Akure, Nigeria. 51-55.
Akinbile, C. O. (2010). Comparative Analysis of Infiltration Measurements of Two
Irrigated Soils in Akure, Nigeria. 51-55.
Akintoye, O. A. (February 2012). The Effects of Landuse on the Infiltration Capacity of
Coastal Plain Soils of Calabar– Nigeria. 81-82.
Angers, D. a. (1998). Angers, D.A., and J. Caron. Plant-induced changes in soil structure:
Processes and feedbacks. Biogeochemistry., 55–72.
Armstrong, C. L. (1988). Plant canopy characteristics and processes which affect
ttansformation of rainfall properties. 1400-1409.
Asante, E. A. (August 2011). EFFECT OF MULCH TYPE, MULCH RATE AND SLOPE
ON SOIL LOSS, RUNOFF AND INFILTRATION UNDER SIMULATED
RAINFALL FOR TWO AGRICULTURAL SOILS IN GHANA . 36-42.
B. Hatchett, M. P. (n.d.). Mechanized Mastication Effects on
SoilCompactionandRunofffromForests in the Western Lake Tahoe Basin. 6-12.
Barbour, M. G. (1987). Tertestrial plant ecology. 2nd edition. The Benjamin/Cummings
Publishing Co., Inc. Melo Park, CA. , 634.
Barley, K. (1954). Effects of root growth and decay on permeability of synthetic sandy
loam. Soil Science Society of America Journal. 205-211.
Barley, K. (1954). Effects of root growth and decay on permeability of synthetic sandy
loam. Soil Science Society of America Journal . 205-211.
Bartens, J. S. (2008). Can urban tree roots improve infiltration through compactedsoils for
stormwater management? . Journal of Environmental Quality, 2048–2057.
Biggar, J. a. (1976. ). Spatial variability of the leaching characteristics of a field soil., 7884.
Blackbum, W. H. (1975). Factors influencing infilttation rates and sediment production of
semi-arid rangelands in Nevada. Water Resource, 929-937. .
Bonham, C. .. (1989). Measurements of tertesttial vegetation. John Wiley and Sons. . New
York, NY, 338.
BRUIJNZEEL, L. (1990). HYDROLOGY OF MOIST TROPICAL FORESTS AND
EFFECTS OF CONVERSION: A STATE OF KNOWLEDGE REVIEW . 45-50.
Calder, I. R. (1993). Hydrologic effects of land-use change,. Maidment D. R. (Ed.),
Handbook of hydrology. McGraw-Hill, Inc. New York, NY., 13.15-13.30.
Causton, D. R. (1988). An introduction to vegetation analysis; principles, practice
andinterpretation. Unwin Hyman Ltd. London, UK, 342.
Chen-Wuing Liu, S.-W. C.-S.-K. (March, 2003). Water infiltration rate in cracked paddy
soil. 173-179.
Dabrowolski, J. P. (1990). Basin hydrology and plant . Osmond, C. B., L. F. Pitelka, and
G. M. Hidy, 280-190.
Dexter, A. ( 1987). Compression of soil around roots. Plant and Soil., 401-406.
Eldridge, D. J. ( 1992.). Runoff and sediment yield from a semiarid woodland in eastem
Australia. I. The effect of pasture type. Aust. Rangel. J., 26-30.
Fisher, R. (1990). Amelioration of soils by trees. . 290-300.
G.E. Osuji, M. O. (2010). Infiltration Characteristics of Soils under Selected LandUse
Practices in Owerri, Southeastern Nigeria. 323-325.
Galawezh B. Bapeer, A. M. (2010). INFILTRATION RATES OF SOILS IN SOME
LOCATIONS WITHIN ERBIL PLAIN, KURDISTAN REGION, NORTH IRAQ.
130-135.
Gifford, G. F. (1985). Cover allocation in rangeland watershed management (A review),.
Gifford, G. F. , 23-31.