Road sediment production and delivery in khang ninh commune ba be bac kan
Bạn đang xem bản rút gọn của tài liệu. Xem và tải ngay bản đầy đủ của tài liệu tại đây (593.88 KB, 28 trang )
MINISTRY OF AGRICULTURE AND RURAL DEVELOPMENT
VIETNAM FORESTRY UNIVERSITY
STUDENT THESIS
ROAD SEDIMENT PRODUCTION AND DELIVERY IN KHANG
NINH COMMUNE, BA BE, BAC KAN.
Major: Advanced Curriculum in Natural Resources Management
Code: D850101
Faculty: Forest Resources & Environmental Management
Student: Hua Huy Luan
Class: K55 Natural Resources Management
Student ID:1054030811
Course: 2010 - 2014
Advanced Education Program
Developed in Collaboration with Colorado State University, USA
Supervisor: Assoc. Prof. Dr. Bui The Doi
Co-supervisor: Prof. Lee H.MacDonald
Hanoi, November, 2014
ACKNOWLEDGEMENTS
I would like to express my very great appreciation to Prof. Lee MacDonald from
Colorado State University and Prof. Bui The Doi from Vietnam Forestry University, my
research supervisors, for their enthusiastic encouragement and useful critiques of this
research work. Without their thoughtful, patient guidance through every step of my
research, their knowledge on how to correct and analyze the data I collected and the
financial support from Prof. Lee, this thesis could not have been realized. Thank to
Vietnam Forestry University and Colorado State University cooperation together
especially faculty of Forest Resource and Environmental Management and all
professors
I would like to extend my thanks to Mr. Bui Van Quang, the Vice Director of Ba Be
National Park for accepting the responsibility of my research in his national park as well
as for his useful and constructive recommendations on this project.
Many other people have contributed to the success of this thesis but I would like to
particularly thank Hua Van Bac, Hua Thi Hop and Kim-Sara Wagner for their support.
Last but not least this thesis could have never been completed without the support of my
mother Mach Thi Noi who always encouraged me during the entire process of doing
research and who let me borrow several tools and her motorbike for collecting all data
in the field.
ABSTRACT
This study used 3 sediment fences to measure sediment production from 3 road
segments for over one month in the wet season in Khang Ninh Village, Ba Be, Bac Kan,
Vietnam. The mean sediment production rate from native surface roads was 0.60 kg/m².
Comparisons among segments showed that recently-graded native surface roads
produced more sediment than ungraded native surface roads. The sediment production
depended on the amount of precipitation, segments slope and especially such as
sediment production on native surface roads was best predicted by the product of road
area times road slope (A*S). Road sediment production can be reduced by rocks and
vegetation, increasing the frequency of road drainage structures, avoiding locations that
generate more road surface and ditch runoff, and minimizing grading and traffic.
Sediment delivery was assessed by a survey of 8 road segments along 2 km of an
unpaved road. 819/m of the surveyed 2000m of this road are directly connected to the
stream. Gully initiation increased with road segment length, side-slope gradients, road
designs that concentrated road runoff and infiltration capacity of the soil. Road sediment
delivery can be minimized by the construction of a drain-ditch or reducing the amount
of runoff processes on the road surface.
CONTENTS
1
INTRODUCTION ...................................................................................................... 1
2
GOALS AND OBJECTIVES .................................................................................... 2
3
METHODOLOGIES .................................................................................................. 3
3.1 Sediment Production .............................................................................................. 3
3.2 Sediment Delivery .................................................................................................. 3
3.3 Survey Surface at 3 Road Segments. ...................................................................... 4
3.3.1 Diameter of Rocks, Gravel and Sand ............................................................... 4
3.3.2 Bulk Density ..................................................................................................... 4
3.4 Comparision to the WEPP Road model. ................................................................ 5
3.5 Site Description ...................................................................................................... 6
4
RESULTS................................................................................................................... 8
4.1 Road segment characteristics ................................................................................. 8
4.2 Precipitation............................................................................................................ 8
4.3 Sediment Production .............................................................................................. 8
4.4 Sediment Delivery ................................................................................................ 13
4.5 Survey of Surface at 3 Road Segments. ............................................................... 14
4.5.1 Diameter of Rocks, Gravel, Sand or Soil ....................................................... 14
4.5.2 Bulk Density ................................................................................................... 15
4.6 Comparision to the WEPP Road model .............................................................. 16
5
DISCUSSION .......................................................................................................... 17
5.1 Experimental Setup Performance ......................................................................... 17
5.2 Data Analysis Performance .................................................................................. 17
5.3 Comparisons to Previous Studies ......................................................................... 18
5.4 Future Research .................................................................................................... 18
6
CONCLUSIONS ...................................................................................................... 20
7
REFERENCES
8
APPENDICES
1
INTRODUCTION
Unpaved roads can contribute a lot of sediment to streams in each wet season,
and accumulated road surface erosion in large rain events can have catastrophic effects,
such as filling in pools and reducing habitat complexity. Road erosion can have a major
impact on stream health with very big amount of sediment, especially surface erosion from
unpaved roads and the adjacent drainage ditches. After heavy rain erosion will occur and
then at the end almost all sediment goes to streams causing more turbidity and sediment
concentrations, and then it does not only change the morphology of the roads but also
changes the size of the rivers or lakes making all of them shallower and narrower. Of
course it will have a bad effect on water quality and plants and animals in the water.
Previous studies have identified that unpaved roads can contribute 50 to 80%
of the sediment that enters streams (Hagans et al., 1986). The amount of sediment
delivered from forests with roads can be more than 300 times greater than from
undisturbed forest land (Morrison, 1975). Roads located close to forest land and near
rice paddies as well as those leading to rural and suburban parcels may also contribute
to sediment problems in a watershed. Data on road erosion and sediment delivery rates
are critical for assessing road impacts on aquatic resources, and a sound understanding
of road erosion processes is needed to minimize road sediment production (Coe, 2006.)
Bac Kan is located in the northeast of Vietnam, 240 km from Hanoi. It is a
developing region of Vietnam, mostly located in high mountains, and the unpaved roads
and poor drainage create big amount of road erosion each year. Especially the steep roads
have a lot of sediment production that deposits to the rice fields, farms, and the river, all
of it has bad consequences for the farmers. To evaluate the consequences of road erosion
it is necessary to make some initial research on road erosion at a specific location. This
thesis study was in Khang Ninh Commune - Ba Be – Bac Kan Province, as there has not
been any study on road sediment production and sediment delivery in this region. So this
thesis will provide information on road surface erosion and sediment delivery.
1
2
GOALS AND OBJECTIVES
The goal of this project is to measure road sediment production and delivery rate
in Khang Ninh Commune, Ba Be, Bac Kan. The objectives were to:
1) Quantify sediment production from three road segments for at least 10 rains
on the road.
2) Determine sediment delivery from 8 road segments for at least 10 rains.
3) Determine the different effects of surface cover (rocked, graveled and noncover) on road sediment production and delivery.
4) Compare the measured road sediment production in Khang Ninh Commune,
Ba Be, Bac Kan to predictions from the WEPP (Water Erosion Prediction Model): Road
model.
2
3
3.1
METHODOLOGIES
Sediment Production
Sediment production rates from three road segments were measured with
sediment fences. Sediment fences constructed at the drainage point of hill slopes or
discrete road segments that have clearly defined contributing areas. (Lee, 2007) They
are made of sacks stitched together and attached to 4-6 poles that are pounded 0.3-0.5 m
into the ground. The leading edge of the sack is attached to the ground with landscape
staples to prevent underflow and also a floor of fabric is put on the ground so it is easy
to remove the sediment. Cleaning out the fence in each rain sediment production is
measured by sediment and weighing it in kilograms. Measurements were taken during
10 rains and the time is marked to know how long the rain took. Rainfalls were
measured by using a Vietnamese rain gage. After each rain sediment productions are
measured by using a scale (kg). A sample of 0.3 Kg was taken after each rain at each of
the sediment fences and spread out in a pan to let it air dry inside a room.
The collected data is the basis for following calculations: we have wet-soil
minus dry-soil and then calculate the percentage of water stored in the wet-soil
(formula: (Water /300 g) * 100 = % of water). To measure how many percent of
sediment are in the water the soil has to be dried in a dry room which is not affected by
wind or other activities until the soil is completely dry and can be split easily. Erosion at
a segment are calculated by:
1. Length * Width = Area (m2)
2. Mass / Area = erosion (kg)
3.2
Sediment Delivery
Sediment delivery will be measured at 8 road segments within 2km2 in Khang
Ninh Commune. The discrete point will be determined and then sediment delivery will
be measured from the road to the end of sediment visibility. Tracking runoff and
3
sediment from each drainage point is necessary to see where it goes. Sediment delivery
equals the total road area connected to the stream multiplied by the amount of soil
(kilogram) that eroded in each rain.
For measuring sediment delivery the collected data was only compared to the
data of sediment fence 1. The reason is that only sediment fence 1 is located on the
investigated road. All along the road the physical characteristics are very similar so a
comparison of the date was very easy. Sediment fences 2 and 3 lie on smaller roads
which still belong to the investigated road, however they show different characteristics
(soil texture, bulk densities and width).
3.3
Survey Surface at 3 Road Segments.
3.3.1 Diameter of Rocks, Gravel and Sand
The diameter of rocks, gravel and sand covering the road were measured at 50
equally- spaced points in each road segment.
In particular, it means that a measuring tape used to identify 50 points on the road, each
of them has to be 50cm apart from the previous one. At each point a sample of road
cover which can either be a rock, gravel or soil were taken to measure the diameter with
a common ruler. This procedure were performed at all three road segments with a total
of 150 measurements.
3.3.2 Bulk Density
Bulk density (p) = mass of dried soil/ Total volume: in this thesis a bamboo tube with
the height of 10cm and a ratio of 2.5cm will be used. For each road segment 1 bulk
density will be calculated by the following steps:
1. Clean soil surface where the soil sample will be taken
2. Use the hammer to pound into ground until the bamboo tube is completely
filled with soil. It is important to put a piece of wood on the bamboo tube
before hammering. The piece of wood will distribute the pressure equally so
that the soil will not be compressed by the hammer.
4
3. Use the shovel to dig out the bamboo tube and put the soil into a plastic bag
and then dry the soil in a dry room to measure the weight
4. With the mass of dry soil and total volume, following calculation will be
done: π*r2*h = V
Precipitation data will be collected with a Vietnamese rain gage in 10 rains. For
each rain the time raining started and stopped will be noted to know how long the
rain lasted.
Use a clinometer to measure the slop segments and measuring tape to measure the
length and width of segments.
3.4
Comparision to the WEPP Road model.
In the WEPP Road Erosion Predictor, Modeling 50 years to get a good
average. Fill slope as little as possible (0.1 ft) and the same slope as the road, and the
buffer also be minimal (0.3 foot). All of the information fill into the WEPP road
modeling was the same condition in the road segment 1,2,3 (gradient, length, width,
surface, traffic, soil texture and climate)
The set of tools that use to were developed by researchers at the USDA Forest
Service (USFS). These tools are all based on the physically-based WEPP (Water
Erosion Prediction Model), which was developed as an alternative to the better known,
but more empirical, Revised Universal Soil Loss Equation (RUSLE). Since the WEPP
model is extremely complex and requires several hundred parameters to run, the USFS
has developed a series of simplified user interfaces to predict erosion from forests,
roads, thinning, fires, peak flows, and the effectiveness of post-fire rehabilitation
techniques. Each interface prompts the user to enter a few key variables, and then these
user-specified variables are used to estimate all the other variables in the WEPP model
( />After run the WEPP: Road Model got the results then Used the precipitation in place,
where I made study devided total precipitation for 50 years and times the road prism
5
erosion, apply to 3 road segments. Took the results compare to the road erosion the Ba
Be, Bac Kan province.
( />3.5
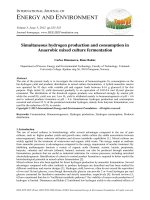
Site Description
The study area is a forest road located in Na Kieng Village near Ba Be
National Park in Vietnam. Na Kieng Village belongs to Khang Ninh Commune, which
is one of seven communes of Ba Be district surrounding Ba Be lake, the largest natural
lake in Vietnam.
Image 1: Location of Ba Be National Park, Vietnam
The study area lies about 14 Km west of the town of Cho Ra, approximately 70 Km
northwest of the provincial capital Bac Kan and 240 Km north of Hanoi, the capital of
Vietnam. The exact coordinates are the following: (22.233°N 105.566°E) and
(22.5166°N 105.733°W).
6
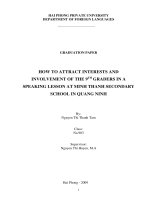
Image 2: Location of the road (yellow) and the sediment fences (red circles)
Elevation of the study site ranges in average about 178 m above sea level. It is
located completely within the South-West Valley of Phiabyior Range with its
characteristic peaks of 1502m and 1517m to 1525m.
Ba Be is to be described as a high-lying region in a tropical or sub-tropical forest with a
characteristic climate for such regions. Compared to other regions in Vietnam it is
rather cool but nevertheless with a high annual average relative humidity of 83%.
Throughout the year the average air temperature is approximately 22°C with a monthly
average temperature ranging from 14.1°C in winter (January) up to 27.5°C in summer
(July). The lowest air temperature ever measured at the study site was 6°C while the
highest air temperature amounts to 39°C.
The mean annual precipitation measured with a Vietnamese rain gage in the north of
Vietnam ranges between 1,500 and 2,000mm per year. Summer months from May to
September are characterized by frequent and heavy rainfall.
7
4
4.1
RESULTS
Road segment characteristics
To measured sediment production I created three sediment fences. Sediment
production was measured from native surface and rocked road segments with a wide
range of road surface areas and road gradients. In the road segment 1 total of length is
67m and width is 3m with the slope is120 and cover about 20% by rock. In the second
segment were measured total of length and width are 77m*2.5m with the slope is 150, it
cover about by 5% of rock. In the last segment total of length and width are 55m*3m
with highest slope is 220. The roads were generally under 15 - 20 years in age.
4.2
Precipitation
Collecting data for 10 rains in July in the rainy season just for one month.
Showing in 2 graphs below, the precipitation have rains number 5,7,8,9 were the big
rains and rains number 1,2,3,4,6,10 were the smaller rain, but in term of the rain
intensity rains number 2,6 and 9 were the big intensity, it is mean that was produced
much sediment with the total of rainfall was 410 mm..
Figure 1&2 Precipitation of 10 rains and intensity.
4.3
Sediment Production
Ten rainfall events were measured for sediment production at 3 road segments
and 8 road segments for sediment delivery in July and early August – 2014. The
number of rainfall events and the amount of sediment production considered for each
plot is reported in table 1:
8
Table 1 the number of rainfall events and sediment production (July and
August/2014)
Rains
Time
Date
(minutes)
Precipitation
(mm)
Fence 1
(67x3m, 12°)
kg
Fence2
(77x2,5m,15°)
kg
Fence3
(55x3m, 22°)
kg
1
2
3
50
26
47
7/8/2014
12/7/2014
13/7/2014
6.9
20.5
8.6
15
108
17.5
23.5
160
26
17
120
19
4
35
18/7/2014
9.2
25.7
59
25
5
1500
20/7/2014
148.5
325.5
358.1
340
6
30
21/7/2014
17
98
146
100
7
420
26/7/2014
98
135
178.5
145
8
240
29/7/2014
60.5
127
155
135
9
10
38
32
3/8/2014
5/82014
32
9.6
118
28
129
62.5
115
30
410.8
998
1298
1046
Total
9
note
Big
rain
From the table 1 and 2 graphs above the different characteristics of each road segment
and the relationship between precipitation and the amount of sediment production per
rain can be seen. We can see that the sediment fence 1 has the largest area: 201 m2 but
the total erosion is the smallest: 998 kg because of the lowest slope compared to the
other fence. 12° from 3 road segments. With slope 15°, more sediment production can
be noted in sediment fence 2. Total area is 192.5m2 and the total of sediment is 1298
kg. At sediment fence 3 had the highest slope of 22°, the smallest area but produced the
largest amount of sediment (1046 kg). From those numbers it can be said that sediment
production depends on precipitation and is most affected by the slope.
10
Table 2: percentage of actual eroded soil and water.
Rain
Water content of sediment
Water content of sediment
Water content of sediment
fence 1
fence 2
fence 3
Wet-
Dry-
Percent of
Wet-
Dry-
Percent
Wet-
Dry-
Percent of
soil
soil(g)
Water
soil(g)
soil(g)
of
soil(g)
soil(g)
Soil
(g)
Water
Water
1
300
220
27
300
190
37
300
210
30
2
300
215
28
300
200
33
300
220
27
3
300
215
28
300
195
35
300
225
25
4
300
215
28
300
190
37
300
195
35
5
300
210
30
300
190
37
300
210
30
6
300
210
30
300
195
35
300
225
25
7
300
210
30
300
190
37
300
210
30
8
300
215
28
300
195
35
300
195
35
9
300
220
27
300
200
33
300
210
30
10
300
220
27
300
200
33
300
210
30
According to table 1 and 2 formulas: Length * Width = Area (m2) and Mass / Area
= erosion (kg) road erosion is calculated per m2 at 3 sediment fences
11
Table 3 Road erosion per m² at 3 sediment fences.
Road erosion per m2 at 3 sediment fences.
Total Sediment/
Total Sediment/
Total Sediment/
Total are(kg)
Total are (kg)
Total are (kg)
Sediment fence 1
Sediment fence 2
Sediment fence3
Precipitation
No.
(mm)
1
6.9
0.07
0.12
0.10
2
20.5
0.54
0.83
0.73
3
8.6
0.09
0.14
0.12
4
9.2
0.13
0.31
0.15
5
148.5
1.62
1.86
2.06
6
17
0.49
0.76
0.61
7
98
0.67
0.93
0.88
8
60.5
0.63
0.81
0.82
9
32
0.59
0.67
0.70
10
9.6
0.139
0.32
0.18
Total
410.8
4.969
6.75
6.35
12
From rain intensity compare to the sediment production of three sediment fences
(kg/m2). Showing that if the rain was short and heavy rain had much sediment
produced, with high rain intensity were have high runoff processes because the water
cannot infiltration much into the soil.
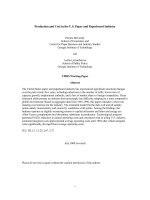
4.4
Sediment Delivery
Within the 8 road segments there are 5 segments which are connected directly
to the stream with a total area of 273* 3 = 819m, and 3 road segments with a total area
of 147 * 3 = 441m were leading directly to the rice paddy and pond with very bad
consequences for the farmers.
The calculation was done in
kilogram of sediment for each
rain that was connected by:
Road erosion per m² in the
sediment fence 1 times 819m
(total area connected) in order
to have sediment delivery in
kilogram, shown in the chart.
Figure 8: Sediment delivery compare to sediment fence 1.
13
4.5
Survey of Surface at 3 Road Segments.
4.5.1 Diameter of Rocks, Gravel, Sand or Soil
Figure 9: Surveyed surface cover segment 1
Figure 10: Surveyed surface cover segment 2
Figure 11: Surveyed surface cover segment 3
14
Road erosion is not only affected by precipitation and slope but it is also affected by the
land cover. In the 3 road segment, segment 1 has the highest diameter of the particles
(according to 3 graphs above) average is 2.1cm. If the diameter of rock or gravel is
large it should have less sediment production. Proved by road segment 1 in the graph
with a total sediment production of 4.969 Kg/m2. In road segment 1 is no vegetation
cover. In road segment 2 the average diameter of rock and gravel is 1.4 cm which can
be produce much sediment (6.75kg/m2). In road segment 3 there is about 5% vegetation
cover and the average diameter of rocks and gravel is 1.5cm with the total amount of
sediment production during 10 rains of 6.35 Kg/m2.
4.5.2 Bulk Density
Total Volumes 196.2 cm3
Weight of dry soil
310g (road
280g(road
240g(road segment
sample in 3 road
segment 1)
segment 2)
3)
1.58 g/cm3
1.43 g/cm3
1.22 g/cm3
segment
Bulk Density
(mass/volume)
Soils with less porosity and will have less infiltration and more runoff. Following
formula mass/volume. it can be seen that at road segment 1 an elevated bulk density of
1.58 g/cm3 was measured. This is affected by the number of vehicles.. In road segment
1 has 432 motorbikes per day are estimated. In road segment 2 bulk density is 1.43
g/cm3.This road is only used by about 3 motorbikes per day since it is only used to
reach the rice paddy so not many people use it. Finally road segment 3 is very steep, so
people just walk on it without any vehicle affecting this segment. In general at all 3 road
segments bulk density is normal, not too dense.
15
4.6
Comparision to the WEPP Road model
According to the table 4 and the chart showing the big difference between the
WEPP road and 3 road segments measured in reality greater than 7 times. It mean that
when measured in the field is much more precise than use the predictor in the website.
Table 4: Compare between WEPP road and 3 road segments:
WEPP Road (kg)
115
222
134
Precipitation (mm)
1700
1700
1700
3 road segments (kg)
998
1298
1046
Precipitation (mm)
410
410
410
Figure 12: Compare WEPP road model with 3 road segments.
16
5
DISCUSSION
During the implementation and analysis of the study several issues had to be
faced.
5.1
Experimental Setup Performance
The basis of the research was the collection of sediment to identify how much
sediment is produced during rains. Normally a sediment fence is built in a U-shape so
that as much sediment as possible can be trapped and no sediment can run around the
fence. In reality this method could
not be applied at two of the three
sediment
fences
that
were
constructed at the unpaved road
near Na Kieng Village. As the
road has a drain-ditch next to it.
So if built a U-shaped fence at that
point would disturb water runoff
in the drain-ditch. Furthermore Image 3: Drain-ditch behind the sediment fences
water coming from the other side of the hill slope would cross the road but then would
also be hindered to runoff with severe effects on the research results. Building a Ushaped sediment fence behind the drain-ditch was not an option either because most
sediment would erode inside the ditch thus could not be caught by the fence. Finally, as
a compromise, two of the three fences were built in the shape of a litter bit straight line
but surely that two sediment fences still trapped all sediment production.
5.2
Data Analysis Performance
Research was done during 10 rains which occurred approximately over one
month. The output are numbers that stress the significance of soil erosion management
on unpaved roads, however those numbers might not be representative enough for
17
further scientific research: This study was the first of its kind in the area of Ba Be
National Park and it only produced data which can be taken as an average for one
month. The results show that soil erosion depends on several factors but one of the most
significant factors is precipitation. Unlike the South, the North of Vietnam lies in a
climatic zone with four seasons making it very hard to predict the climate and weather
conditions. Since research has never been done before in Khang Ninh Commune there
is also no data on precipitation over long time available. With the data collected during
one month in a mostly wet season it is hardly to predict yearly precipitation and
compared to previous studies
5.3
Comparisons to Previous Studies
The mean one month in rainy season sediment production rate for the native
surface road segments ranged from 0.07 up to 2.06 kg m2/ month, the average of three
road segments are 0.60 kg/m2 (table 3). Annual yearly precipitation from the WEPP
road is 1700 mm/year and rainfall for one month is 410mm/month. so calculated by
410/1700 = ¼. So it had 4 * 0.60 kg/m2 = 2.4 kg/m2/year. Road erosion rates for
unpaved roads the present study is 67% of the reported mean erosion rate of 0.48 kg m2
for unpaved roads in the Idaho batholith (Megahan, 1974), the range sediment
production was from 0.13 to 0.99 kg/m2 (JOHN, 2001) The similarity in road erosion
rates for the Sierra Nevada and the Idaho batholith. Looked at the all data above,
showing that the biggest range is in Ba Be Bac Kan province it might be because of the
climate condition made the large difference.
5.4
Future Research
A logical resumption of the study would be to extend the period of data
collection to one year including all four seasons. The data would be better in terms of
quality and could be used for comparison with the WEPP: Road Model as well as
previous studies on road erosion. Sediment production should be measured with more
18
sediment fences (up to 10), each constructed at a different slope to get more
differentiated data. The same applies to sediment delivery which should be surveyed on
more than eight road segments.
In addition it would be useful to measure the velocity on the road surface during heavy
rains when runoff processes occur. Velocity can be a driving key factor for the amount
of sediment produced during the rain and therefore it should be investigated, however
measurements require more time and more specific tools.
19
6
CONCLUSIONS
Over a time span of approximately one month in July and early August 2014,
sediment production and sediment delivery were measured at an unpaved road in Na
Kieng Village, Bac Kan Province, Vietnam.
The results of the study make clear that sediment production does depend on
precipitation. The highest amount of sediment was collected at fence 3 (slope 22°)
although it had the smallest area compared to the other two fences. After long rains with
high rainfall over 350 Kg of sediment could be collected at the fences. Sediment
production depended strongly on road slope and only a little on road area. Recalculating
the results in Kg per m² of road showed that less than 1 Kg sediment/m² of road area
was eroded; however in cases of long rains with heavy rainfall it is possible that up to 2
Kg of sediment erode per m² of road. From the big amount of sediment that affects the
river, making it shallower and narrower with a bad effect on water quality as well as
plants and animals in the water
Looking at sediment delivery, most road segments in the surveyed area
delivered their sediment to the river, stream and lake. However, calculations showed
that during strong rainfall with road erosions of 1,62Kg/m² an alerting amount of
1327Kg of sediment were delivered directly into the adjacent stream. In general a larger
diameter of rocks or sand mean less sediment production. Vegetation cover can
decrease sediment production. Bulk density is affected by the amount of traffic,
frequent passage of motorbikes can increase bulk density from 1,22g/cm³ (segment 3)
up to 1,58g/cm³ (segment 1). In the WEPP road showed lower sediment than the reality
road.
20
7
REFERENCES
1. Hagans, D.K., W.E. Weaver and M.A. Madej. 1986. Long term on-site and off-
site effects of logging and erosion in the Redwood Creek basin, Northern California. In:
Papers presented at the American Geophysical Union meeting on cumulative effects
(1985 December); National Council on Air and Streams, Tech.Bull.No. 490, pp.38-66.
2. Megahan WF. 1974. Erosion over time on severely disturbed granitic soils: a
model. USDA Forest Service Research Paper INT-156, Ogden, UT; 14 pp.
3. Morrison, P.H. 1975. Ecological and Geomorphological Consequences of
Mass Movements in the Alder Creek Watershed and Implications for Forest Land
Management. B.A. Thesis. University of Oregon, Eugene, OR. 102 p.
4. Coe D. 2006. Sediment production and delivery from forest roads in the sierra
nevada, california, M.S. thesis. Colorado State University. 13p.
5. MacDonald L, 2007. Road Sediment Production and Delivery in the Central
Sierra Nevada, California. Watershed Science, Colorado State University, OR. 10 p.
6. ST.JOHN, 2001. Measurement And Prediction Of Sediment Production From
Unpaved Roads, U.S. Virgin Islands 14p.
Website:
1. />2. />