Structure and tree species diversity of tropical moist evergreen broadleaf forest in tam duong district lai chau province
Bạn đang xem bản rút gọn của tài liệu. Xem và tải ngay bản đầy đủ của tài liệu tại đây (1.72 MB, 50 trang )
ACKNOWLEDGEMENT
First of all, I want to express my gratefulness to teachers of Vietnam National
University of Forestry for establishing me to complete this research. I would like to thank all
the officers of Tam Duong District, Lai Chau Province for supporting necessary things and
providing me documents. I take this opportunity to record my sincere thanks to all the faculty
members of the Faculty of Forest Resource and Environment Management for their help and
encouragement. I am deeply indebted to my supervisor Dr. Cao Thi Thu Hien whose
stimulating motivation and valuable ideas help me to complete this research. I also thank Tam
Duong local government and local people for helping me during our researching time in Tam
Duong District, Lai Chau Province.
Hanoi, September 2019
i
CONTENTS
ACKNOWLEDGEMENT .................................................................................................... i
CONTENTS ......................................................................................................................... ii
LIST OF TABLES .............................................................................................................. iv
LIST OF FIGURES ............................................................................................................. v
ABSTRACT ........................................................................................................................ vi
CHAPTER I INTRODUCTION ......................................................................................... 1
CHAPTER II LITERATURE REVIEW ............................................................................ 4
2.1. In the world ................................................................................................................... 4
2.1.1 Structural composition ................................................................................................. 4
2.1.2 The distributed structure of trees by diameter .............................................................. 5
2.1.3. Species diversity research ............................................................................................ 6
2.2. In Vietnam ..................................................................................................................... 7
2.2.1. Structural composition ................................................................................................ 7
2.2.2. The role of distribution trees by diameter (N / D1.3) ................................................... 9
2.2.3. Research on tree species diversity .............................................................................. 10
CHAPTER III GOALS AND OBJECTIVES ................................................................... 12
3.1. Goal.............................................................................................................................. 12
3.2. Objectives .................................................................................................................... 12
CHAPTER IV STUDY SITE AND METHODS ............................................................... 13
4.1. Study site ..................................................................................................................... 13
4.1.1. Geographic location .................................................................................................. 13
4.1.2. Topographic .............................................................................................................. 14
4.1.3. Climate ...................................................................................................................... 14
4.1.4. Hydrology .................................................................................................................. 15
ii
4.1.5. Population and ethnic ............................................................................................... 16
4.1.6. Forest resources ........................................................................................................ 16
4.2. Methods ....................................................................................................................... 17
4.2.1. Sampling design ........................................................................................................ 17
4.2.2. Data collection .......................................................................................................... 18
4.2.3. Data analysis ............................................................................................................. 18
CHAPTER V RESULTS AND DISCUSSION.................................................................. 21
5. Results ............................................................................................................................ 21
5.1. Descriptive statistics .................................................................................................... 21
5.2. Forest structure ........................................................................................................... 22
5.3. Tree species diversity .................................................................................................. 29
6. Discussion ....................................................................................................................... 32
CHAPTER VI CONCLUSIONS, LIMITATIONS AND RECOMMENDATIONS ....... 34
REFERENCES .................................................................................................................. 36
APENDIX ........................................................................................................................... 41
iii
LIST OF TABLES
Table 4.1. Forest structure investigation ............................................................................... 18
Table 5.1. Descriptive statistics of 9 plots ............................................................................ 21
Table 5.2. Important Value Index of tree species in 9 plots................................................... 22
Table 5.3. Status of tree species in the 9 plots according to diameter (cm) ............................ 26
Table 5.4. The number of tree species and families for tropical moist evergreen broadleaf
forests in 9 plots ................................................................................................................... 30
Table 5.5. Diversity indices for tropical moist evergreen broadleaf forests in 9 plots ............ 30
iv
LIST OF FIGURES
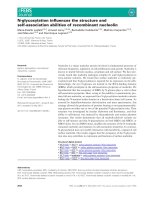
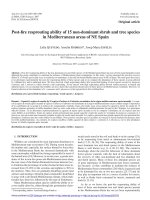
Figure 4.1. The map of study site in Tam Duong District, Lai Chau Province ....................... 13
Figure 5.2. Diameter distribution of tropical moist evergreen broadleaf forests in 9 plots ..... 27
Figure 5.3. Diameter distribution of Schima crenata ............................................................. 28
Figure 5.4. Diameter distribution of Litsea glusinosa............................................................ 28
Table 5.4. The number of tree species and families for tropical moist evergreen broadleaf
forests in 9 plots ................................................................................................................... 30
Table 5.5. Diversity indices for tropical moist evergreen broadleaf forests in 9 plots ............ 30
Figure 5.5. Diversity indices in 9 plots ................................................................................. 31
v
ABSTRACT
In this study, we set up 9 sample plots, each covering 2.000 m2 to analyze tropical
moist evergreen broadleaf forest structure and tree species diversity in Tam Duong District,
Lai Chau Province. Within each plot we identified, and measured height and diameter for all
woody individuals with stem diameters > 6 cm. The results indicated that the mean diameter
at breast height (DBH) varied from 11.55 cm to 18.30 cm. The standard deviation and
variance of DBH ranged from 0.24 cm to 10.80 cm and 18.50 – 116.90 cm2, respectively. The
stand basal area was from 8.37 m2/ha to 22.68 m2/ha. The diameter distributions were all
skewed to the left of the graph, with the total number of stems were concentrated in the first
class or second class. The number of trees per DBH class for two important tree species,
namely Schima crenata and Litsea glusinosa was inversely proportional to diameter sizes,
which was a decrease in the number of stems as the diameter increased. In species diversity of
the forest, total of 2188 species belonging to 81 species and 75 families. Tropical moist
evergreen broadleaf forests in the study area was medium diverse with the species richness
was from 14 to 37, Shannon - Weiner Index ranged from 1.2895 to 3.0262 and Simpson Index
varied from 0.5018 to 0.9239, and Margalef index was from 2.2394 to 6.8542.
vi
CHAPTER I
INTRODUCTION
Natural forest is the richest biological communities on earth and these forests have
been recognized to harbor a significant proportion of global biodiversity (Myers et al 2000;
Baraloto et al 2013). These forests provide many ecosystem services such as species
conservation, prevention of soil erosion, and preservation of habitat for plants and animals
(Armenteras et al 2009). Biotic factors such as seed quality, seedling survivorship, and
recruitment are important in maintaining the tree composition of tropical forests (Connell
1971). Over exploitation has resulted in the rapid loss of forests and is recognized to be
one of the biggest environmental and economic problems around the world (Mani and
Parthasarathy 2006). Natural forest is disappearing at alarming rates worldwide, reducing
annually by 1–4% of their current area (Laurance 1999). Relatively increased
anthropogenic pressures have led to agricultural expansion and overgrazing of livestock
(Anitha et al 2010).
Trees is an important component of vegetation, must therefore be constantly
monitored and managed in order to direct successional processes towards maintaining
species and habitat diversity (Turner 1987; Attua and Pabi 2013). Tree species diversity is
an important aspect of forest ecosystem diversity (Rennolls and Laumonier 2000; Tchouto
et al 2006) and is also fundamental to tropical forest biodiversity (Evariste et al 2010). Tree
census plots have been established in forest types through tropical regions to monitor forest
dynamics over time and to assess the effects of disturbance and climate change on plant
demography (Condit et al 1996; Laurance et al 2004; Mohandass and Davidar 2009). Tree
species diversity that influences the forests are climate, stand structure, species
composition, and geomorphology. Forest stand structure is a key element in understanding
forest ecosystems and also an important element of stand biodiversity (Ozcelik 2009). The
1
rapid inventory of tree species that provides information on diversity will represent an
important tool to enhance our ability to maximize biodiversity conservation that results
from deforestation and degradation (Baraloto et al 2013). Information from this
quantitative inventory will provide a valuable reference forest assessment and improve our
knowledge by the identification of ecologically, useful species as well as species of special
concern, thus identifying conservation efforts for sustainability of forest biodiversity.
Forest structure is the horizontal and vertical distribution of layers in a forest
including the trees, shrubs, and ground cover. The structure, species composition and
biodiversity of a forest can affect to environment quality, forest products quality, etc…
understanding about the structure, composition and biodiversity can help forest managers
better manage the forest. Well managed forest can bring many good effects for both human
and environment especially in protection function of forest. Moreover, it can help in
assessment and improve our knowledge by the identification of ecologically, useful species
as well as species of special concern, thus identifying conservation efforts for sustainability
of forest biodiversity.
In the world, many researchers had research on natural forest structure. ''Features of
the structure and natural regeneration have been many scientists around the world
conducting research to establish a scientific basis and theoretical work in service of forest
business. The study of the ecological structure of the rainforest was P. W. Richards (1952),
G. N. Baur (1964), and etc conducted. These studies have raised perspective, the concepts
and qualitative description of the composition, life forms and slab floor of the forest"
(Huyen, 2009).
With Vietnam forest, the complexity shows the clearest in the structure of the tree
species composition and second stories. The study of forest structure not only helps
maintain the stability of the forest ecosystem, conditioning the structure factors, but creates
2
an opportunity for managers to use and promote maximum sustainable benefits of forests
for the economy, society and environment. Therefore, one of the important issues to be
studied is to find out the rules of forest structure as a basis for proposing measures
appropriate protect and develop forest resources sustainably in Vietnam.
Tam Duong is a mountainous district located in the northeast of Lai Chau province.
The area of forest land in the district is 35,675.75 ha, accounting for 46.85% of the natural
area, the coverage is 43%. In general, the forest resources of Tam Duong are mainly poor
forests and rehabilitated forests after exploitation. However, in recent years, the direction
of the Party and local authorities has been good in forest protection, as well as the
implementation of 327, 661 programs, the new planted areas and new vegetation areas are
being protected and rehabilitated. Besides, no adequate research on species structure and
diversity has been conducted in Tam Duong district. No adequate research on species
structure and diversity has been conducted in Tam Duong district. For those reasons, I
conducted the topic: “Structure and tree species diversity of tropical moist evergreen
broadleaf forest in Tam Duong District, Lai Chau Province”. The information on tree
species structure and diversity can provide baseline information for conservation of the
biodiversity of the tropical forest in the research area.
3
CHAPTER II
LITERATURE REVIEW
2.1. In the world
2.1.1 Structural composition
Structural composition is the participation of the trees in the forest, or in other
words is the richness of species of plants receptor populations. According to Richards, P.
W (1952), in the tropical rainforest at least 40 trees per 1 ha, and also cases above 100
species. The author has distinguished composition of rain forest plants into two categories:
(i) the mixture of rain forest tree species complex tothanh; and (ii) the application offers
rain forest tree species with a simple structure, the special terrain, rain forest offers only
menu includes several species.
According Tolmachop, AL (1974), tropical plant ingredients are varied in that little
show they account for 10% of the total number of species of flora and total percentage of
10 they the largest number of species only reach 40-50% of all species. In the mixed forest,
many species of large trees distributed in proportion quite balanced, but mostly in a
receptor populations often have 1-2 dominant species.
Baur, GN (1979) when studying the rainforest near Belem on the Amazon River,
on a sample plot area of about 2 hectares have listed 36 plant families and on each sample
plot area of> 4 ha Northern New South Wales also recorded the presence of 31 families not
including vines, grasses and plant epiphyte.
Laura Klappenbach (2001) suggests that plant species composition related to the
type of forest, some forest contains hundreds of species, including some woods only a few
species. Forest always change and develop through a chain of succession, during which
time the tree species composition of forests changes.
4
In Asia, in secondary forests tropical Shanxin - China, Zeng et al (1998) have listed
about 280 species of medicinal plants, 80 species of oil plants and 20 species of plant
fibers as well as some tree species have different values. Richness of plant ingredients in
secondary forests in Nepal also Kanel KR and K. Shrestha (2001) study, over 6,500
flowering plants and 4,064 species of plants do not flower, over 1,500 species of fungi and
over 350 lichen.
In summary, the studies to date ahead of the authors showed that natural forest
stands say chungrat diversity of plant species composition. Overall, there are hundreds of
trees in the area of 1 hectare, however, very few species accounting for over 10% of all
species groups.
2.1.2 The distributed structure of trees by diameter
The relationship between the factors investigated in the forest is the basic rule in
studying the structure of the forest is a lot of interest in the study author. Today, besides
the research nature of qualitative studies of forest structure in recent decades tend to
gradually shift from describing the qualitative to the quantitative with the aid of
mathematical statistics and information learning, including modeling forest structure,
establishing the relationship between forest structure factors has been much study authors.
The problem of the structure of space and time are the authors of forest research focused
most.
To study the rule, most of the authors have used analytical methods, to find
mathematical equations as many different probability distribution. Not to mention works as
follows:
The first is the work of Meyer, H. A (1952) described the distribution N / D by
mathematical equations with continuous reduction curve. This equation is called the
equation Meyer.
5
Rollet (1971) demonstrated the relationship between height and diameter at breast
height by jaw line regression; tree diameter distribution as probability distributions
(manual documentation of Tran Van Son, 1991).
Richards PW (1952) in his book "Rainforests" also refers to distribution of trees by
diameter class, he considered distribution form is a form of natural forest characteristics.
Then many authors used calculus equations to find the equation of the distribution
curve as Balley (1973) Modeling the distribution structure of trees by diameter (ND) using
the Weibull function. Prodan, M and Patatscase (1964), Bill and Cream, K. A (1964)
distributed architecture approach N / D equation logarithm (tutorial document Tran Van
Son, 1991).
In particular, to increase flexibility, some author or use other functions such as
Loetschau (1973) (cited in Pham Ngoc Giao, 1997) used to repair Beta distribution
function experiments. JLF and Docouto HTZ Batista (1992) while studying 19 sample
plots with 60 species of tropical forests in Maranhoo, Brazil used to simulate the function
Weibull distribution N / D1.3. Many other authors use Hyperbola function, Poisson
function, logarithmic function and function Pearson.
Overall, the use of this function or other function to indicate rule is structured
depending on the experiences of the author, as well as the different tree species grow and
measurements practice. Do not stop the tree's diameter increases with age, so the diameter
distribution of forest stands are also constantly changing with age. Therefore, from the
mathematical model has identified, scientists have studied the variation of the distribution
law under the age of trees (called forest structure dynamics).
2.1.3. Species diversity research
Raunkiaer (1934) gave the formula for determining the standard universal life
forms to thousands of different species. According to this formula the standard universal
6
life forms is determined according to the percentage between the number of individuals of
each form of life than the total number of individuals in an area. To represent the diversity
of species, some authors have developed the formula for determining the species diversity
index as Simpson (1949), Margalef (1958), Menhinik (1964), ...
2.2. In Vietnam
2.2.1. Structural composition
These are factors influencing the decision to ecological structures and other forms
of forest. Forest composition is an important indicator to assess the level of biodiversity,
stability and sustainability of forest ecosystems. A lot of scientific works of many authors
have focused on the structural features of the natural forest types in order to serve the
conservation, development and long-term business.
Structural composition is essentially participatory components in populations of
forest tree species. Study the structure of natural forests in Vietnam, in view of ecosystems,
Thai Van Trung (1978, 1999) based on the number and biomass group dominant species in
tropical moist forests Vietnam to identify the pros and complex case.
Group dominant species in favor of not more than 10 species, the proportion of
individuals of each dominant species accounting for about 5% and the total number of
individuals of 10 species of superiority which should account for 40-50% of the total
number of individuals of the floor established populations in the population per unit area of
investigation. Where the dominant species obviously not called complex.
Characterized by climate and soil favorable to many plants and development, so in
the natural forest mixed tropical species rarely only a single dominant species forming
populations such as the temperate zone. According to Nguyen Hong Quan (1983), in
forests in Kon Ha Nung type IVB, on the 01 ha area has about 60 species, but species with
the largest combined will not exceed 10%.
7
Nguyen Ngoc Lung (1991) surveys of forest type climate in Huong Son, Kon Ha
Nung and some other localities, also said on the sample plot area of 1 hectare are usually
from 23-25 species, with the number of trees lowest and the highest reaching 859 317 tree
seedlings / 1 ha (tutorial document Tran Van Son, 1991).
Compared to other regions of the world, Pham Hoang Ho (1999) says: if in the
Amazon, an average of about 90 species / 1 ha, in Southeast Asia to 160 species / 1 ha
(tutorial document Tran Van Son, 2007).
To assess the composition of forests, many authors have used the formula
composition on the rate of section 10 according to the number of trees, basal area or index
IV%; which method composition ratio (IV%) according to the method of Daniel Marmil
lod scientists often use in the study of forest structure.
Nguyen Manh Tuyen (2009) when studying the structures of stories tall trees of the
SUF in Huong Son, My Duc, Hanoi showed that the number of species recorded are 79
species including forest conditions IIIA1 with the number of species 55 species, forest
conditions IIB with the number of species was 40 species. Most of the plants involved in
formula composition on the 2 state mainly tree species complex and fast growing pioneer
light.
Vo Dai Hai (2014) when studying the structure of forest status IIA in the area of
protection forests Yen Lap, Quang Ninh province showed that composition of natural
forest status IIA in the study area is quite diverse with many species various trees, ranging
from 28 to 45 species, of which only from 4-7 species involved in formula composition;
read water species is dominant species of tree floors high.
Vo Hien Tuan (2017) when studying the structures of stories tall trees of state
IIIA1, IIIA2 and IIIB in the central region of Vietnam showed that forest conditions IIIA1
with the number of species was 61 species, forest conditions IIIA2 there are 96 species of
8
species and forest conditions IIIB has 81 species. Number of species involved in formula
composition on the 3 status only 7 species and mostly less valuable species in economic
terms but with good protection capacity.
Pham Quy Van (2018), when studying the structural composition of stories tall
trees for state natural forests IIIA in An Lao District, Binh Dinh Province also shows status
IIIA1 have some plants varied from 49 to 51 species and the number of species involved in
formula composition only from 3-6 species, while state IIIA2 have species ranging from 51
to 56 species and species involved in formula composition fluctuations in the range of 5 - 6
species.
2.2.2. The role of distribution trees by diameter (N / D1.3)
Modeling structure D1.3trong diameter quantitative research forest structure are
more people interested in the study and expressed in the form of probability distribution
function vary, the typical works of authors such as:
Dong Sy Hien (1974), when scheduling standing volume of natural forests in
northern Vietnam has studied stands on various local and come to general conclusions are:
Since the extraction process selected coarse not follow rules, should distribution N / D is
the distribution jagged edge. With this distribution pattern selected author Meyer and their
function curves to describe Pearson.
Nguyen Hai Dog (1982) used the distribution reduction, distribution distances to
perform diameter structure, height structure of secondary forests, and apply equations
Pearson to study population structure.
Tran Van Son (1991), was used to simulate the Weibull distribution structure for
Dipterocarps diameter in the Highlands.
Le Minh Trung (1991) via simulation testing distribution N / D of natural forests in
Chiayi - Dak Nong with 4 type of function: Poisson, Weibull, Hyperbola and Meyer, has
9
concluded: function Weibull have access distributed empirical great diameter. However,
the determination of the two parameters of the equation is very complex, so used to
calculate the function Meyer.
Research Wujin Pictures (1991) shows that can be used with two parameter
Weibull function to indicate distribution N / D for some natural forest conditions.
Le Six (1996), confirmed the Weibull distribution best suited to describe the
distribution N / D for all natural forest conditions, despite empirical distribution form
continuous decrease or a peak.
Phung Van Khang (2014) when studying the characteristics foresters of evergreen
moisture tropical area code Da Dong Nai shows: distribution N / D of the three states
studied IIB, IIIA2 and IIIA3 are shaped distribution decreased..
Pham Quy Van (2018), the study of a number of structural features for state natural
forests IIIA in An Lao, Binh Dinh showed can use Weibull distribution to simulate the
distribution of experimental N / D1.3.
Statistical research works on natural forests in Vietnam for the results: Distribution
N / D1.3 of floors tall (D ≥ 6 cm) there are 2 main types: (i) is decreasing continuously and
more serrated top side and (ii) form a shaped peak J.
For each specific format, the authors chose the appropriate mathematical models to
simulate.
2.2.3. Research on tree species diversity
Phung Dinh Trung (2007), when comparing species diversity of the area north and
south of the Hai Van Pass was based on the index varied: The richness of Kjayaraman
index Shannon-Weiner , Simpson index, the index varied by information theory, only
rational numbers and the author gives some comments: the level of style phucua species as
10
well as the level of species diversity tree storeys and the uniform number of individuals in
a species in the forest north than in the south high Hai Van Pass.
Vo Hien Tuan (2017) compared a number of structural characteristics and species
diversity of stories tall trees of state IIIA1, IIIA2 and IIIB in the central region also use the
index diversity to compare species diversity between state forest together, the results show
that the volatile species in the 6 plots measuring from 62 to 102 species. Species diversity
in tree layer of different forest conditions also differ, the degree of diversity of state IIIB is
the largest, followed by the state and the lowest IIIA2 IIIA1 state.
Pham Quy Van (2018), the study of a number of structural features for state natural
forests IIIA in An Lao District, Binh Dinh Province also use the indicators varied and
records diverse to compare diverse trees of the forest status IIIA, results show that the form
of state IIIA2da most tree species, status and IIIA3 IIIA1 different not much of index
component species diversity but species differ markedly.
11
CHAPTER III
GOALS AND OBJECTIVES
3.1. Goal
To analyze the structural characteristics and assess tree species diversity of tropical
moist evergreen broadleaf forests in Tam Duong District, Lai Chau Province.
3.2. Objectives
The specific objectives of this research are as follows:
To give several descriptive statistics of tropical moist evergreen broadleaf
forests in Tam Duong District, Lai Chau Province.
To show some characteristics of forest structure of tropical moist evergreen
broadleaf forests in the study site.
To provide tree species composition and diversity of tropical moist
evergreen broadleaf forests in the study site.
12
CHAPTER IV
STUDY SITE AND METHODS
4.1. Study site
Figure 4.1. The map of study site in Tam Duong District, Lai Chau Province
4.1.1. Geographic location
Tam Duong is a highland district located in the northeast of Lai Chau province. As
of 2009 the district had a population of 46,767. The district covers an area of 758 km².
Geographic coordinates from 22010’00’’ to 22030’00’’ North latitude; from 103018’ to
103046’ East longitude.
The east borders Sapa district, Lao Cai province. The west borders Sin Ho district
and Lao Cai city. The south borders Sin Ho district, and Tan Uyen district. The north
13
borders Phong Tho district, Lai Chau province, and Bat Xat district, Lao Cai province. The
total area of Tam Duong district is 68,742.56 ha of natural area. Tam Duong is quite
convenient compared to other districts in the Lai Chau province because it has a national
highway 4D running through and 25km from Lai Chau city center. The district has tourist
sites such as: Tien Son cave and community tourism sites. The districts also have a village
to make vermicelli, these factors create favorable conditions for the development of the
economy and local tourism service. Therefore, Tam Duong district has conditions to
promote resources for socio-economic development.
4.1.2. Topographic
Tam Duong is a district with a complex terrain, composed of long mountain ranges
in the direction of Northwest - Southeast. In the northeast is the Hoang Lien Son range
stretching over 80 km with Phan Xi Phang peak of 3,143 m high, in the Southeast is Pu
Sam Cap range of about 60 km long. Alternating between high mountains are valleys and
rivers such as:
- Tam Duong Valley - Ban Giang: 3,500 ha, the slope is from North to South, average
height is 900 m.
- Tam Duong Valley - Then Sin runs along Nam So stream: 500 ha.
- Binh Lu valley - Na Tam - Ban Bo: 1,800 ha, altitude 600 - 800 m. These are areas
with potential for agricultural development and key areas for food crops and industrial
crops.
4.1.3. Climate
Located in the tropical monsoon region, divided into two distinct seasons, the rainy
season from April to September, concentrating mainly on June, July and August,
accounting for 75-80% of the total rainfall in the year, averaging from 1,800 - 2,000
mm/year, the highest 2,500 mm/year, hail appears, averaging 1.6 times/year.
14
The dry season lasts from October to March of the following year, the weather is
dry, less rainy, cold and often appears fog, hoarfrost in December and January in highland
areas such as: Sa Pa Pass, Giang Ma Pass.
The amplitude of heat fluctuation is quite strong, averaging about 8 – 9oC, in the
winter it reaches 9 – 10oC, there are places from 11 to 120C. However, in some places
with a height of over 1,000 m, the value of day and night amplitude decreases, averaging
about 7 - 8oC, in winter the temperature is about 8 – 9oC. Annual average temperature is
from 22 – 26oC, heat The highest temperature is 35oC, the lowest temperature can be
below 0oC.
-
Sunny mode: The average number of sunshine hours is from 2,100 to 2,300
hours/year.
-
Humidity: The average air humidity is 83%, the lowest humidity is 56%.
-
Wind direction: the main wind direction is southeast, the average wind speed is 12m/s, in the thunderstorm can reach 30 - 40m/s.
-
Evaporation: average annual evaporation is 889.6 mm
-
Thunderstorms appear most often in May with swirling winds
4.1.4. Hydrology
The system of rivers and streams is relatively evenly distributed with 2 main river
and stream systems:
Nam Mu River: Flowing through Na Tam, Ban Bo is formed from 4 main streams:
Nam Ke Stream from the top of Sapa, Na Da stream from Ho Thau, Nam Dinh stream
from Khun Ha, Nam Mu stream from Ban Hon, here. are the streams of Da river
watershed, mainly supplying water for Ban Chat hydropower, Huoi Quang hydropower
and Son La hydropower.
15
Nam So streams from Ta Leng through San Thang commune (Lai Chau town),
Than Sin commune merges with Nam Na stream. This is the main water supply source for
urban areas of Lai Chau town and for neighboring communes. Because the terrain of the
district is relatively complicated, the rivers have a steep slope, so it is possible to build
small and medium-sized hydropower stations.
According to the assessment, the area of Tam Duong district has Diep Dong Giao
limestone floor, which is often met with Castes caves, and the underground water source is
relatively abundant, but there is no specific exploration result yet, the exploitation is still
limited.
4.1.5. Population and ethnic
Tam Duong district has 46,767 people with 7,017 households, including 4,874
people in urban areas, accounting for 11.05% of the population of the district, rural
population has 39,234 people, accounting for 88.95% of the population of district and
household size is 5.68 people/household, the average population density is 68 people/km2.
Tam Duong district has 12 ethnic groups living together, of which ethnic minorities
make up the majority, over 84% the lives of ethnic minorities are still difficult, the poverty
rate is high.
4.1.6. Forest resources
The area of forest land in the district is currently 35,675.75 ha, accounting for
46.85% of the natural area, the coverage is 43%, of which forested land is 29,154.41 ha,
land for forest regeneration is 8,422 ha, all of which are protective forests, distributed in
communes such as: Binh Lu, Ban Bo, Ta Leng, Ho Thau and etc.
In general, the forest resources of Tam Duong are mainly poor forests and
rehabilitated forests after exploitation. However, in recent years, the direction of the Party
16
and local authorities has been good in protecting forests, as well as implementing
programs. New plantation areas and vegetation are being protected and rehabilitated.
4.2. Methods
4.2.1. Sampling design
Samples are parts of population and be used to estimate for population’s
parameters. Thus, selecting sample is very important as the first step that affect to our
precision and accuracy of estimates.
Firstly, survey the study site was conducted. The simple random sampling was used
to set up sample plots in the study site.
9 sample plots were set up, each covering 2000m2 (40m of length x 50m of width)
for forest inventory.
The steps for setting up the sample plot are as follows:
Step 1. Determine the direction of the sample plot, quick survey (or estimate) if that
direction could contain the entire sample plot area.
-
Step 2. Locate the first point of the sample plot. It should be one of the four
corners.
Step 3. Use length tape to measure distance from the first point to others. Make
sure that they form 90-degree corner by using a compass. In case of lacking compass, the
Pythagoras rule could be applied. Similarly, repeat these works for the next corners.
Note: in natural forest (or closed forest), sometime it is invisible from this corner to
others. So good skills at using a compass (or Pythagoras rule) will be very helpful to
ensure that the sample plot is 100% square (or rectangle) and therefore, in the right area.
-
Step 4. Mark all these four corners and then bound sample plot by using color line
17
4.2.2. Data collection
All trees in the plot with a diameter at breast height from 6 cm (DBH ≥ 6 cm) were
marked and, identified by species; their diameter was measured at 1.3 m from the ground.
Calipers with a precision of 0.5 cm was used to measure diameter at breast height. Using
Blumeleiss hypsometer (accuracy 0.1 m) to randomly measure total tree height of 30 trees
in each plot. Canopy closure was determined by app Canopeo or GLAMA (Gap Light
Analysis Mobile App).
The measured data was recorded in the following table.
Table 4.1. Forest structure investigation
Forest type:
Plot number:
Canopy cover (%):
Geographic location:
Surveyor:
Date:
Crown dia. (m)
Tree No.
Species
D1.3 (cm)
Total H (m)
Note
NS
EW
1
2
…
4.2.3. Data analysis
a. Descriptive statistics
Descriptive statistics on forest structure was computed for each sample plot, including:
-
Mean diameter
-
Stand basal area
-
Stand density
18
b. Forest structure
Excel were used to determine and draw the graph about:
-
Frequency distributions
-
Species composition
The IVI% was calculated as formula
IVI% = (RD + RBA)/2
(3.1)
In which: RD: Relative Density; RBA: Relative Basal Area
Relative density =
(3.2)
Relative basal area =
100%
(3.3)
The IVI varies from 0% to 100%, trees with IVI% ≥ 5% are important species.
According to Daniel Marmillod, the tree species have IVi %> 5%, is important in terms of
ecology and presented in composition formula. On the other hand, according to Thai Van
Trung (1970), in a forest stand, the tree species group occupy 50% of individuals total of
upper tree layer that is considered dominant species groups.
c. Species diversity
Tree diversity indices are also good quantitative descriptors of forest structures
(Lexerod and Eid, 2006). Diversity indices are also important input variables for the
reconstruction of forest structures used in spatially explicit growth models and computer
visualisations (Pommerening, 2006). In general, the species diversity of a community is
made up of two components: species richness (or the number of species present) and the
evenness, species equitability, or abundance of each species.
To assess tree species diversity for forest states, diversity indices were used,
namely species richness, Shannon-Wiener index, Simpson index, Margalef index.
Species count
Shannon Index (H’) = - ∑
(3.4)
19