Public relations program for improving water pollution situation in van phuc handicraft village ha noi
Bạn đang xem bản rút gọn của tài liệu. Xem và tải ngay bản đầy đủ của tài liệu tại đây (870.22 KB, 54 trang )
ACKNOWLEDGEMENTS
I would like to express my very great appreciation to Dr. Tran Thi Thu Ha, my
research supervisor, for her enthusiastic encouragements and useful critiques of this
research work. Without her thoughtful, patient guidance through every step of my research,
this thesis could not have been realized. Thanks to cooperating between Vietnam Forestry
University and Colorado State University, I have chance to approach a reservoir of
international knowledge and experience.
I would like to extend my thanks to Ms Nguyen Thi Huong Giang and Ms Do Thi
Phuong, the Principal and the Vice Principal of Van Phuc Primary School, for accepting
the responsibility of my research as well as Mr Can Van Khoa and Ms Le Thi Nga for
giving me the knowledge accompanied with the enthusiastic guidance to collected data
when I worked as an apprentice in Natural resource and Environment Department in Ha
Dong District. Moreover, I highly appreciate to Mr Dang Quang Hai, the Vice Principal of
Van Phuc People’s Committee and Mr Pham Khac Ha, the President of Van Phuc Silk
Villages Association for supporting me carried out survey questionnaires and interviews to
local residents, followed by providing me with useful information about Van Phuc
Villages.
Many other people have contributed to the success of this thesis but I would like to
particularly thank my friends in GoGreen Club and other members in Action For Water
project for their support. Last but not least this thesis could have never been completed
without the support of my parents because of their encouragements and giving me the
favorable conditions during the entire process of doing research and going field works for
having my works done.
i
CONTENTS
ACKNOWLEDGEMENTS .................................................................................................... i
CONTENTS...........................................................................................................................ii
LIST OF ABBREVIATIONS ............................................................................................... iv
LIST OF TABLES ................................................................................................................. v
LIST OF DIAGRAMS.......................................................................................................... vi
LIST OF FIGURES .............................................................................................................. vi
1. INTRODUCTION ............................................................................................................ 1
2. GOALS AND OBJECTIVES ........................................................................................... 2
2.1. Goals ............................................................................................................................... 2
2.2. Objectives ....................................................................................................................... 2
3. SITE DESCRIPTION ....................................................................................................... 2
4. METHODOLOGIES ........................................................................................................ 4
4.1. Existing data collection .................................................................................................. 4
4.2. Primary data collection ................................................................................................... 5
4.3.1. Descriptive statistic ...................................................................................................... 6
4.3.2. Regression Analysis ..................................................................................................... 6
4.4. Building PR campaign (June, 2015- June, 2016) ........................................................... 9
5. RESULTS ....................................................................................................................... 10
5.1. Water pollution situation in Van Phuc handicraft village............................................. 10
5.2. Awareness and behavior of villagers on water pollution situation and ability to build
PR campaign in Van Phuc handicraft village ...................................................................... 13
5.3. PR program for improving water pollution situation and raising fund to build waste
water treatment system in Van Phuc handicraft village ...................................................... 20
5.3.1. Executive summary .................................................................................................... 20
ii
5.3.2. Research and situation analysis ................................................................................ 21
5.3.3. Goals and objectives .................................................................................................. 22
5.3.4. Key message ............................................................................................................... 22
5.3.5. SWOT analysis ........................................................................................................... 23
5.3.6. WWWWWH analysis .................................................................................................. 24
5.3.7 Target publics ............................................................................................................. 24
5.3.8. Strategies ................................................................................................................... 25
5.3.9. Tactics ........................................................................................................................ 25
5.3.10. Schedule and budget ................................................................................................ 28
5.4. Evaluation of PR program ............................................................................................ 29
5.4.1. Output 1 ..................................................................................................................... 29
5.4.2. Output 2 ..................................................................................................................... 33
6. DISCUSSION .................................................................................................................. 34
6.1. Experimental setup performance .................................................................................. 34
6.2. Data analysis performance ............................................................................................ 34
6.3. Future research .............................................................................................................. 35
7. CONCLUSION ................................................................................................................ 36
REFERENCES
ANNEXES
iii
LIST OF ABBREVIATIONS
PR
Public relations
VEA
Vietnam Environment Administration
TTS
Total Suspended Solids
COD
Chemical Oxygen Demand
BOD
Biochemical Oxygen Demand
MONRE
Ministry of Natural Resources and Environment
EPA
Environmental Police Agency
SPSS
Statistical Package for Social Sciences
iv
LIST OF TABLES
Table 1 Sign Expectation of Regression Coefficients with attitude towards water pollution
situation .................................................................................................................................. 7
Table 2 Sign Expectation of Regression Coefficients of willingness to pay or donate
money for building water treatment system .......................................................................... 9
Table 3. Descriptive results for selected variables .............................................................. 13
Table 4 Local’s awareness about water pollution situation in Van Phuc ............................ 15
Table 5 Effect of some selected variables on respondents’ attitude towards water pollution
situation ................................................................................................................................ 17
Table 6 Willingness to pay for building waste water treatment .......................................... 18
Table 7 Effect of some selected variables on respondents’ willingness to pay for building
waste water treatment .......................................................................................................... 19
Table 8 SWOT analysis of PR program .............................................................................. 23
Table 9 WWWWWH analysis ............................................................................................. 24
Table 10 Timeline and budget for PR campaigns ................................................................ 28
Table 11 The list of video performed in the environmental training course ....................... 29
Table 12 The result of analyzing water sample in the canal Hong Phong hamlet of Van
Phuc village which is the place received domestic waste. ................................................... 45
Table 13 The result of analyzing water sample in Van Phuc village’s pond ....................... 46
v
LIST OF DIAGRAMS
Diagram 1 The comparison some water indicators in with the standards of Vietnam –
QCVN14: 2008/BTNMT ..................................................................................................... 10
Diagram 2 The comparison some water indicators in with the standards of Vietnam –
QCVN14: 2008/BTNMT ..................................................................................................... 12
Diagram 3 The percentage of local's concern about PR program........................................ 19
Diagram 4 The plan of 03 lectures on environmental training course................................. 26
LIST OF FIGURES
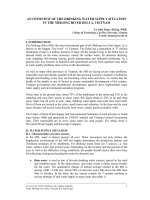
Figure 1 Geographic location of Van Phuc Village ............................................................... 3
Figure 2 The lists of photos and drawings performed in exhibition .................................... 31
Figure 3 Website model of crowd-funding campaign ......................................................... 33
vi
ABSTRACT
Early attempts to produce a better understanding on the cause of pollution from craft
production and to halt this problem have achieved little success without provide thorough
reasonable measures at the village, district, provincial and national levels. Meantime, the
small scale and dispersed nature of craft production has continued to defy effective
management by the state, and pollution levels in craft villages have increased alarmingly.
Drawing on case study site in Van Phuc Handcraft Village in Hanoi, this study was
undertaken to assess the water pollution situation and awareness and behavior of villagers
on water pollution situation and ability to build PR campaign, whereby PR programs were
established for improving water pollution situation and raising fund to build waste water
treatment system in this area. Collecting existed data, survey questionnaires, participant
observation and focus group discussions were the methods used in data collection. Using
the Statistical Package for Social Sciences program, Microsoft Excel software was used to
analyze some quantitative data. The results revealed an overview on the critical issues on
water pollution in Van Phuc, the relationship between attitude of local people towards
water pollution situation and willingness to pay or donate money for building water
treatment system fluctuated according to different person with different sex, age, types of
job, income and level of education. The study also figures out some PR campaign and test
the effectiveness one out of two PR strategies which already carried out by author in Van
Phuc Handicraft Village, Ha Dong, Ha Noi.
vii
1. INTRODUCTION
Vietnam is estimated to possess about 1,450 craft villages which have contributed
significantly to rural areas. However, associated with economic benefits, they is also
undergoing severe environmental problems. A report states that “the economic
development in craft villages has caused serious impacts on the environment due to the use
of small scale, outdated technologies, low material/fuel efficiency and limited
manufacturing space” (MONRE, 2008). Another report also shows that 90 percent of craft
villages are undergoing the excessive pollution level over the permissible level in
accordance with the national environmental protection law (EPA, 2009).
Van Phuc handicraft village is an obvious illustration. Located on the bank of Nhue
River about 10km to the southwest from Hanoi, it is an ancient silk handicraft village with
a history of more than 1,200 years. However, in recent years this village is facing critical
issues about environmental degradation. Van Phuc water resources suffer serious pollution
by organic matter while the main pollutant sources from wastewater without treatment.
Most wells in eastern Van Phuc craft village – Ha Dong – Ha Noi contain arsenic
concentrations 10 – 50 times beyond the guideline for arsenic in drinking water set by
World Health Organization (van Geen et al., 2013).While water resources are put in such
alarming situation, local people still lacks some basic knowledge to protect water resources
and reduce pollution.
Public relations (PR) is “the management function which evaluates public attitudes,
identifies the policies and procedures of an individual or an organization with the public
interest; and plans and executes a program of action to earn public understanding and
patience” (Public relations News). In the information era, PR is not only a technical
activity for business but also useful for natural resource management. However, PR is a
1
new communication tool in Vietnam natural resource management that it has not been
utilized widely by environmentalists.
Basing on the practical significant above, I proceed to carry out the research: “PR
program for improving water pollution situation in Van Phuc handicraft village, Ha
Noi”. This research will show the critical issues on Van Phuc water pollution and point out
some PR strategies in the hope of improving the situation.
2.
GOALS AND OBJECTIVES
2.1. Goals
The general goal of the research is to raising local’s awareness on water pollution
situation in Van Phuc Handicraft Village, Ha Noi.
2.2. Objectives
The objectives of this thesis are as follows:
(1)To assess water pollution situation in Van Phuc Handicraft Village;
(2)To ascertain awareness and behavior of villagers on water pollution situation and
ability to build PR campaign in Van Phuc Handicraft Village;
(3)To establish PR program for improving water pollution situation and raising
fund to build waste water treatment system in Van Phuc Handicraft Village;
(4)To evaluate the effectiveness of the PR program in Van Phuc Handicraft Village.
3.
SITE DESCRIPTION
The research was conducted on Van Phuc handicraft village (or Van Phuc Silk
Village) which is located on the banks of Nhue Thi River, Nguyen Trai Road, near Ha
Dong city, 10 Km southwest of Ha Noi, the capital of Vietnam. It takes you only 30
minutes by motorbike to go there from the center of Hanoi. The east bounder is adjacent to
Van Mo district, the north bounder is on Dai Mo and Tu Liem districts, the west borders
with La Khe and the south is adjacent to Quang Trung.
2
The village has been much well-known for its traditional sericulture, weaving, and
silk products. Here, it is a traditional silk worm breeding and silk weaving area. Despite
historical changes and the urbanization process, silk worm breeding has disappeared, but
Van Phuc silk weaving has still been growing for the last 10 centuries whereas silk textiles
and garments industries have rapidly developed.
Figure 1 Geographic location of Van Phuc Village
Source: Google map and author
There used to be three types of producing organizations. Cooperatives, in the past
period, had provided with 200 weaving machines operated by numerous contract worker
who must ensure the responsibility of each production step to each workshop. However,
this former is no longer exist. Cooperatives just manage now only inputs and outputs,
support to advertise products images and find markets. Households produce in large-scale:
These households had around 10 looms and usually have to hire outside workers. Workers
3
will be paid from 600 000 to 700 000 VND per month, with working time 10-12 hour a
day. Households’ small producers: These families only have 1-5 looms. Most families
were self-assumed all the work and do not hire outside labor.
According to the survey questionnaires about Van Phuc village (carried out in
August 5th, 2015), the village has total area about 143.97 ha divided into 12 groups
including approximately 16705 residents within 4361 households. There are 2 state-owned
enterprises, 28 private companies, 3 co-operatives and 1780 households (of 2542
households in the commune) engaged in producing and trading textiles. There are more
than 1100 silk weaving machines and several dying workshops. 3600 inhabitants of the
commune and thousands of outside laborers work in this craft area. Production materials
are supplied from different domestic sources. Manual weaving equipment has been
replaced by machines, but production is conducted mainly at home. Households use their
houses for both living and production.
4. METHODOLOGIES
4.1. Existing data collection
This method is used to assess water pollution situation in Van Phuc handicraft
village, Ha Dong, Ha Noi. In search of find out what and where has been the source of
pollution, I paid the great attention on water quality in two locations were in the canal of
Hong Phong hamlet and Van Phuc village’s pond. As a result, by using archived data from
“Report of Environmental information – Ha Dong district” (Ha Dong Natural resources
and Environment Department 2010, 2012 and 2014) and the results of water sample
analysis in terms of domestic waste water sample, water sample in Van Phuc pond carried
out by Environment Analysis Department (2010, 2012, 2014) enabled me to deal with the
first objectives.
4
4.2. Primary data collection
With a view to accessing the awareness and behavior of local community and the
potential for building PR campaign in Van Phuc handicraft village, I conducted survey by
using both structured and semi-structured interview in an effort to gather large amounts of
information from numerous residents in a community in terms of a specific topic in a
relatively short period of time.
- Structured interview: Using questionnaire survey in two sample with different
objects
A sample size: 50 local people - Selected sample randomly
A sample size: 30 primary students in age from 10 - 15 years old of Van Phuc
school – selected sample randomly
- Semi-structured interview: Containing opened-ended questions. It also allows
respondents to discuss and raise issues from context of participants’ experiences about
local water issues associated with local behavior and attitude, followed by providing
reliable, comparable qualitative data.
At least 10 people interviewed about relevant information.
Interviewed randomly
The main information: The level of villagers’ concern and outstanding about water
resources in local areas, what they know about sources of water pollution, their
recommendation. Another importance thing is that the local interested participating in the
process of finding a solution to the problem of environmental pollution – PR program.
It will be setup in Vietnamese language, using multiple choices and open question
- Observation: Direct observational methods - without intervention: visiting silk
productive installation, living at local household (take a note, photo or video). Focusing on
5
the attitude of local people and their awareness in Ha Dong, the change of behaviors before
and after PR program implement.
It is used to describe current situation of water pollution in Van Phuc village. In other
hand, this method is used to provide more illustrated picture to make a stronger evidence
for this research and take place with the timeframe of collecting data.
4.3. Data analysis process
Based on the qualitative data from interview and making survey, this research
describes some characteristics and current situation of water use of the Van Phuc villagers
at study site.
4.3.1. Descriptive statistic
Data were analyzed by using the Statistical Package for Social Sciences (SPSS)
Version 22. Calculation of the percentage was used as tool of analysis for interpreting of
the qualitative information gathered from the respondents.
Excel software is also used to analyze data, make statistical hypothesis test and
graphs or charts. From that point, this research will illustrate the relationship between local
people awareness and the current situation of water pollution in Van Phuc village.
4.3.2. Regression Analysis
Regression analysis was also used as another analytical tool in this study. In this
statistical approach, stepwise multiple linear regression analysis was used to explain the
influence of some selected variables expected to affect the dependent variables. To
determine whether such demographic and socioeconomic variables as sex, age, level of
education, types of selected occupation, incomes and local awareness of water pollution
situation helped explain why some residents held more favorable attitudes than others. This
analysis was used because under practical situation of this local community are possibly
influenced by many factors.
6
In this research, attitude towards water pollution situation, willingness to pay or
donate money for building water treatment system are considered as dependent
variables, meanwhile, sex, age, level of education, kind of jobs, incomes, local
environmental communication are independent variables. By the virtue of statistic
mathematics model, it showed the relation between dependent variable and
independent variables. It is conducted that attitude of local people towards water
population situation and willingness to pay or donate money for building water treatment
system change with different person associated to different sex, age, types of job, income
and level of education (Independent variables).
Table 1 Sign Expectation of Regression Coefficients with attitude towards water
pollution situation
Variables
Variable Explanation
Expected Sign
Sex
Sex of interview (1: male; 0: female)
+/-
Level of age (Young, mature and old
+/-
Age
generation)
Level of education
Schooling levels
Jobs/Occupations
2 types of jobs surveyed
+
Silk handcrafter: 1
-
Non silk handcrafter: 0
+/-
Income
High, moderate, low level of income
+
Local environmental
Approaching to means of environmental
+
communication
communication
To identify factors influencing to attitude towards water pollution situation, this
research gives out the expected sign of coefficient as follows:
7
Sex and age: In the same conditions, people have the same attitude towards an
issue, but different sex and age have different level of concern about it. The sign of
coefficient is expected both positive and negative sign (+/-).
Level of education: This is a factor as expected as strongly contributes to
awareness of local people in water pollution situation. The higher level of education is,
expectedly, the higher level of awareness is. Therefore, it is expected as positive sign (+).
Jobs: There are two types of selected jobs, silk handcrafter and non – silk
handcrafter. Due to the process of silk weaving and dyeing, silk handcrafters often use
chemicals and through waste water directly into water body without treated. The former
may know the negative effects of this process, but for the sake of money, they ignore it.
So, the expected sign is a negative one (-). Nevertheless, non-handcrafters belonged many
classes such as workers, officials, manual labors, shoppers and so on. It has both side of
attitude towards water pollution situation. Thus, the sign of coefficient is expected both
positive and negative sign (+/-).
Income: Hardly do people concern about environment issues when they are such
busy with looking for a means of subsistence and vice versa, if people have a good quality
of life, they will pay more attention to substantial development value, especially,
environment issues. For this reason, it is expected as positive sign (+).
Local environmental communication: It is another factor which considers as a
contributor has enormous effects on attitude of locals towards water pollution situation. If
the local governments enable local residents to approach unceasing environment
information, they will have more awareness about this issue. As a result, it is expected as
positive sign (+).
Besides, the same factors influencing to willingness to pay or donate money for
building water treatment system also are pointed out in table below.
8
Table 2 Sign Expectation of Regression Coefficients of willingness to pay or donate
money for building water treatment system
Variables
Variable Explanation
Expected Sign
Sex
Sex of respondents
+/-
Age
Level of age
+/-
Level of education
Schooling levels
Jobs
2 types of jobs surveyed
Incomes
High, moderate, low level of income
+
+/+
4.4. Building PR campaign (June, 2015- June, 2016)
PR strategies were carried out in two campaign.
The first phase is changing awareness and behavior by the environment education - 03
lectures associated with spreading water saving and protecting publications for 30 students at
Van Phuc primary school. This phase helps students raise awareness of water resource
protection, the role of water for human life and nature. I will use some video to help them
figure out basic information about water resource. It is easy way to teach children.
After that, I intend to organize exhibition "Save water – save future" with the
water-related topics such as water pollution, the role of water for human and so on. These
photo and drawing will be performed by student themselves joined into our training course.
All of their parent will be invited. This exhibition is also the way to donate money directly
for establishing waste water treatment in Van Phuc.
The second phase, with a view to receiving money donated in short time period and
in support of not only inside Van Phuc community but also outside ones, is necessary to
create a “Crown funding” campaign. These campaigns are typically performed via:
Monetary donations where all the money goes to the charity or group. Merchandise sales
where all, or a portion, of the proceeds is given to the charity or group.
9
5. RESULTS
5.1. Water pollution situation in Van Phuc handicraft village
Van Phuc used to be reckoned among 90% of craft villages have pollution level
well above the standards set by the national environmental protection law (MONRE 2008).
Most wells in eastern Van Phuc contain arsenic concentrations 10 – 50 times beyond the
guideline for arsenic in drinking water set by WHO (van Geen et al., 2013).
Diagram 1 The comparison some water indicators in with the standards of Vietnam
– QCVN14: 2008/BTNMT
Chart 2
150
120
83
81
72
90
NH4+ concentration [mg/l]
BOD5 concentration [mg/l]
Chart 1
142
60
59
60
30
0
1st
2 nd
1st
2010
2 nd
2012
BOD5
1st
2 nd
50
39
34
40
25
30
17
20
1st
2 nd
2010
NH4+
8700 8550
10000
5000
0
2 nd
2010
Coliforms
1st
2 nd
2014
QCVN14: 2008/BTNMT
150
15500
12000 11000
1st
2 nd
Chart 4
TSS concentration [mg/l]
Coliforms [MNP/100ml]
15000
14000
1st
2012
Chart 3
20000
9.9
0
2014
QCVN14: 2008/BTNMT
10.2
10
1st
2 nd
2012
1st
2 nd
2014
QCVN14: 2008/BTNMT
100
93
92
76
78
83
80
1st
2 nd
1st
2 nd
50
0
1st
2 nd
2010
TSS
2012
2014
QCVN14: 2008/BTNMT
Source: Environment Analysis Department - 2010, 2012, and 2014
Waste water causes serious pollution on surface and ground water environment out
of being discharged directly to the environment. The water issues at Van Phuc Handicraft
Village reveals the characteristics of pollutants such as BOD5, COD, color, chemicals from
10
dyeing and weaving activities. Besides, around 85% - 90% of the chemicals using the
production’s process is soluble in water and this process also require high volumes of
wastewater containing a high concentration of organic matters (Report of Environmental
information – Ha Dong district, 2014). Due to the more expansion of production without
wastewater treatment system, the more wastewater quality reduces.
The diagram 1 illustrates the results of analyzing water sample in the canal Hong
Phong hamlet of Van Phuc village which is the place received domestic waste over three
periods of time. As can be seen from the former diagram, over the years, a water resource
in Van Phuc was eutrophic by phosphorus and nitrogen, which contained many suspended
substance and organic matter. It is the same situation with domestic water pollution.
Moreover, the BOD5 concentration was quite high and exceeds the level for domestic use
of Vietnam standards level following QCVN14: 2008/BTNMT. Although the amount of
coli form witnessed the decreasing trend during these years, the former was still higher
than standards of QCVN14: 2008/BTNMT. Meanwhile, TSS concentration revealed that it
is lower than the standard of QCVN14: 2008/BTNMT.
In search of finding out the reason why water quality therein has experienced this
trend, the results in interviewing local officials in Van Phuc Committee showed that since
1998, following the craft sustainability policy, local governments have equipped with a
better understanding of the drivers of water pollution in local area and implemented such
policies with a view to reducing the issues such as centralizing production in an area,
minimizing scale of dyeing households, mobilizing local handcrafters avoided using
chemicals to dye and boil silk and supporting for them purchase color
silk thread
associated with gradually transforming into only weaving and selling products to maintain
traditional handcraft village. However, hardly is water pollution solved without reasonable
and sustainable measures of both side governments and local residents.
11
Diagram 2 The comparison some water indicators in with the standards of Vietnam –
QCVN14: 2008/BTNMT
Chart 6
COD concentration [mg/l]
BOD5 concentration [mg/l]
Chart 5
20
15
9
10
13
11
9
13
11
5
0
1st 2 nd 1st 2 nd 1st 2 nd
2010
BOD5
2012
2014
35
30
25
22
22
1st
2 nd
10
5
0
TSS concentration [mg/l]
Coliforms [MNP/100ml]
3000
0
2010
Coliforms
2 nd
1st
2 nd
2012
2014
QCVN14: 2008/BTNMT
Chart 8
6000
1st
1st
2010
COD
7200 7100 7000 7200 6850 6780
2 nd
22
15
QCVN14: 2008/BTNMT
1st
25
20
Chart 7
9000
27
25
2 nd
2012
1st
2 nd
2014
QCVN14: 2008/BTNMT
100
50
27
30
32
1st
2 nd
1st
40
47
22
0
2010
TSS
2 nd
2012
1st
2 nd
2014
QCVN14: 2008/BTNMT
Source: Environment Analysis Department 2010, 2012, and 2014
According to the results of analyzing water sample in Van Phuc village’s pond and
the graphs drew the comparison with the standards of Vietnam – QCVN14: 2008/BTNMT,
it depicted that water quality in the pond has nearly reached the standards of Vietnam. It
raises an alarm if it was not for effectively and efficiently using and managing, the former
would be polluted.
12
5.2. Awareness and behavior of villagers on water pollution situation and ability to
build PR campaign in Van Phuc handicraft village
With respect to selected socio-demographic characteristics of the local residents
interviewed, the information about the personal profile of interviewers is displayed in table 3.
Table 3. Descriptive results for selected variables
Frequency (N=50)
Sex
Percentage
Male
36
72
Female
14
28
Total
50
Occupation
Silk handcrafts
16
32
Non – silk handcrafts
34
68
Total
50
Age
Under 26
3
6
26 – 35
10
20
36 – 45
14
28
46 – 55
10
20
56 – 65
6
12
Over 65
7
14
Total
50
Education level
Illiterate
1
2
Primary school
1
2
Secondary school
2
4
13
High school
Vocational school
College or University
Post University
Total
19
38
1
2
24
48
2
4
50
Monthly average income
Under 2 million VND
6
12
2 - 4 million VND
12
24
4 - 6 million VND
15
30
6 - 8 million VND
7
14
8 - 10 million VND
5
10
Over 10 million VND
5
10
Total
50
Source: Results calculated by the author based on data surveyed, 2015
Fifty respondents completed the survey (72%) men, and (28%) women were
interviewed. The above percentage does not imply that there are more men than women in
the study area. Majority of the respondents were non-silk handcrafts and belonged to the
age groups of 36-45 years. Maximum respondents were graduated from college or
university, followed by high school at level of education. As far as level of income is
concerned a major percentage of the respondents were having monthly income less than 4 6 million VND.
Although water pollution issue is not a new concept and people are also getting
familiar with it, yet this awareness has not lead local residents to practical actions in an
endeavor to reduce water pollution situation. Table 4 depicts the awareness of respondents
about water pollution situation in Van Phuc.
14
Most respondents had already known and awarded about water pollution issues and made
up 96% the proportion of the interviewers. Besides, 98% the former also reckoned that
water surrounding local area is polluted and 36% ones thought that domestic water using is
polluted. However, only 20% of the figure of those believed that they have directly
responsibilities for protecting water resources while over 90% of them desiring for
building waste water treatment in local area.
According to the results of such interviews, there are two main causes. The first is that
local people have judicious awareness yet about the effects of water pollution on their
health. It leads to the lack of responsibilities into protecting water. Besides, not only do
local residents lack practical knowledge but they also hardly approach source of
information about the ways to protect and deal with water pollution. In addition to, asking
the question “how many local household are using water purify or water treatment?” the
figure achieved is 95% in total household.
Table 4 Local’s awareness about water pollution situation in Van Phuc
Frequency
Percentage
Awareness about water pollution situation
(N=50)
Not Aware/ not exposed
2
4
Aware/exposed and subscribed
48
96
Total
50
Think about personal directly responsibilities for
protecting water resources
Yes
10
20
No
40
80
Total
50
Personal opinions about water pollution
15
Is water surrounding local area polluted?
Strongly Agree
35
70
Agree
14
28
Moderate
1
2
Disagree
0
0
Strongly Disagree
0
0
Total
50
Is domestic water using polluted?
Strongly Agree
3
6
Agree
15
30
Moderate
30
60
Disagree
2
4
Strongly Disagree
0
0
Total
50
Source: Results calculated by the author based on data surveyed, 2015
Regression results (table 5) show that as expected, age, education level, monthly
average income, local environment communication have positive effect on respondents’
attitude towards water pollution situation. The regressions coefficients of these
independent variables are highly significant at lower than 0.005 level of significant. Sex
and occupation have negative influence on the dependent variable. The regression
coefficient of them is significant at in turn 0.024 and 0.016 level of significant.
16
Table 5 Effect of some selected variables on respondents’ attitude towards water pollution
situation
Dependent
Regression
Std.
t
Sig.
variable
Independent variable
coefficient
Error
Attitude
Sex
-0.098
-0.717
0.024 0.054
towards
Occupation
-0.362
-1.927
0.016 0.079
water
Age
0.420
3.012
0.004 0.020
pollution
Education level
0.247
1.721
0.002 0.022
situation
Monthly average income
0.174
0.918
0.003 0.025
Local environment communication 0.160
1.154
0.002 0.013
Source: Results calculated by the author based on data surveyed, 2015
The positive significant effect of age, education level, monthly average income,
local environment communication on respondents’ attitude towards water pollution
situation obtained from the data analysis results have been demonstrated if local residents
have a good living condition with high income and receive formal schooling, especially,
being approached with information about environmental issues such as water pollution,
water source degradation, their awareness or attitude towards these problems is higher.
On the other hand, the statistical negative relationship of sex and occupation of
respondents attitude towards water pollution could be contributed the fact that women are
active users water resources in terms of water domestic consume although in each
household, men often becomes householders. They involved in many activities which use
of water such as washing and cleaning. Moreover, in Van Phuc handcraft village, women
take the main responsibility to dyeing and weaving silk thread. Therefore, in the study
area, women play a significant role in the use of water and drivers to water pollution. They
have a high level of awareness of water using.
17
The further analysis has been made in order to know about respondents’ willingness
to pay for building waste water treatment. Not only were the questions asked to give
answers for followings: ready to pay, still need sometime, pay money only if certain
conditions will fulfill, not ready to pay, no response but these also were asked to rank the
conditions in the order of priority by assigning 5 to most prefer and 1 to least prefer
condition for the amount money paying.
Table 6 Willingness to pay for building waste water treatment
Frequency (N=50)
Percentage
33
66
Still need sometimes
5
10
Pay money only if certain conditions will fulfil
9
18
Not ready to pay
2
4
No response
1
2
Particulars
Ready to pay
Total
50
Amount willing to pay for built waste water
Rank
treatment per household member
Up to 20 000 VND
4
4
21 000 VND – 100 000 VND
22
1
100 001 VND – 500 000 VND
17
2
500 001 VND – 1 000 000 VND
5
3
Over 1 000 000 VND
2
5
Total
50
Source: Results calculated by the author based on data surveyed, 2015
Table 6 shows that 66 % of respondents are ready to pay, as oppose to 10 %, 18%
and 4 % of them are still need some times, will pay money only if certain condition fulfill
and 2% not provide any response. As far as ranking of different amount conditions where
respondents are willing to pay for built waste water treatment, the amount range ranked the
first position is from 21,000 VND to 100,000 VND.
18