Monitoring land cover changes in tien hai nature reserve thai binh province using multi temporal landsat data
Bạn đang xem bản rút gọn của tài liệu. Xem và tải ngay bản đầy đủ của tài liệu tại đây (891.68 KB, 71 trang )
ACKNOWLEDGEMENT
This thesis would not have been possible without the support and help from my
teachers, friends, families and several people. I would like to express our special
appreciation of following people who supported me with my sincere gratitude:
I would like to express my sincere thanks and appreciation to my supervisor Dr.
Nguyen Hai Hoa for his untiring and excellent guidance, valuable suggestions in my
dilemmas. His comments and advices have helped me to finish my thesis.
I am also thankful to Prof. Lee MacDonald for his enthusiasm in guiding me to
construct thesis proposal. His comments and criticism on my proposal helped me to present
better final thesis.
Further, I would like to thank the Department of Natural Resources and
Environment in Tien Hai district for support and giving me the chance to study in Tien Hai
Nature Reserve. Besides, I also thank the local authorities and famers in three communes
(Nam Hung, Nam Phu, Nam Thinh) for providing valuable information and data of the
area.
I wish to thank the Center of Laboratory and Practice of Vietnam Forestry
University for providing me with survey instrument (GPS Garmin) for field survey. I also
thank my friends for their enthusiastic help in the process collected data in field survey.
Last but not least, my everlasting gratitude goes to my parents who always
encouraged and supporting me all the time.
TABLE OF CONTENTS
ACKNOWLEDGEMENT
TABLE OF CONTENTS
ABBREVIATIONS
LIST OF TABLES
LIST OF FIGURES
ABSTRACT ..................................................................................................................................... 1
Chapter I INTRODUCTION .......................................................................................................... 3
Chapter II LITERATURE REVIEW .............................................................................................. 6
2.1. Applications of GIS and Remote Sensing to monitor land use and land cover .................... 6
2.1.1. Land use and land cover ........................................................................................................ 6
2.1.2. GIS - Remote Sensing and monitoring land use - land cover ............................................. 6
2.1.3. Studies of application of GIS and Remote Sensing to detect land use and land cover...... 7
2.2. Studies of land use and land cover in Tien Hai Nature Reserve .......................................... 10
2.2.1. Key study .............................................................................................................................. 10
2.2.2. Key significant issues in Tien Hai Nature Reserve ............................................................ 10
Chapter III STUDY GOAL, SPECIFIC OBJECTIVES, METHODOLOGY .......................... 12
3.1. Study goal ................................................................................................................................ 12
3.2. Specific objectives ................................................................................................................... 12
3.3.1. Data collection ...................................................................................................................... 14
3.3.2. Integration of multi-temporal Landsat data and GIS ......................................................... 15
5.2.5. Change detection .................................................................................................................. 23
Chapter IV STUDY SITE, NATURAL AND SOCIO-ECONOMIC FEATURES ................. 24
4.1. Study site .................................................................................................................................. 24
4.2. Natural features........................................................................................................................ 24
Chapter V RESULTS AND DISCUSSION ................................................................................. 28
5.1. Current status of coastal land cover and its management schemes ...................................... 28
5.1.1. Current status of coastal land cover in Tien Hai Nature Reserve ..................................... 28
5.1.2. Management schemes of Tien Hai Nature Reserve ........................................................... 29
5.2. Changes in coastal land covers in Tien Hai Nature Reserve from 2001 to 2015 ................ 31
5.2.1. Thematic coastal land covers in Tien Hai Nature Reserve ................................................ 32
5.2.2. Accuracy assessment of coastal land cover classification ................................................. 39
5.2.3. Spatial land cover change analysis during 2001 - 2015..................................................... 40
5.3. Key drivers of land cover change in the Tien Hai Nature Reserve ...................................... 49
5.3.1. Human - induced drivers and coastal land cover change .................................................. 49
5.3.2. Natural - induced forces and coastal land cover change .................................................... 54
5.4. Solutions for better management of coastal land use in Tien Hai Nature Reserve ............. 55
Chapter VI GENERAL CONCLUSION, LIMITATIONS AND FURTHER STUDY ........... 58
6.1. General conclusion .................................................................................................................. 58
6.2. Limitations ............................................................................................................................... 59
6.3. Further studies ......................................................................................................................... 60
REFERENCES
APPENDICES
ABBREVIATIONS
ASTER
Advanced Spaceborne Thermal Emission and Reflection Radiometer
ENVI
Exelis Visual Information Solutions
ETM+
Enhanced Thematic Mapper Plus
FCC
False Colour Combination
GCPs
Ground control points
GIS
Geographic Information System
GPS
Geographic Position System
IBA
Important Bird and Biodiversity Area
IUCN
International Union for Conservation of Nature
LULC
Land Use Land Cover
MARD
Ministry of Agriculture and Rural Development
MCD
Centre for Marinelife Conservation and Community Development
MODIS
Moderate-resolution Imaging Spectroradiometer
MSS
Multispectral Scanner System
NASA
National Aeronautics and Space Administration
NDVI
Normalized Difference Vegetation Index
NGO
Non-Governmental Organization
OLI
Operational Land Imager
RGB
Red Green Blue
RS
Remote Sensing
SPOT
Satellite Pour l’Observation de la Terre
SWIR
Short Wave Infrared
TIF
Tagged Image File Format
TIRS
Thermal Infrared Sensor
TM
Thematic Mapper
UNESCO
United Nations Educational, Scientific and Cultural Organization
USGU
US Geological Survey
UTM
Universal Transverse Mercator
WGS
World Geodetic System
LIST OF TABLES
Table 3.1: Satellite images used for the study. ............................................................................. 17
Table 3.2: Ground control points (GCPs) and land cover classes ............................................... 18
Table 3.3: Description of land cover classification used.............................................................. 21
Table 5.1: Summary of area of land cover classes from 2001 to 2015 (ha). .............................. 32
Table 5.2: Error matrix of accuracy assessment for image classification in 2015. .................... 39
Table 5.3: Changes in area of land cover classes in different periods. ....................................... 41
Table 5.4: Change detection of land cover classes from 2001 to 2006 (ha). .............................. 42
Table 5.5: Change detection of land cover classes from 2006 to 2015 (ha). .............................. 45
Table 5.6: Change detection of land cover from 2001 to 2015 (ha). .......................................... 47
LIST OF FIGURES
Figure 3.1: Overview flowchart of study objectives. ................................................................... 13
Figure 3.2: Flowchart of methodology for image classification and change mapping. ............. 16
Figure 3.3: Landsat images and their band combinations used in this study.............................. 20
Figure 4.1: Location of study site in Tien Hai district.................................................................. 27
Figure 5.1: Land cover classes for 2001, 2006 and 2015 (ha). .................................................... 32
Figure 5.2: Area of land cover classes in 2001 ............................................................................. 33
Figure 5.3: Thematic land cover of Tien Hai Nature Reserve in 2001. ...................................... 34
Figure 5.4: Areas of land cover classes in 2006 (ha). .................................................................. 35
Figure 5.5: Thematic land cover of Tien Hai Nature Reserve in 2006. ...................................... 36
Figure 5.6: Area of land cover classes (ha) in 2015. .................................................................... 37
Figure 5.7: Thematic land cover of Tien Hai Nature Reserve in 2015. ...................................... 38
Figure 5.8: Changes in area of land cover classes from 2001 to 2015 (ha) ................................ 42
Figure 5.9: Land cover changes in Tien Hai Nature Reserve from 2001 to 2006...................... 44
Figure 5.10: Land cover changes in Tien Hai Nature Reserve from 2006 to 2015. .................. 46
Figure 5.11: Land cover changes in Tien Hai Nature Reserve from 2001 to 2015. .................. 48
ABSTRACT
Land cover is considered as a fundamental component for sustainable management
of natural resource and monitoring environmental change. In recent years, with increasing
in anthropology activities and climate change, land cover is dramatically changed; and
impact adversely affected to environment. Tien Hai Nature Reserve is coastal wetland
zone, has a vital role in contributed immeasurable socio-economic, cultural, and
environmental value at local, provincial regional, national level. Therefore, Tien Hai
Nature Reserve is facing with decline in function and natural resource of the area by
human activities and natural calamity. This study is carried out with aim was to monitoring
land cover change in Tien Hai Nature Reserve from 2001 to 2015 using multi-temporal
Landsat data combine with GIS technique. From that, would have an overview about land
cover change which contributed better management of the Tien Hai Nature Reserve.
For this study, multi-temporal Landsat imagery includes Landsat 5 TM, Landsat 7
ETM+ and Landsat 8 OLI/TIRS were analyzed using ArcGIS software; and Global
Position System (GPS) was acquired for collected ground control points in the field. Iso
cluster unsupervised classification was chosen to extract information from satellite data
with five land cover classes were identified including water, built-up/sand, casuarinas,
mangroves; and others. The result of the classification classes given 85.6% accuracy in
2015. The change detection of land cover is divided into 2 periods (2001-2006 and 20062015). In overall, casuarinas and built-up/sand slightly changed, and have tended to
increased during 14 years. Water, mangroves, others have largely changed. Mangroves
area decreased 245.6 ha in 2001 to 2006, after increased 331.3 ha from 2006 to 2015. Area
coverage of water increased from 2001 to 2006, decreased from 2006 to 2015. In contrary,
others area decreased from 2001 to 2006, increased from 2006 to 2015.
1
The data on driving factors of land cover were obtained by interviews. The factors
of driver land cover change of Tien Hai Nature Reserve included both human activities and
natural calamity. However, human induced is mainly contributed with activities is
represented by awareness of local people and management plans of board management. In
addition, natural factors such as storm, sea wave, sea level rise, also drive of change in land
cover in Tien Hai Nature Reserve.
2
Chapter I
INTRODUCTION
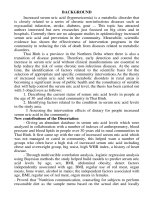
Most current land use and land cover patterns on the earth reflect the interaction of
human activities and the natural environment. However, alteration of land cover takes place
primarily because of anthropological activities rather than natural causes. Land cover is
understood as surface cover on the ground of land, including water, vegetation, bare soil, and
artificial structures (Dewan and Yamahuchi, 2009). Human driven forces such as
agricultural, mining, deforestation, construction that influence on shifting patterns of land
use and land cover (Dewan and Yamahuchi, 2009). Natural contribution to changes in land
cover includes storm, erosion, flood, earthquake and sea level rise. What is mentioning is
that human activities are intensifying these natural impacts on land cover change. In recent
years, growing human population has led to dramatically changes in land cover. Moreover,
land cover change is supposed as a primary component of many current environmental
concerns (Frimpong, 2011). In other words, land cover change is gaining recognized a key
driver of environmental change. Changes in land cover and land use are pervasive and
rapidly increasing which can have adverse impacts at local, regional and global scales
(Frimpong, 2011). Therefore, qualitative and quantitative information about land cover
changes are useful for sustainable management of natural resources, monitoring environment
change, and minimize adverse consequence of environment as well. Understanding land
cover change can provide essential information for forming policies regarding social
economic development and environment. Therefore, accurate and update information on
land cover change is necessary for building a suitable future land use policy.
Satellite data with their repetitive nature have proved to be useful in mapping land
use/land cover patterns and temporal changes. Multi-temporal imagery data can be used for
detecting and quantifying land cover change over time, thus providing significant information
for monitoring environmental change and natural resource use (Bottomley, 1998).
3
In addition, the integration Remote Sensing technology and Geographical Position
System (GIS) in assessing the changes in land use/land covers is used increasingly due to
its powerful - cost effectiveness. Remote sensing based techniques are now able provides
vital tools for the assessment of land cover/land use in the management, with provide
valuable and timely information on the nature resources and the environment. GIS can
provide a flexible environment for collecting, storing, displaying and analyzing digital data
necessary for change detection (Reis, 2008). By using these techniques, it is possible to
obtain a series of synoptic data for large geographic areas uniformly in time and space
without exhaustive and expensive field surveys.
Coastal wetland areas are highly vulnerable by both human activities and natural
calamities. With more than 3200 km of coastline, Vietnam has a large area of coastal
wetland that provides a diverse range of natural resource and favorable conditions for
social
and
economic
development
(fisheries,
aquaculture,
agriculture, tourism,
transportation, urbanization, etc.). Notably, eighty percent of Viet Nam's population is
settled within wetlands (MARD, 2004). However, these coastal zones are also highly
vulnerable by natural disaster such as storm, erosion, earthquakes, and sea level rise.
Moreover, human activities such as mangrove logging for shrimp ponds, fuel wood,
irregular exploitation, are intensify these natural impacts. Therefore, to hazard mitigation,
environment protection, conservation and sustainable use natural resources, are concerns
and purpose of management of these zone.
Like others coastal wetland zones in Vietnam, Tien Hai Nature Reserve in Thai
Binh province is very sensitive, vulnerable zone. Covering 10km length of coastline, and
located in the left bank of the Red River (estuary Ba Lat river), the Nature Reserve has
been recognized by UNESCO, as a one of the core importance of Red River biosphere
reserve in 2004. With located in estuary Ba Lat river, it has very high biodiversity, rich
4
aquatic, and high number of birds. Having very rich natural resources, thus this area is a
place has dense population, and associated with livelihood of local communities.
Therefore, there are no denial is that Tien Hai Nature Reserve play a vital role in socioeconomic development, disaster prevention, environmental protection, and conservation
and development of biodiversity. It is worth noting that Tien Hai Nature Reserve is facing
with overexploitation resources for daily consumption of local communities, and
exportation. Natural resource has been depleted by overexploitation, unsustainable use
resources of local communities. In addition, the area is place that is always incurred threats
caused by climate change such as natural disaster, sea level rise and environment pollution.
Tien Hai Nature Reserve is typically place about alternative dramatically of land cover due
to strong impact from human activities and natural calamities. In recent years, with global
climate change, and sea level rise is more concentrated, a threatening for coastal zones.
Hence, if management plan is lax, unreasonable or inconsistent policy and legislative
system for coastal wetland management, that will lead to degraded of zone, environment
change, loss of biodiversity. These consequences will effect directly on human, and
threaten human security.
Recognizing the vulnerability of the region along with significance of monitoring
land cover in management resource; as well advances of GIS and RS for the management,
so the topic "Monitoring land cover changes in Tien Hai Nature Reserve, Thai Binh
province using multi-temporal Landsat data" is selected. This study used a series of
Landsat satellite images from 2001 to 2015 to analyze land cover change, thus providing
an overview and updating information about coastal land cover and its change the last 14
years.
5
Chapter II
LITERATURE REVIEW
2.1. Applications of GIS and Remote Sensing to monitor land use and land cover
2.1.1. Land use and land cover
Land use include the modification and/or management of land for agriculture,
settlements, forestry and other uses including those that exclude humans from land (Ellis et
al. 2009).
Land cover refers to the physical and biological cover over the surface of land,
including water, vegetation, bare soil, and/or artificial structures (Ellis et al. 2009). Land
cover is characteristics of land that can be observe physically, as by remote sensing.
2.1.2. GIS - Remote Sensing and monitoring land use - land cover
Remote Sensing is a process of acquiring information about the Earth's surface
without actually being in contact with it. This is done by sensing and recording reflected or
emitted energy and processing, analyzing and applying that information.(Canada Centre
for Remote Sensing, 2008).
Geographic Information System (GIS) is a system designed to capture, store,
manipulate, analyze, manage, and present all types of geographical data.
Integration of GIS and remote sensing technologies is effective tool for
management of natural resource. When land use and land cover change became a central
component in current strategies for managing natural resources and monitoring
environmental changes. Remote Sensing technique for land cover change detection and
monitoring in recent times has been used to assess the change in land cover two or more
time periods caused by environmental conditions and human actions. The integration of
Remote Sensing and GIS approaches, are providing new tools for advanced environmental
and natural resource management, by providing the ability to monitor change over time at
6
local, regional, and global scales. The quantification of land use land cover changes is
very useful for environmental management, policy makers and for public to better
understand the surrounding.
2
.1
3
S
tu
d
ie
so
fa
plica
to
nfG
IS
a
n
d
R
m
e
o
tS
nsig
e
to
de
tcla
n
d
use
a
n
d
la
n
d
cove
r
Key world studies of coastal land use and land cover:
In recent years, we have facing with growing population and climate change and;
the issues about environment and natural resources are paid to great concern worldwide.
Moreover, with strong development of modern technology, it is recognized the significant
role of LULC in management of natural resource and environment. Therefore, leading to
more and more number of studies of LULC were carried out by researchers, scientists,
managers; especially in current changing climate. There are several researches in the
world:
In the study of AL Sghair (2013), author used remote sensing (Landsat TM and
aerial photographs) and GIS technical combination with ground truthing work to assess
wetland vegetation change over time at two contrasting wetland sites including freshwater
wetland and saltmarsh in the UK. Unsupervised and supervised classifications were used in
this study to interpret the change of vegetation cover. The author had showed the temporal
change in vegetation during the period of study, most likely primarily produced by the
management programme, rather than being due to natural change. In his study, he proved
that the RS and GIS approach can provide useful baseline data about wetland vegetation
change over time, and across quite expansive areas, which can therefore provide valuable
information to aid the management and conservation of wetland habitats.
Srivastava et al., (2014) conducted; the study of monitoring land cover changes in
coastal tract of Odisha using Landsat ETM+ imagery. The land cover change dynamics
were investigated by integration Remote Sensing approach and GIS. The images were
7
classified using unsupervised classification and a post-classification comparison approach
was used to detect the changes. The result of study was indicated that an increase in
agricultural areas while there is decrease in water bodies, soil and bare areas.
In short, the integration of GIS and RS in the world was appeared from early and
obtained many achievements in monitoring natural resource and environment. The
researchers used satellite image such as Landsat, Spot, Aster, Modis; and choosing image
will depend on each different objects. Sometime, to have process of interpretation with
high accuracy, the some authors used combined with aerial photography with high
resolution. In the study, the authors also carried out many different classification methods
to compare result of each methods such as unsupervised, supervised, NDVI. In generally,
using GIS and Remote sensing in the world were fairly diversified, both material data and
method.
Key studies of coastal land use and land cover in Vietnam:
In Vietnam, there are many studies and researches using RS and GIS to monitor
LULC, construct map; and detect the forest cover change, which support considerably to
management of natural resources and environment.
In the study of Nguyen Hai Hoa at el., (2013), authors assessed spatial-temporal
changes in the extent and width of fringe mangroves, and changes in adjacent land use.
The study focused on the Kien Giang Province, Vietnam, for the period 1989-2009, and
used four Landsat TM images (1989, 1992, 2003, and 2006) and three SPOT images
(1995, 2003, and 2009). Supervised classification was conducted for image classification
and mapping changes using a Maximum Livelihood Classifier approach. The result of
assessment of Landsat TM images showed a significant decrease in mangrove extent for
the periods 1989-1992 (-2.7% yr -1) and 2003-2006 (-2.1% yr-1). SPOT images were used
to classify shoreline land cover into four types, namely mangroves; shrimp farms; built-up
8
areas; and bare and wet ground areas. The loss of fringe mangrove extent was explained by
the increase in extent of other land covers, especially shrimp farms and bare and wet
ground, during the period of 2003-2009. The overall accuracy assessment of the
classification using 2003 and 2009, SPOT 5 images were 90.1% and 90.5% respectively.
The overall accuracy assessment of the 2003 Landsat image was 92.1%. The accuracy
assessment showed that use of Landsat images was adequate for assessing spatial-temporal
mangrove dynamics when higher spatial resolution satellite images were limited.
The study was conducted by Tran Trong Duc (2003) with the focus of monitoring
mangrove forest change in Can Gio district from 1993 to 2003. The author used postclassification comparison method to monitor mangrove forest change over time by using;
Landsat and Aster data. The map of mangrove forest is built with overall accuracy 80%.
The finding showed that there is a decline of mangrove forest area from 39000 ha in 1993
to 36000 ha in 2003. The main reason led to the change of mangrove forest in Can Gio
district due to inappropriate policy management in relation to coastal management.
Hanh Tran at el., (2015) conducted the study have aim to assess the spatio-temporal
dynamics of land cover/land use changes in the lower Mekong Delta over the last 40 years
from 1973 to 2011 with the coastal Tran Van Thoi District of Ca Mau Province. The
moderate to high spatial resolution (Landsat and SPOT) satellite images were used for
analyze land use/land cover change, with 6 intervals of time. Seven land cover class were
identified in the site, and classified in the ENVI 5.0 and ArcGIS 10.0 (ESRI) software.
Classification of map given accuracy with the lowest is 81%; and the highest is 89%. From
1973 to 2011, bare lands, cultivated lands, mangrove forest, and melaleuca forest
decreased. In contrast, aquaculture lands and built up areas increased. The research also
identifies the main drivers of land use changes in this delta region, which include
economical policies as well as demographic, socio-economic, and environmental changes.
9
In short, the integration of GIS and Remote Sensing in monitoring and management
of natural resource in Viet Nam was used widely, with more different field. There were
many kinds of Remote Sensing data were used in the researches such as Landsat, SPOT,
Aster. The ArcGIS and ENVI software were applied in image processing and spatial
analysis. The classification result given accuracy more than 80%. The studies also
identified main drivers of land use and land cover change; polices were majority reason
leading to this change. In generally, all of studies achieved goals which purpose.
2.2. Studies of land use and land cover in Tien Hai Nature Reserve
2.2.1. Key study
The studies of land use and land cover in Tien Hai Nature Reserve are very little.
There is a research of Nguyen Thanh Hien at el., (2004), the study assess the change in
land cover relate to shrimp ponds in two districts of northern Vietnam, namely Giao Thuy
and Tien Hai. Images from the Landsat TM and ETM+ sensors were used in this study
from 1986 to 2001. This study aimed to detect the changes by using two hybrid change
detection methods applied on TM/ETM+ images, and elucidated deforestation's causes in
two districts through different trends of mangrove alterations. The result showed that 63%
of mangrove areas have been replaced by shrimp ponds in Giao Thuy district from 1986 to
2001. And from 1994 to 2001 in Tien Hai, there are approximately 70% of its mangroves;
most of them were replaced by aquaculture ponds. Group of author was indicated that the
shrimp farming have potential negative impacts on environment, one of which is wetland
deterioration. The lost of mangroves, so popular in this region, leads to the loss of a natural
protection against tropical typhoons which are extremely important for the local
population’s livelihood and paddy production.
2.2.2. Key significant issues in Tien Hai Nature Reserve
10
In recent years, with increasing of population and climate change, the land use and
land cover in Tien Hai Nature Reserve is facing with dramatically change, threat to its
natural resource as well as environment. Besides, management board hasn't completed yet,
lack of staff, technique, and instrument for management. In addition, also lack of
researches about monitoring coastal land use and cover change over series time while it is
considered as a fundamental component in management plans of natural resource. Thus,
leading to weakness management, lack of specific management plans, and these solutions
to reduce factors cause damage for the area.
11
Chapter III
STUDY GOAL, SPECIFIC OBJECTIVES, METHODOLOGY
3.1. Study goal
Study goal: The primary aim of this study is to monitor land cover change in Tien
Hai Nature Reserve from 2001 to 2015 by using multi-temporal Landsat imagery data. The
findings of study will contribute to better management for Tien Hai Nature Reserves, Thai
Binh province.
Study hypothesis: In this study, the hypothesis of study is land cover changes have
been caused by human-induced drivers rather than natural-induced forces which is given
and will be tested by analyzing key drivers of land cover change in Tien Hai Nature
Reserve during 14 years. Moreover, the finding of research will provide better
understanding of land cover changes and solution in coastal zone, which could then better
inform coastal managers and policy makers aiming to lessen potential risks caused by
natural induced and human induced.
3.2. Specific objectives
To be consistent with study goal and hypothesis, the following objectives are
selected as below:
Objective 1: Investigate the status current of land cover and its management
schemes in Tien Hai Nature Reserve.
Objective 2: To quantify land cover changes in Tien Hai Nature Reserve from 2001
to 2015 using multi-temporal Landsat data. This objective includes two sub-objectives
stated as below:
Construct a single map of land cover in Tien Hai Nature Reserve each year of
2001, 2006 and 2015.
12
Monitor land cover changes in Tien Hai Nature Reserve in selected periods,
namely 2001- 2006, and 2006 - 2015.
Objective 3: To identify key drivers of land cover changes over the last 14 years in
Tien Hai Nature Reserve.
Objective 4: To propose solutions for better management of coastal land use in Tien
Hai Nature Reserve.
3.3. Study methodology
This part describes the methods and materials that were used and applied in the
study, including data collection, data processing, data analysis with a view to achieve the
set objectives. First of all, flowchart below (Figure 3.1) will provide an overview about
method proportion of each object.
Investigate the status current of land
Data collection
Reference materials
Interview data
use land cover and its management
schemes in Tien Hai Nature Reserve
Integration
Multi-temporal
Landsat imagery
Geographical
positioning system
(GIS)
Quantify land cover changes in Tien
Hai Nature Reserve from 2001 to 2015
Identify key drivers of land cover
changes over the study time in Tien Hai
Nature Reserve.
Propose
Reference materials
Knowledge
solutions
for
better
management of coastal land use in Tien
Hai Nature Reserve
Figure 3.1: Overview flowchart of study objectives.
13
3.3.1. Data collection
3.3.1.1. Interview data
Interview data was collected from interviews which are considered as a good way
to get information directly from people live in there. Due to they understand clearly about
this study site, so collecting information from them is very true and useful for research.
From interview, we can know the status current of land cover, schemes or regimes of
management, as well as driving factors of land cover change. To interview has good result,
survey questionnaire were designed (Appendix 1, 2). The interviews local people were
carried out with 15 famers belong to three communes of buffer zone of the Nature Reserve;
and number of farmers was chosen randomly during the processing of field work. In
addition, staffs of board management and local authorities of three communes also is one
of objects of interview.
The management board of Tien Hai Nature Reserve
Interview staffs of management board to get information about the current land
use-land cover of the area, as well as policy and regimes management, which are
implemented in Tien Hai Nature Reserve. Thence, could have an overview about the
protected area, processing of formation and change in the area. People belong to object of
interview: staffs of board management in Resources and Environment department in Tien
Hai district, local authorities of three communes: Nam Hung, Nam Phu, Nam Thinh.
Local communities in three communes of buffer zone
Local communities play an important role in management of the Nature Reserve,
because they affect directly on the Nature Reserve. They understand better than anyone
about the area. Therefore, getting information from local people is way to have real and
accurate those information about the area. The interview local people also can have an
overview about effectiveness of management plans of the Nature Reserve. In this study,
14
the interview local communities to determine reasons drive change of land cover during 14
years, from 2001 to 2015. And local people who towards to object of interview includes
old or middle-age people and people with experienced. Due to, they could provide much
information about the area in many years ago.
3.3.1.2. Reference materials
Reference material is another method to get more information about the study site,
besides interview data. The study used some information from the peer-reviewed articles,
report, news, newspaper, official documents about the Tien Hai Nature Reserve. These
findings can provide more information for investigate status of land cover, the
management schemes of Tien Hai Nature Reserve in current, as well as reasons of change
in land cover in last time.
3.3.2. Integration multi-temporal Landsat data and GIS
An integration of multi-temporal remote data and GIS provides a useful method to
quantify coastal land cover change in Tien Hai Nature Reserve from 2001 to 2015. To have
an overview of land cover change in Tien Hai nature reserve during 14 years, the study
firstly constructed a single map of land cover types in Tien Hai Nature Reserve each year
of 2001, 2006, and 2015 to evaluate and comment status of land cover through each year.
Then monitoring land cover changes in Tien Hai Nature Reserve in selected periods,
namely 2001- 2006, 2006 - 2015. Dividing certain period of coastal land cover is a good
way to detection more clearly about land cover change in given of period and how they
changes. The period of time is 5 and 9 years. This part describes the study area, method
and materials that were applied in the collection, processing, analysis data. The flowchart
below represents more detail sequences of steps.
15
Materials
Landsat image
2001, 2006, 2015
GPS Field
survey
Pre-processing
Boundary of
study area
Composite
Clip study
Band
bands
area
combinations
Image Classification
Unsupervised classification
Accuracy assessment
Land cover
2001
Land cover
2006
Land cover
2015
Raster calculation
Land cover
change
2001-2006
Land cover
change
2006-2015
Land cover
change
2001-2015
Figure 3.2: Flowchart of methodology for image classification and change mapping.
16
3.3.2.1. Materials and data
3.3.2.1.1. Landsat images
Landsat satellites have been collecting images of the Earth's surface for more than
forty years. NASA launched the first Landsat satellite in 1972, called Landsat 1 and the
most recent one, Landsat 8, on February 11, 2013.
In this study, Landsat 5 TM imagery in 2006, Landsat 7 ETM+ imagery in 2001;
and Landsat 8 OLI/TIRS imagery in 2015 were used. These images are freely available
from the Landsat archive in the United States Geological Survey (USGS).
This study site is coastal wetland zone, the feature of area is easily changed by
natural factors such as season, tide. Therefore, choice in satellite image is crucial for
monitoring land cover in coastal wetland. An image without cloud is obviously preferable.
But the date of acquisition images ensures fewer differences in solar illumination and
atmospheric conditions between years. In addition, the tide level is also a crucial factor in
the choice of the satellite images for the detection of coastal changes. Ideally, the tide level
must be similar between the periods, but that does not always correspond with satellite
passage. Therefore, in this study tried to collect the satellite images with fewer difference
of date acquired (Table 3.1). All of the images are acquired in the rain season, so high soil
of moisture, and having approximately equivalent tide level.
Table 3.1: Satellite images used for the study.
Codes
Satellite instrument
Date of acquired
Path x Row
LE71260462001272SGS00
Landsat 7 ETM+
September 29, 2001
126 x 46
LT51260462006262BJC00
Landsat 5 TM
September 19, 2001
126 x 46
July 10, 2015
126 x 46
LC81260462015191LGN00 Landsat 8 OLI/TIRS
Source: earthexplorer.usgs.gov
17
3.3.2.1.2. Softwares
In this study, ArcGis 10.1 software was used to process, analyze, calculate imagery
and construct map. This software was also used for change detection analyses.
3.3.2.1.3. Field survey
Field surveys were conducted from 20 July, 2015 to 20 August, 2015 to collect
ground control points, and with totally 660 points using the hand-held Garmin 78s Global
Positioning Systems (GPS). The collecting data with an error is less than 5 meters, and low
tide level. The survey aim determining the land cover types, provide data for classification
image, and true point for accuracy assessment. Based on characteristics or bio-physical
attribute of the area through field survey this study divided into five land cover classes as
water, built-up and sand, casuarinas, and mangroves, and others. With totally 660 points
(Ground control points) are divided for each land cover class (Table 3.2). GCPs from field
survey were registered by standard projection WGS84, datum UTM 48 North.
Table 3.2: Ground control points (GCPs) and land cover classes
No
Land cover classes
Number of GCPs
1
Water
100
2
Built-up and sand
130
3
Casuarinas
100
4
Mangroves
180
5
Others
150
Total
660
Source: Pham Thi Dung (2015)
18
3.3.2.2. Image pre-processing
All Landsat images used in this study were acquired under clear atmospheric
correction. The collected images were registered by standard projection, datum UTM 48
North, and the spatial resolution is 30 meters.
3.3.2.2.1. Clipping study area
In this step, the boundary of the study site was created and used to cut the study
area from the Landsat image using clipping tool in ArcGIS 10.1 software. The boundary of
the study area was formed as the shapefile and registered to the WGS84 UTM zone 48N.
3.3.2.2.2. Band combinations
Each satellite download from USGS, with each band separated as a TIF file. The
processing to composite bands TIF files from the single band to many bands in a single
image. Landsat images are composed of many different bands with 7 bands to Landsat
5TM, 8 bands to Landsat 7ETM+ and 11 bands to Landsat 8, each representing a different
proportion of the electromagnetic spectrum.
Individual bands can be composited in Red, Green, Blue combination in order to
visualize the data in color. These combinations are made that will have different advantage
using for classification each different feature such as forest, agricultural, building,
water,...Therefore changing these band combination and the RGB “channels” they are
assigned to in order to highlight different properties of features in the image. To
distinguish between different cover types, these False Colour Combination (FCC) images
are useful. In order of this study, with five different land cover, I used FCC of RGB=6-5-4
for Landsat 8 image 2015. This band combination uses short-wave infrared channel (band
6), near-infrared channel (band 5) and red channel (band 4), help for clearly defined
vegetations with green, high distinguishing between old forest and young forest, water is
blue or black. The bare soil, urban, agriculture area is also easy to identify. This
19