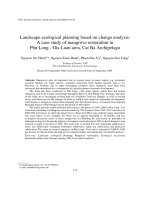
Monitoring changes in mangrove forests extents in phu long gia luan coast cat hai district hai phong viet nam during 2010 2019
Bạn đang xem bản rút gọn của tài liệu. Xem và tải ngay bản đầy đủ của tài liệu tại đây (3.61 MB, 93 trang )
VIETNAM NATIONAL UNIVERSITY OF FORESTRY
FOREST RESOURCES & ENVIRONMENTAL MANAGEMENT FACULTY
=========================
STUDENT THESIS PROPOSAL
MONITORING CHANGES IN MANGROVE FORESTS
EXTENTS IN PHU LONG- GIA LUAN COAST, CAT HAI
DISTRICT, HAI PHONG, VIET NAM DURING 2010 – 2019
Major: Natural Resources Management
Faculty: Forest Resources and Environmental Management
Student: Pham Nhu Quynh
Student ID: 1553100723
Class: K60 Natural Resources Management
Course: 2015-2019
Supervisor: Assoc. Prof. Dr. Hai-Hoa Nguyen
Vietnam National University of Forestry
Advanced Education Program
Developed in collaboration with Colorado State University, USA
Ha Noi, 2019
ABSTRACT
Mangrove forests are important coastal ecosystems located at the interface of the land
and sea, that support fisheries production, coastline protection, water quality control and
provide a nursery habitat for fish and other marine life. Monitoring mangrove forests changes
plays an important role for effective mangrove conservation and management. The study has
been conducted in Phu Long - Gia Luan region, which have the largest mangrove area in the
Cat Ba Archipelago Biosphere Reserve, Hai Phong City, Vietnam. However, the mangrove
ecosystem of this island has suffered severe deforestation and forest degradation due to the
conversion to shrimp aquaculture, increase in tourism and natural disaster. The aim of this
research to (1) investigate the status of mangrove forests and management scheme in Phu
Long, Gia Luan commune, Cat Hai district, Hai Phong province, (2) quantify changes in
mangrove forests extents in Phu Long and Gia Luan communes, Cat Hai, Hai Phong coast
during 2010- 2019 and identify drives of changes, (3) Estimate soil organic carbon of
mangrove forests and (4) Propose solutions to better manage mangrove forests in this area.
The land cover map was obtained by using unsupervised classification. Estimate soil organic
carbon stock by using Inverse Distance Weighted (IDW)- based interpolation approach in
study site. The research presents results obtained from study in the period of 2010-2019 in
Phu Long-Gia Luan including (1) Mangroves area in 2010 was 523.2 ha, in 2014, it increases
to 900.6 ha but in 2019, it decreased to 576.0, in which region with large fluctuations mainly
concentrated in Phu Long southern region meanwhile Gia Luan region is less changed. (2)
from 2010-2014, the implementation of many policies and projects had improved the quantify
and quality of mangroves but from 2014-2019 mangroves area decreased due to conversion of
mangrove forests to shrimp ponds, tourism development, mangroves rehabilitation and
restoration projects had been implemented, but they were not effective, (3) The soil carbon
stock of the mangrove forests in Phu Long- Gia Luan averages 200.38 ± 18.47 ton/ha, ranging
from 175.50 ton/ha to 253.93 ton/ha. This research shows the potential use of Satellite image
combined with techniques in monitoring mangrove forests change in Vietnam.
KEYWORDS: Phu Long, Gia Luan, GIS, Remote Sensing, Landsat image,
Mangrove forest management, Polices.
i
ACKNOWLEDGEMENTS
This research is supported by Vietnam National Foundation for Science and
Technology Development (NAFOSTED) under grant number 105.08-2017.05.
With the consent of Vietnam Forestry University, Ministry of Agriculture and Rural
Development faculty, we conducted the study.
First and foremost, I would like to give sincere thanks to my supervised and supported
by Assoc. Prof. Dr. Nguyen Hai Hoa, who gave helpful advices and always patiently
supervising me and urging me during implementation of thesis study. I have learned a lot
from him. Without this helping, I could not have finished my study successfully.
Secondly, I would like to thank for the encourage and suggestions of the teachers of
the Forest Resources and Environment Management Faculty, Vietnam Forestry University
that helped me complete the thesis with the best quality.
In addition, the field research could not be finished and achieved good results without
enthusiastic support of my friends, friendliness of local authority of Phu Long, Gia Luan
commune and especially supporting of Cat Ba National Park during my field research period.
Last but not least, I would like to say big thanks to my family and friends who always
supported and encouraged when I most needed it. To my parents, thank you so much your
unconditional love and moral support.
Due to the limited research capability and knowledge, the shortcoming of thesis is
inevitable. I am looking forward to receive comments, feedbacks from teachers, friends to
enhancing the quality of my thesis
Ha Noi, 10 October 2019
ii
TABLE OF CONTENT
ABSTRACT ............................................................................................................................. i
ACKNOWLEDGEMENTS ..................................................................................................... ii
TABLE OF CONTENT .......................................................................................................... iii
ABBREVIATION ................................................................................................................... v
LIST OF FIGURES ................................................................................................................ vi
LIST OF DIAGRAMS ............................................................................................................ vi
LIST OF TABLES ................................................................................................................. vii
CHAPTER I INTRODUCTION ............................................................................................. 1
CHAPTER II LITERATURE REVIEW ................................................................................. 3
2.1. Overview of mangrove and remote sensing data ............................................................... 3
2.1.1. Mangrove ....................................................................................................................... 3
2.1.2. Remote sensing .............................................................................................................. 7
2.2. Remote sensing application for mangrove monitoring .................................................... 12
2.2.1. In the world .................................................................................................................. 13
2.2.2. In Vietnam ................................................................................................................... 14
2.2.3. In Phu Long and Gia Luan communes. ........................................................................ 16
CHAPTER III STUDY GOALS, OBJECTIVE AND METHODOLOGY ........................... 17
3.3. METHODOLOGY.......................................................................................................... 17
3.3.1. Study site ..................................................................................................................... 17
3.3.2. Data collection ............................................................................................................. 18
3.3.3. Landsat images processing and classification............................................................... 21
3.3.4. Data analysis ................................................................................................................ 24
CHAPTER IV NATURAL, SOCIAL ECONOMIC AND CULTURAL CONDITIONS ..... 26
4.1. Natural characteristics .................................................................................................... 26
4.1.1. Geography.................................................................................................................... 26
4.1.2. Topography, climate, hydrology, soil, coast and sea, natural resources ........................ 27
4.2. Socio-Economic and cultural conditions ......................................................................... 31
4.2.1. Economic conditions .................................................................................................... 31
4.2.2. Social and cultural conditions ...................................................................................... 32
CHAPTER V RESULTS AND DISCUSSIONS ................................................................... 34
5.1. Current status and management scheme of mangrove forests in Phu Long and Gia Luan
communes .............................................................................................................................. 34
iii
5.1.1. History and current status of coastal mangrove forests in Phu Long and Gia Luan
communes .............................................................................................................................. 34
5.1.2. Management scheme and policies framework on coastal mangrove management ........ 36
5.2. Spatial-temporal dynamics of coastal mangrove extent during 2010-2019...................... 42
5.2.1. Thematic maps of coastal mangroves in different year and accuracy assessment ......... 42
5.2.2. Quantification of changes in mangrove forests and drives of changes .......................... 46
5.3. Soil organic carbon stocks............................................................................................... 48
5.3.1. Spatial distribution map of Soil carbon stock of mangrove forest in 2019.................... 48
5.3.2. Carbon price ................................................................................................................. 54
CHAPTER VI CONCLUSIONS, LIMITATIONS AND FURTHER STUDY ..................... 60
6.1. Conclusions..................................................................................................................... 60
6.2. Limitations ...................................................................................................................... 61
6.3. Further study ................................................................................................................... 61
REFERENCES ...................................................................................................................... 62
iv
ABBREVIATION
CMMP
Coastal Mangroves Management Polities
LULC
Land Use/ Land Cover
MSS
Multi-Spectral Scanner
TM
Thematic Mapper
ETM+
Enhanced Thematic Mapper
OLI
Operational Land Imager
TIRS
Thermal Infrared Sensors
PEES
Payment for Forest Environment Services
REDD+
Reduce Emissions from Deforestation and Forest Degradation
GIS
Geographic Information System
RS
Remote Sensing
GPS
Global Positioning System
NGOs
Non-Government Organization
MARD
Ministry of Agriculture and Rural Development
MONRE
Ministry of Natural Resource and Environment
PPC
Provincial People’s Committee
DPC
District People’s Committee
FPD
Forest Protection Department
FPsD
Forest Protection Sub-Department
VNFOREST Vietnam Administration of Forestry
GDLA
The General Department of Land Administration
VEA
The Vietnam Environment Administration
MCD
Center for Marinelife Conservation and Community Development
ERA
Ecological Risk Assessments
JRC
Japanese red cross
IFRC
International Federation of Red Cross and Red Crescent Societies
WWF
World Wild Fund
FFI
Fauna & Flora International
CER
Caron Emission Redution
CDM
Clean Development Mechanism
v
LIST OF FIGURES
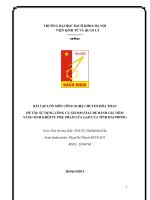
Fig 2.1. Physical and biological components of mangrove ecosystems. ................................... 3
Fig 2.2. Remote sensing process. ............................................................................................. 8
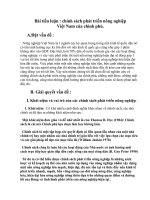
Fig. 3.1. Study site ................................................................................................................. 18
Fig. 3.2. Plot Positions in Study site....................................................................................... 21
Fig. 5.1. Land cover in Phu Long and Gia Luan in 2010 (Landsat 5, 03/10/2010).………….48
Fig. 5.2. Land covers in Phu Long and Gia Luan in 2015 (Landsat 5, 03/10/2010) …....…...48
Fig. 5.3. Land covers in Phu Long and Gia Luan in 2019 (Landsat 8, 18/05/2019)................ 45
Fig. 5.4 Changes in mangrove forests in Phu Long and Gia Luan communes during October
2010 - May 2019. ................................................................................................................... 46
Fig. 5.5. Land cover change from 2010 -2019........................................................................ 47
Fig. 5.6. Carbon stock in different depths in 4 sample plots ................................................... 49
Fig. 5.7. Soil organic carbon stocks of mangroves in Phu Long and Gia Luan in different soil
layers. .................................................................................................................................... 53
LIST OF DIAGRAMS
Diagram 3.1. Flow chart of overview methodology of research in Phu Long and Gia Luan
communes. ............................................................................................................................. 22
Diagram 5.1. Administrative structure of mangrove forest protection and management. ....... 37
vi
LIST OF TABLES
Table 2.1. Mangrove Area and Loss, 2000-2012 in the Top 10 Mangrove Rich Countries and
by Region................................................................................................................................. 5
Table 2.2. The extent of mangrove forest in Vietnam (in hectares). ......................................... 5
Table 2.3. Current distribution and origin of mangrove in Vietnam. ........................................ 6
Table 2.4. Characteristics of Landsat 8 Sensors. .................................................................... 10
Table 2.5. Landsat 5 Thematic mapper (TM). ........................................................................ 11
Table 2.6. Land Image (OLI) and Thermal Infrared Sensor (TIRS). ...................................... 12
Table 3.1. Satellite Images used in the research. .................................................................... 19
Table 5.1. Mangroves changes per commune in the Cat Ba island from 2010- 2015. ............ 35
Table 5.2 Mangrove plant species in Phu Long Gia Luan area (surveyed in March, 2008). ... 35
Table 5.3. Accuracy Assessments of the classified images in 2010, 2014 and 2019 by using
Supervised classification (%). ................................................................................................ 42
Table 5.5. Soil carbon stock data set in different soil layers (ton/ha). .................................... 48
Table 5.6. Total soil carbon sequestration and storage in Phu Long and Gia Luan coummunes.
............................................................................................................................................... 54
Table 5.7. The commercial value of soil carbon sequestration of mangrove forests in Phu
Long and Gia Luan communes. ............................................................................................. 54
vii
CHAPTER I
INTRODUCTION
Mangroves are dominant along many tropical and sub-tropical coastlines and are of
the most productive ecosystems on Earth with a mean production of 8.8 t C/ha/yr (Jennerjahn
and Ittekkot, 2002), play an important role in stabilizing shorelines and in helping reduce the
devastating impact of natural disasters such as tsunamis and hurricanes. As reviewed by
Barbier (1994, 2007), mangrove forests provide not only indirect uses, including air pollution
reduction, nutrient cycling, and watershed protection, they also provide important ecological
and societal goods and services including breeding and nursing grounds for marine, food,
medicines, fuel, and building materials for local communities (Wilkie and Fortune, 2003). In
addition, they have a staggering ability to sequester carbon from the atmosphere, and serve as
both a source and repository for nutrients and sediments for other inshore marine habitats,
such as seagrass beds and coral reefs.
With 3260 km of coastline in Vietnam, mangroves are recognized as a highly valuable
resource. There are 30 provinces and cities that have been associated with coastal mangroves
and coastal wetland areas (Hoa and Binh, 2016). But the area of mangrove forests has
declined dramatically during the century in Vietnam. Due to the lack of an integrated
approach to sustainable management, utilization and protection of the coastal zone and
economic interests in shrimp farming have led to the unstainable use of natural resources so
Mangroves have been overexploited or converted to various other forms of land use,
including agriculture, aquaculture, salt ponds, urban and industrial development and coastal
roads and embankments (Schmitt et al,2013; Kirui et al, 2013). The mangrove forests are also
affected by the impacts of climate change. Climate change is predicted to cause increased
intensity and frequency of storms, floods and droughts, increased saline intrusion, higher
rainfall during the rainy season and rising sea levels (Kirui et al, 2013). In the early 1940s,
Vietnam had more than 400,000ha of mangrove forests (Vietnam Environment Protection
Agency [VEPA] 2005). In 2014, the mangrove forests area was reduced to 85,000 ha, with
much lower biodiversity and biomass, and a very small percentage of that is natural forest
(VNFOREST, 2015; Powell et al, 2011; Luu, 2000).
Nowadays, the development of science and technology, especially the births of
Geographical Information System (GIS), Remote Sensing (RS) and satellite images, help us
so much to research forest cover change, study and propose some methods to manage the
natural resources and environment without direct contacts. Remote Sensing (RS) information
with many advantages like synchronous and updating information, broad covering ability and
1
covered everywhere in the Earth… and with rapid development of technology such as supply
information rapidly, exactly… So remote sensing has a great potential for monitoring changes
in mangrove coverage. Geographical Information System (GIS) can collect, update, manage
and analyze, represent geographical data in order to service applied mathematics relating to
geographical points of some subjects on the earth. It is best supported tool for resources and
environment management and planning.
There are few examining the relationship of spatial-temporal changes in coastal
mangroves and coastal adjacent land-use in association with coastal development policy, such
as the relationship between drivers of mangrove destruction and institutional arrangement and
policy over coastal resources, and other socio-economic influences. Therefore, certain
questions remain unanswered, including what is the relationship between coastal mangroves
and coastal shoreline erosion, and how resilient are coastal mangrove ecosystems to
increasing frequency and intensity of extreme events? From this idea, I conducted the
research “Monitoring changes in mangrove forest extents in Phu Long-Gia Luan coast,
Cat Hai district, Hai Phong, Viet Nam during 2010 – 2019”.
2
CHAPTER II
LITERATURE REVIEW
2.1. Overview of mangrove and remote sensing data
2.1.1. Mangrove
2.1.1.1. Definition
World scale Kathiresan and Bingham (2001) have defined mangroves as woody plants
that grow at the interface between land and sea in tropical and sub-tropical latitudes. These
plants, and the associated microbes, fungi, plants and animals, constitute the mangrove forest
community or mangal. The mangal and its associated abiotic factors constitute the mangrove
ecosystem. The term “Mangrove” often refers to both the plants and the forest community. To
avoid confusion, Macnae (1986) proposed that “mangal” should refer to the forest community
while “mangroves” should refer to the individual plant species. The term “Mangrove” is also
used as an adjective, as in “Mangrove tree” or “mangrove fauna”. Mangrove forest are
sometimes called “tidal forest”, “coastal woodlands” or “oceanic rain forest”.
Mangroves
Mangroves
associated
Mangal
microbial, flora,
fauna.
Ecosystem
Mangroves
microhabitat
Biological
microhabitat
Abiotic factors
Fig 2.1. Physical and biological components of mangrove ecosystems.
2.1.1.2. World scale
Mangroves have distributed in 112 countries and territories. Global coverage has been
variously estimated at 10 million hectares (Bunt, 1992), 14-15 million hectares (Schwamborn
and Saint-Paul, 1996) compared to 24 million hectares (Twilley et al., 1992). Estimates of
their total global areal extent have historically been unreliable due to the challenges of
consistent mapping at global scales, and the high level of loss sustained in past decades.
3
However, Spalding (1997) gave a recent estimate of over 18 million hectares, with 41,4 % in
South and Southeast Asia and an additional 23.5% in Indonesia. Mangroves are largely
restricted to latitudes between 300 North and 300 South. Northern extensions of this limit
occur in Japan (31022’N) and Bermuda (32020’N); southern extensions are in New Zealand
(38003’S), Australia (38045’S) and on the east coast of South Africa (32°59’S; Spalding,
1997, Yang et al., 1997). Approximately 60-70 contemporary mangrove species and
mangrove associates have been described across 40 genera (Spalding et al., 2010) which is
extremely low for a tropical forested ecosystem.
Giri et al. (2011) estimated that in 2000–2001, there were 137,760km2 of mangrove forest
area of the world in 118 countries and territories. The total mangrove area account for 0.7% of
total tropical forest of the world. The largest extent of mangroves is found in Asia (42%) followed
by Afica (20%), North and Central America (15%), Oceania (12%) and South America (11%).
Approximately 75% of mangroves concentrated in just 16 countries (Table 2.1).
Utilizing a different method, mangrove cover in 2000 was estimated by Hamilton and
Casey (2016) to cover 83,495km2, this is a decrease of 54,360 km2 from the 137,760 km2
total report by Giri et al. (2011). Myanmar, Indonesia, Malaysia, Cambodia and Guatemala all
have relatively high levels of tree loss within the mangrove biome. Again, Southeast Asia is
the region of most concern, with an average mangrove loss of 8.08% during the analysis
period. Although Myanmar has the highest rate of loss, Indonesia has by far the largest area
loss. The 3.11% mangrove loss in Indonesia equates to 749 km2 of mangrove loss and
constitutes almost half of all global mangrove deforestation. Within the Americas, Africa and
Australia the deforestation of mangrove is approaching zero, with nominal rates in many
countries. His decrease of 39% from MFW is primarily due to a differing definition of
mangrove used in the two analyses and does not evidence a substantial loss of mangrove or
any error by either set of authors.
4
Table 2.1. Mangrove Area and Loss, 2000-2012 in the Top 10 Mangrove Rich Countries
and by Region.
Giri et al (2011)
Hamilton and Casey (2016)
Mangrove
area in
2000 (km2)
Mangrove
area in 2000
(km2)
Mangrove
area in 2012
(km2)
Mangrove loss
per year 20002012 (%)
23,324
7675
4726
4172
0.26
0.05
0.41
0.04
3316
0.03
COUNTRY
24,073
Indonesia
7721
Brazil
4969
Malaysia
4190
Paqua New
Guinea
6537
3327
Nigeria
Australia
Source: Giri et al (2011); Hamilton and Casey (2016).
Indonesia
Australia
Brazil
Mexico
31,130
9780
9627
7419
2.1.1.3. Mangroves status in Vietnam
According to Hong (1984, 1991), geographical distribution of mangrove communities
in Vietnam is divided into 4 zones and 12 subzones.
Zone I: North-east coast from Ngoc cape to Do Son cape
Zone II: Northern delta from Do Son cape to Lach Truong river
Zone III: Central coast from Lach Truong to Vung Tau cape
Zone IV: Southern delta from Vung Tau cape to Ha Tien
Before the second Indochina war (1962-1971), it is estimated that mangrove forest in
Vietnam covered an area of about 400,000 ha (Maurand, 1943). 250,000 ha of these forest
was found mainly in the South of which approximately 200,000 ha were in Ca Mau peninsula
(Moquillon, 1950) and 40,000 ha in Rung Sat- Bien Hoa province and Saigon (Cuong, 1964).
Moquillon (1950) estimated that 149,982 ha of mangroves at Ca Mau cape were primary
forests.
Table 2.2. The extent of mangrove forest in Vietnam (in hectares).
Coastal area
Total area
Natural forest
Tree
Shrub
Plantation
North-East
39,400
3,000
Northern delta
7,000
2,800
Central
14,300
Southern
191,800
135,900
13,500
42,400
Total
252,500
141,700
64,200
46,600
36,400
4200
14,300
Source: FIPI, 1983.
5
Through the two Indochina wars, which together lasted almost 30 years, the quantity,
quality and composition of mangroves have changed greatly. In particular, the use of
herbicides during the Vietnam war (1962-1971) resulted in the destruction of nearly 40% of
the mangrove forests in Southern Vietnam. In other areas, mangroves were exploited for their
resources or replaced by agricultural and shrimp farms. Since 1983, the quantity of shrimp
captured in the sea has decreased in many localities due to over-fishing and consequently
mangrove forests have been increasingly, destroyed for shrimp farming. According to the
Forest Inventory and Planning Institute (FIPI, 1983), there are 252,500 ha of remaining
mangrove forest composed mainly of secondary growth, plantations and bushes, while natural
forests occupy only a small area. In some places, tree have been replaced by brushes and
shrubs (Table 2.2).
Viet Nam has lost over 80% of its mangroves since the 1950s. Mangrove restoration
and rehabilitation have been ongoing since 1991, Since 2001, under the financial support of
some NGOs from developed countries and technical supports from mangrove research
institutes and centers, mangrove restoration and rehabilitation have reversed the trend of
deforestation in Vietnam. According to the Report “Roots of the water: legal Frameworks for
Mangrove PES in Viet Nam” done by the Katoonba Group’s legal Initiative Country study
Series, Vietnam had, to the end of 2010, an estimate of 209,741 ha of mangroves, of which
152,131 ha was planted and 57,610 ha was natural ones (Tab.2.3). Of the total mangrove area,
60% exists in the Mekong delta, with an additional 20% found in the southeast region, and
almost 20% in the coastal north and Red River delta.
Table 2.3. Current distribution and origin of mangrove in Vietnam.
Location
Total Area
(ha)
% of total
Natural
(ha)
Planted (ha)
Quang Ninh, northern region
37,651
18
19,745
17,905
Central-Northern region
1,885
1
564
1,321
Central-Southern region
2
0
2
0
Southeast region
41,666
20
14,898
26,768
Mekong river delta
128,537
61
22,400
100,137
All Vietnam
209,741
100
57,610
152,131
Souce: Hawkins et al (2010).
6
2.1.2. Remote sensing
2.1.2.1. Definition
According Natural Resources Canada and Resources Naturelles Canada defined:
“Remote Sensing is a science (and to some extent, art) of acquiring information about
the Earth’s surface without actually being in contact with it. This is done by sensing and
recording reflected or emitted energy and processing, analyzing and applying that
information”.
2.1.2.2. The basic principles of Remote Sensing
Different objects reflect or emit different amounts of energy in different bands of the
electromagnetic spectrum. The amount of energy reflected or emitted depends on the
properties of both the material and the incident energy (angle of incidence, intensity and
wavelength). Detection and discrimination of objects or surface features is done through the
uniqueness of the reflected or emitted electromagnetic radiation from the object.
A device to detect this reflected or emitted electromagnetic radiation from an object is
called a “sensor” (e.g., cameras and scanners). A vehicle used to carry the sensor is called a
“platform” (e.g., aircrafts and satellites).
The sun provides a very convenient source of energy for remote sensing. The sun's
energy is either reflected, as it is for visible wavelengths, or absorbed and then reemitted, as it
is for thermal infrared wavelengths. Remote sensing systems which measure energy that is
naturally available are called passive sensors. Passive sensors can only be used to detect
energy when the naturally occurring energy is available. For all reflected energy, this can only
take place during the time when the sun is illuminating the Earth. energy that is naturally
emitted (such as thermal infrared) can be detected day or night, as long as the amount of
energy is large enough to be recorded. Active sensors, on the other hand, provide their own
energy source for illumination. The sensor emits radiation which is directed toward the target
to be investigated. The radiation reflected from that target is detected and measured by the
sensor. Advantages for active sensors include the ability to obtain measurements anytime,
regardless of the time of day or season. However, active systems require the generation of a
fairly large amount of energy to adequately illuminate targets.
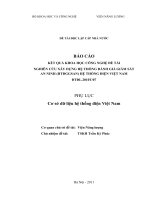
According “Fundamentals of Remote Sensing textbook”, the remote sensing process
involves an interaction between incident radiation and the targets of interest. This is
exemplified by the use of imaging systems where the following seven elements are involved.
Note, however that remote sensing also involves the sensing of emitted energy and the use of
non-imaging sensors:
7
1. Energy Source or Illumination (A) - the first requirement for remote sensing is to
have an energy source which illuminates or provides electromagnetic energy to the target of
interest.
2. Radiation and the Atmosphere (B) as the energy travels from its source to the
target, it will come in contact with and interact with the atmosphere it passes through. This
interaction may take place a second time as the energy travels from the target to the sensor.
3. Interaction with the Target (C) – once the energy makes its way to the target
through the atmosphere, it interacts with the target depending on the properties of both the
target and the radiation.
4. Recording of Energy by the Sensor (D) – after the energy has been scattered by, or
emitted from the target, we required a sensor (remote – not in contact with the target) to
collect and record the electromagnetic radiation.
5. Transmission, Reception and Processing (E) the energy recorded by the sensor has
to be transmitted, often in electronic form, to a receiving and processing station where the
data are processed into an image (hardcopy and/or digital).
6. Interpretation and Analysis (F)- the processed image is interpreted, visually and/or
digitally and electronically, to extract information about the target which was illuminated.
7. Application (G) – the final element of the remote sensing process is achieved when
we apply the information we have been able to extract from the imagery about the target in
order to better understand it, reveal some new information, or assist in solving a particular
problem.
These seven elements comprise the remote sensing process from beginning to end.
Fig 2.2. Remote sensing process.
8
2.1.2.3. Remote sensing application
Remote sensing finds a very wide range of applications, naturally including the area of
military reconnaissance in which many of the techniques had their origins. In the non-military
sphere, most application can loosely be categorized as “environmental”. And we can
distinguish a range of environmental variables that can be measured. In the atmosphere, these
include temperature, precipitation, the distribution and type of clouds, wind velocities, and the
concentrations of gases such as water vapour, carbon dioxide, ozone etc. Overland surfaces,
we can measure tectonic motion, topography, temperature, albedo (reflectance) and soil
moisture content, and determine the nature of the land cover in considerable detail, for
example by characterizing the type of vegetation and its state of health or by mapping manmade features such as roads and towns. Over ocean surfaces, we can measure the temperature,
topography (from which the Earth’s gravitational field, as well as ocean tides and currents,
can be inferred), wind velocity, wave energy spectra and colour (which is often related to
biological productivity by plankton). The ‘cryosphere’, that part of the Earth’s surface
covered by snow and ice, can also be studied, giving data on the distribution, condition and
dynamical behavior of snow, sea ice, icebergs, glaciers and ice sheets.
2.1.2.4. Landsat imagery
Between 1972 and 2013, the United States Geological Survey (USGS) and the
National Aeronautics and Space Administration (NASA) jointly launched eight Landsat
satellites that have, to date, acquired the most comprehensive land remote sensing data of our
planet (Markham et al., 2012; Markham and Helder, 2012). Dubbed the Landsat program, its
sensors have evolved from the Multi-Spectral Scanner (MSS) (Landsat 1-3) to Thematic
Mapper (TM) (Landsat 4-5), then the Enhanced TM (ETM+) (Landsat 6-7) and now the
Operational Land Imager (OLI) and Thermal Infrared Sensors (TIRS) (Landsat 8). The MSS
(1-3) provided data in four spectral channels (green, red, NIR-1, NIR-2) at a spatial resolution
of 80 m.
Landsat TM (4-5) satellites were designed to extend the spectral coverage of Landsat
MSS to the Shortwave (SWIR) section of the EM spectrum, while improving the spatial
resolution to 30m. A thermal infrared (TIR) band was also introduced with a spatial resolution
of 120m. The Landsat ETM+ (7) sensor was designed to maintain all the characteristics of
TM while introducing a 15m panchromatic band. Landsat OLI (8) collects data in the same
spectral bands as ETM+ but in slightly modified wavelengths of the EM spectrum (Irons et
al., 2012; Roy et al., 2014). Additional bands include a coastal/aerosol band, a cirrus band and
9
a quality assurance band that provides information on the presence of features such as clouds
and terrain occlusions.
Table 2.4. Characteristics of Landsat 8 Sensors.
Satellite
Sensor
Launch
Year
No. of MS
Panchromatic
Thermal
bands (nominal
resolution
Bands
resolution)
(nominal) (m)
(Resolution)
-
-
Altitude
(Km)
Landsat 1
MSS/RBV
1972
4 [80 m]
920
Landsat 2
MSS/RBV
1975
4 [80 m]
920
Landsat 3
MSS/RBV
1978
4 [80 m]
920
Landsat 4
MSS/TM
1982
6 [30 m]
-
1 [120m]
705
Landsat 5
MSS/TM
1984
6 [30 m]
-
1 [120m]
705
Landsat 6
ETM+
1993
-
-
-
-
Landsat 7
ETM+
1999
6 [30m]
1 [15m]
1 [60m]
705
Landsat 8
OLI/TIRS
2013
8 [30m]
1 [15m]
2 [100m]
705
Sources: Markham et al. (2012); Markham and Helder (2012).
Landsat data became free of charge in December 2008 when the USGS opened its data
archive to the world. Thus, all Landsat data can now be downloaded from a number of online
data repositories hosted by the USGS. These include: GLOVIS, REVERB and Earth Explorer.
A user must register before requesting and downloading data.
Landsat images have been used in a wide range of fields including agriculture,
geology, forestry, regional planning, education, mapping, global change research, emergency
response and disaster relief. The use of Landsat images permits very large (and inaccessible)
areas to be easily analyzed. Its spatial and temporal resolution is a limitation in certain areas
or applications.
About Landsat 5 Thematic mapper (TM)
The Landsat Thematic Mapper (TM) sensor was carried onboard Landsat 5 from July
1982 to May 2012 with a 16-day repeat cycler, reference to the Worldwide Reference System
2. Very few images were acquired from November 2011 to May 2012. The satellite began
decommissioning activities in January 2013.
Landsat 5 TM image data files consist of seven spectral bands (Table 2.5). The
resolution is 30 meters for bands 1-7. Thermal infrared band 6 was collected at 120 meters,
but was resampled to 30 meters. The approximate scene size is 170 km North-South by 183
km East-West (106 mi by 14 mi). (Chander, Markham, Barsi., 2007).
10
Most Landsat 5 TM scenes are processed through the Level 1 Product Generation
System (LPGS), processed to full precision terrain correction. Some TM scenes do not have
the ground-control or elevation data necessary to perform these corrections.
Landsat 5 Thematic Mapper scenes held in the USGS archive can be searched using
EarthExplorer, the USGS Global Visualization Viewer or the Landsat look viewer. On
Google Earth, Landsat 4-5 scenes can be found under the landsat menu in the “Landsat
Collection 1 Level 1” section, in the “Landsat 4-5 TM C1 Level 1” dataset.
Table 2.5. Landsat 5 Thematic mapper (TM).
Band
Wavelength (micrometer)
Resolution (meter)
Band 1 - blue
0.45-0.52
30
Band 2 - green
0.52-0.60
30
Band 3 - red
0.63-0.69
30
Band 4 - Near Infrared
0.77-0.90
30
Band 5 - Short-wave Infrared
1.55-1.75
30
10.40-12.50
60 * (30)
2.09-2.35
30
Band 6 - Thermal Infrared
Band 7 - Short-wave Infrared
Source: Barsi, Kvaran, Markham & Pedelty (2014).
About Landsat 8
The 40 + year Landsat record was continued with the successful February 11th 2013
launch of Landsat 8 from Vandenburg Air Force Base, California. This new Landsat
observatory was developed through an interagency partnership between the National
Aeronautics and Space Administration (NASA) and the Department of the Interior U.S.
Geological Survey (USGS) (Irons & Loveland, 2013). Landsat 8 carries two sensors, the
Operational Land Imager (OLI) and the Thermal Infrared Sensor (TIRS), and over 500 image
scenes per day are ingested into the U.S. Landsat data archive at the USGS Earth Resource
Observation and Science (EROS) Center, South Dakota. The new Landsat 8 scenes
complement the now more than four million scenes acquired by previous Landsat missions
that are stored in the U.S. Landsat archive and are freely available via the internet
(Woodcock et al, 2008).
The satellite collects images of the Earth with a 16-day repeat cycle, referenced to the
Worldwide Reference System 2. The spectral bands of the OLI sensor, while similar to
Landsat 7’s ETM+ sensor, provide enhancement from prior Landsat instruments, with the
addition of two new spectral bands: a deep blue visible channel (band 1) specifically designed
11
for water resources and coastal zone investigation, and a new infrared channel (band 9) for the
detection of cirrus clouds. Two thermal bands (TIRS) capture data with a minimum of 100
meters resolutions, but are registered to and delivered with the 30-meter OLI data product
(Table 2.6).
Table 2.6. Land Image (OLI) and Thermal Infrared Sensor (TIRS).
Band
Wavelength (micrometer)
Resolution (meter)
Band 1 - coastal aerosol
0.43-0.45
30
Band 2 - blue
0.45-0.51
30
Band 3 - green
0.53-0.59
30
Band 4 - red
0.64-0.67
Band 5 - Near Infrared (NIR)
0.85-0.88
30
Band 6 - Short-wave Infrared
1.57-1.65
30
2.11-2.29
30
Band 8 - Panchromatic
0.50-0.68
15
Band 9 - Cirrus
1.36-1.38
30
Band 10 - TIRS 1
10.60-11.19
100* (30)
Band 11 - TIRS 2
11.50-12.51
100* (30)
(SWIR) 1
Band 7 - Short-wave Infrared
(SWIR) 2
Source: Barsi et al., 2014.
2.2. Remote sensing application for mangrove monitoring
Monitoring the health of mangrove forests is crucial for sustainability and
conservation issues. Depletion of key species such as mangrove in environmentally sensitive
coastline areas, or disappearance of a large biota acting as a CO2 reservoir all affect humans
and society in a negative way, and more effort is being made to monitor and enforce
regulations and plans to protect these areas. International and domestic forestry applications
where remote sensing can be utilized included sustainable development, biodiversity, land
12
title and tenure (cadastre), monitoring deforestation, reforestation monitoring and managing,
commercial logging operations, shoreline and watershed protection, biophysical monitoring
(wildlife habitat assessment), and other environmental concerns.
General forest cover information is valuable to developing countries with limited
previous knowledge of their forestry resources. General cover type mapping, shoreline and
watershed mapping and monitoring for protection, monitoring of cutting practices and
regeneration, and forest fire/burn mapping are global needs which are currently being
addressed by countries all over the world. Forestry applications of remote sensing include: (1)
Reconnaissance mapping: include forest cover updating, depletion monitoring, and measuring
biophysical properties of forest stands, (2) Commercial forestry: collecting harvest
information, updating of inventory information for timber supply, broad forest type,
vegetation density, and biomass measurements, (3) Environmental monitoring: monitoring
deforestation (rainforest, mangrove colonies), species inventory, watershed protection
(riparian strips), coastal protection (mangrove forests).
2.2.1. In the world
Mangrove forest is considered as an extremely important resource, both ecologically
and economically (Odum, 1971; Kathiresan and Bingham, 2001). Mangrove belong to the
most threatened and vulnerable ecosystems worldwide and experienced a dramatic decline
(Valiela, 2001). One of the greatest limitations to their protection is the lack of proper
inventory and monitoring. Traditional techniques of in situ field measurements of these
forested wetlands are extremely tedious and labour intensive given the typical inaccessibility
of these systems, as well as limited mobility resulting from the maze of roots and stems, thick
and unconsolidated substrate, and tidal flooding (Kovacs et al., 2008). Consequently, there
has been a recent interest in the use of remotely sensed imagery, which can be acquired
periodically and over very large geographical areas, for mapping and monitoring these
often vast and remote wetlands (Green et al., 1998). The increasing use of remote sensing
techniques in mangrove forest mapping is possible because of the high reflectance values
from forested areas in the near-infrared, moderate reflectance in the middle infrared and low
reflectance in the red spectral regions (Trisurat et, 2000). Remote sensing is the tool of choice
to provide spatio-temporal information on mangrove ecosystem distribution, species
differentiation, health status and ongoing changes of mangrove populations (Achbacher,
1995; Manson, 2001; Green, 1996). Remote-sensing techniques have demonstrated a high
potential to detect, identify map and monitor mangrove conditions and changed, which is
reflected by the large number of scientific papers published.
13
L Wang., 2019 provide detailed descriptions of the evolution for each decade, namely
before 1989, 1990-1999, 2000-2009, 2010-2018. The history of mapping mangrove extent
with Remote Sensing data can be traced back to 1970s. Most of the mangrove extent mapping
works before 1989 with Remote Sensing data were conducted without accuracy assessment
(Everitt and Judd, 1989; Lewis and MacDonald, 1972; Lorenzo et al., 1979). Subsequently,
two studies of mapping mangrove extent were conducted with accuracy assessment using
Landsat TM, SPOT XS or airborne images during 1990–2000 (Gao, 1999; Green et al., 1998).
Then, with the accumulation of RS data over the few past decades, some studies about
mangrove forest temporal change detections were conducted during 2000–2010 (Fromard et
al., 2004; Kovacs et al., 2001). Afterwards, Spalding et al. (2010) provided the first truly
global assessment of the state of the world's mangroves. Then, several studies of mapping
mangrove extent at large scale were following by using medium-low spatial resolution RS
images after 2000 (Giri et al., 2015; Giri et al., 2011b; Jia et al., 2014). In 2017, Chen et al.
(2017b) mapped the spatial extent of China's mangroves. The advantage of this study is that
they developed a phenology-based algorithm to identify mangrove forests by analyzing a
large volume of satellite images using Google Earth Engine (GEE), a cloud-computing
platform. Approximately 435 studies on mapping mangrove extent have been published to
date (Fig. 2). Giri et al. (2011a) mapped the status and distributions of global mangroves
using available Landsat data which leading the number of citations sharply increased. All
publications can be grouped into two categories. Before 2011, most of the studies focused on
mapping mangrove forest extent by exploring different types of RS data (Green et al., 1998;
Kovacs et al., 2001). After 2011, studies aiming to map mangrove extent at large scales has
drawn more attention (Chen et al., 2017a; Giri et al., 2011a).
2.2.2. In Vietnam
Remote sensing has been used in Vietnam since 1980, and at first was used in
topographic map making and other specific map types like land-use of administrative maps.
From 1994 to 2002, remote sensing was applied on a broader scale, providing remote sensing
images for research units, institutes, universities, ministries and localities. During this period,
Viet Nam was able to make maps that showed the movements of riverbeds, ports and
coastlines; maps of wetlands or fisheries.
From 2003 to 2012, remote sensing technologies served more fields, including land
management, environment management, forestry and hydrometeorology. Besides, the data
received at the centre was used by many ministries and sectors, including agriculture and rural
development, public security, defence, search and rescue, research institutes and universities.
14
Some key studies that have been undertaken after the year 2010 on a variety of remote
sensing applications for monitoring mangrove forests, highlighting the limitations of current
studies and future directions for the use of remote sensing techniques combined with state-ofthe-art machine learning algorithms. In Vietnam, Cuc (2004) used GIS for estimating planting
suitable areas for each mangrove species. However, few studies have applied the satellite data
for monitoring mangrove forest. Satellite data can be used for large areas as well as through
time and thus represent an indispensable tool for mangrove forest monitoring, as coastal
wetlands distribute over extended and inaccessible area.
Nguyen Viet Luong (2011) studies mangrove forest structure and coverage change
analysis using remote sensing and geographical information system technology in Can Gio
mangrove biosphere reserve. In this study, the effectiveness of satellite data for classifying
and mapping of mangrove forest is reported as an example of their application for mangrove
management.
Tien Dat Pham et al (2011) was also involved in topic research monitoring mangrove
forest by using multi-temporal satellite data in the Northern coast of Vietnam. As a result
shows that Geographic Information System (GIS) and Remote Sensing data were applied for
analyzing how the mangrove changes throughout the different periods 1990 -2006. From that,
the research provided appropriate solution for mitigation and adaptation to climate change
through improved management of mangroves along the coast of Vietnam. Therefore, remote
sensing application is really necessary for mangrove management, conservation and
development in Vietnam coast area.
From 2013 to the present, remote sensing has been used in natural resources and
environment observation and climate change adaptation. Dahanayaka et al (2013) conducted
the research “Monitoring mangrove distribution and changes in Mekong Delta, Vietnam using
remote sensing approach”. The objective was to test the feasibility of using the Landsat
ETM+ digital image for monitoring mangrove distribution and changes in Mekong delta. The
research showed that information from satellite remote sensing can play a useful role in
determining the changes in mangrove area in Mekong Delta.
Tien Dat Pham (2019) continued to approach remote sensing to monitoring mangrove
species, structure, and Biomass and shown some advantages and challenges when using
remote sensing. Medium to low spatial resolution data, i.e., Landsat 5 TM, Landsat 7 ETM+,
and Landsat 8 OLI with 30-m spatial resolution contain many mixed pixels that have
information for different tree species in a single pixel. Thus, medium spatial resolution data
15
may have difficulties in classifying mangrove species due to the complexity of mangrove
communities.
2.2.3. In Phu Long and Gia Luan communes.
In general, Remote Sensing and GIS technology offers considerable advantages in
mangrove studies and has become a useful tool to monitor the change of mangrove
ecosystems. Monitoring mangrove forest changes plays an important role for effective
mangrove conservation and management (Dat, 2017). However, few studies have used
Remote Sensing data to analyze mangrove forest change in different periods in Hai Phong,
especially on Phu Long – Gia Luan, Cat Hai. Satellite data is limited and there is a lack of
available data.
Thinh A.N., 2008 studied Landscape ecological planning based on change analysis: A
case study of mangrove restoration in Phu Long- Gia Luan area, Cat Ba archipelago. The
study has been conducted Mangrove change map in Phu Long – Gia Luan area for the period
of 1994-2006 by using Remote sensing satellite data (SPOT3 in 1994 and SPOT5 in 2006)
and GIS method (Supervised Classification).
Tien Dat Pham et al did a numerous research about mangroves in Hai Phong city with
different remote sensing data. In 2015, he studied mangroves mapping and change detection
using Multi-temporal Landsat imagery in Hai Phong city, Vietnam. The objectives of this
research were to map the locations of mangrove and to analyze their change in Hai Phong,
Vietnam from 1989 to 2013 using different Landsat sensors including TM, ETM+ and OLI.
This research indicates the potential for use of multi-temporal LANDSAT data together with
image segmentation and a GIS approach for mapping man grove forest in the coastal zone.
Dat T.P et al, 2017 studied monitoring mangrove forest changes in Cat Ba biosphere
reserve using ALOS PALSAR imagery and GIS-based support vector machine algorithm. The
objectives of this study were to map the spatial distribution of mangrove forest and to assess
their changes between 2010 and 2015 in Cat Ba Biosphere Reserve, Hai Phong city of
Vietnam. This research shows the potential use of ALOS PALSAR data combined with
machine learning techniques in monitoring mangrove forest changes in tropical and semitropical climates.
In general, remote sensing offers opportunities for mapping the biophysical and structural
parameters and monitoring changing of mangrove forest with lower coast, faster speed, and at
a wider scale than field measurements. However, research on mangrove forest using satellite
data in Vietnam is limited, especially in Cat Ba Archipelago Biosphere Reserve, Hai Phong.
16
CHAPTER III
STUDY GOALS, OBJECTIVE AND METHODOLOGY
3.1. GOAL
The aim of the study is to monitoring change in mangrove forest extents in Phu Long
and Gia Luan communes, Cat Hai, Hai Phong coast Vietnam during 2010-2019 for better
management of coastal mangroves through using multi-temporal remote sensing data.
3.2. OBJECTIVES
Objective 1: Investigate the status of mangrove forests and management scheme in
Phu Long and Gia Luan communes, Cat Hai district, Hai Phong province.
Objective 2: Quantify changes in mangrove forest extents in Phu Long and Gia Luan
communes, Cat Hai, Hai Phong coast during 2010- 2019 and drives of change.
Objective 3: Estimate soil organic carbon of mangrove from field- based plot survey
and Inverse distance weighted (IDW)- based interpolation approach in study site.
Objective 4: Propose solutions to better manage mangrove forests in Phu Long and
Gia Luan commune, Cat Hai district, Hai Phong coast, Vietnam.
3.3. METHODOLOGY
3.3.1. Study site
Temporal scope: The research used Landsat imageries with a 30m spatial resolution
spanning 10 years from 2010 to May, 2019.
Spatial scale: Study site has been conducted in Phu Long and Gia Luan communes, which
have the largest mangrove area in the Cat Ba Archipelago Biosphere Reserve, Hai Phong,
Viet Nam.
17