Evaluating policy effectiveness on coastal mangrove management case study in dai hop and bang la communes hai phong city
Bạn đang xem bản rút gọn của tài liệu. Xem và tải ngay bản đầy đủ của tài liệu tại đây (11.18 MB, 78 trang )
MINISTRY OF AGRICULTURE AND RURAL DEVELOPMENT
VIETNAM NATIONAL UNIVERSITY OF FORESTRY
STUDENT THESIS
Title
EVALUATING POLICY EFFECTIVENESS ON COASTAL
MANGROVE MANAGEMENT: CASE STUDY IN DAI HOP
AND BANG LA COMMUNES, HAI PHONG CITY
Major: Natural Resources Management
Code: D850101
Faculty: Forest Resources and Environmental Management
Student:
Nguyen Nguyet Anh
Class: K57 Natural Resources Management
Student ID: 1253090003
Course: 2012 - 2016
Advanced Education Program
Developed in collaboration with Colorado State University, USA
Supervisor: Dr. Hai-Hoa Nguyen
Hanoi, 2016
Abstract
Vietnam suffers from seven to twelve tropical storms every year. Hence, not only lives
but also properties are lost in coastal areas. Besides, in recent decades, climate change has
become an urgent issue for human being. Mangroves have been recognized as one of the most
optimal solutions to deal with those issues in coastal regions of Vietnam. Therefore,
mangrove management and protection have created a pressing need for forest managers to
figure out the best way to assess the effectiveness of management policies for planning.
This study aims to (1) investigate relevant policies in study site from 1990 to 2016 (2)
assess the effectiveness of policies on coastal mangrove management using three major
indicators and (3) to propose feasible solutions to enhance the policies in this area. Three
remarkable policy-periods have been investigated and assessed by using a set of three
significant indicators, including ecological, economic and social indicators. From 1900 –
1997, mangrove rehabilitation and restoration projects had been implemented, but they were
not effective. From 1997 – 2005, the implementation of many policies and projects had
improved the quantity and quality of mangroves. Hence, the increase of mangrove extent
considerably contributed to local incomes and livelihoods improvement. The period from
2005 to 2016 has been known as mangrove development and protection stage. This study also
suggests that the communes should adopt community – based management (CBM) to enhance
the mangrove quantity and quality in the long term.
2
Acknowledgements
First and foremost, I was extremely fortunate to be supervised and supported by Dr.
Hai-Hoa Nguyen. He has inspired me very much on my way to achieving my goals during the
time as his student. Besides, he provided me with insight into how mangrove management
plays an indispensable role in coastal zones, adding a novel dimension to my thesis. I would
also like to thank Dr. Lee Macdonald who suggested valuable comments about my thesis
proposal in the preparation time. I sincerely thank teachers in Faculty of Forest Resources and
Environmental Management for the encouragements and suggestions and for helping me to
improve the quality of my thesis.
In addition, thank you to Doan Thi Minh Thuy and Vu Duc Huy for helping me to
collect data in Hai Phong during our initial research project, which I based on to develop and
build up ideas for this thesis. I also would like to express my deep appreciation to the staffs
and local people in Dai Hop (Kien Thuy) and Bang La (Do Son) communes for the
enthusiastic help during our work. Due to the limited knowledge, time and experience, this
thesis is still need to be improved. I am looking forward to receiving feedbacks from teachers
and friends to enhance it.
Hanoi, 2016
3
Dedication
To my family.
4
Table of Contents
Abstract ............................................................................................................................... 2
Acknowledgements ............................................................................................................. 3
List of acronyms abbreviations .......................................................................................... 7
List of figures ...................................................................................................................... 8
List of tables ........................................................................................................................ 9
Chapter 1 Introduction ..................................................................................................... 10
Chapter 2 Study Goals and Objectives ............................................................................ 14
2.1. Study goal and objectives .......................................................................................... 14
2.1.1. Goal .................................................................................................................... 14
2.1.2. Specific objectives .............................................................................................. 14
2.2. Research question and hypothesis .............................................................................. 14
2.2.1. Research question................................................................................................ 14
2.2.2. Hypothesis .......................................................................................................... 15
Chapter 3 Study Site and Research Methodology ........................................................... 16
3.1. Study site ................................................................................................................... 16
3.1.1. Geographical location and topography................................................................. 16
3.1.2. Climate ............................................................................................................... 17
3.1.3. Natural resources................................................................................................. 17
3.1.4. Population ........................................................................................................... 17
3.1.5. Economy ............................................................................................................. 18
3.2. Research methodology............................................................................................... 18
Rationale: ......................................................................................................................... 18
3.2.1. Literature review and secondary data................................................................... 19
3.2.2.Landsat Images classification and processing ....................................................... 20
3.2.3.Structured interview and Semi-structure interview ............................................... 24
3.2.4. Data analysis ...................................................................................................... 25
Chapter 4: Results............................................................................................................. 26
4.1. Policies and projects on coastal mangrove management ............................................. 26
4.1.1. Policies related to coastal mangrove management from 1990 to 1997 .................. 27
4.1.2. Policies related to coastal mangrove management from 1997 to 2005 .................. 28
4.1.3. Policies-related to coastal mangrove management from 2005 – 2016................... 31
4.2. Effectiveness of mangrove management policies ....................................................... 32
4.2.1. Ecological indicator: Coastal mangrove extents before and after policies ............. 32
4.2.2. Economic indicator: Changes in local livelihood after applying policies .............. 38
5
4.2.3. Social indicator: .................................................................................................. 42
4.3. Solutions for better management of mangroves .......................................................... 45
4.3.1. Model of sustainable management and development of mangroves. .................... 45
4.3.2. Other solutions for sustainable development of mangroves .................................. 48
Chapter 5 Discussion ........................................................................................................ 50
5.1. Effectiveness of coastal mangrove management in study area based on three significant
indicators.......................................................................................................................... 50
5.1.1. Period from 1990 to 1997 : A beginning of mangrove management polices ......... 51
5.1.2. Period from 1997 to 2005: Recovery and transition period of mangrove
management polices ...................................................................................................... 52
5.1.3.Period from 2005 to 2016: Development and prescription period of mangrove
management policies ..................................................................................................... 53
5.2. Limitation and further study....................................................................................... 55
Chapter 6 Conclusion ....................................................................................................... 56
Chapter 7 References ........................................................................................................ 58
Chapter 8 Appendices ....................................................................................................... 62
6
List of acronyms abbreviations
GIS
Geographic Information System
NGO
Non - Government Organization
MONRE
Ministry of Natural Resources and Environment
MARD
Ministry of Agriculture and Rural Development
SMM
Sustainable Mangrove Management
NDVI
Normalized Difference Vegetation Index
PAM
Programme Alimentaire Mondial (French)
(WFP)
World Food Program
JRC
Japanese Red Cross
GPS
Global Positioning System
VND
Vietnamese Dong
USD
United States Dollar
CBM
Community-Based Management
GIZ
(Germany)
Gesellsschaft für Internationale Zusammenarbeit
MFF
Mangrove For the Future
7
List of figures
Figure 3.1.: Study Site......................................................................................................... 16
Figure 3.2: Flowchart of Landsat images classification and processing................................ 23
Figure 4.1: Era of Natural Resources policy in Vietnam ...................................................... 26
Figure. 4.2: Provincial institutional structure for coastal mangrove management in Dai Hop
and Bang La communes. ..................................................................................................... 27
Figure 4.3: Thematic maps of coastal mangrove extents in Dai Hop and Bang La communes
in different years using Landsat images ............................................................................... 33
Figure 4.4: Mangroves extent in 1990, 1997, 2005 and 2016 ............................................... 34
Figure 4.5: Changes in coastal mangroves in Dai Hop and Bang La communes from 1990 to
2014.................................................................................................................................... 37
Figure 4.7: Production of fishery during three periods ......................................................... 39
Figure 4.8: Local satisfaction about mangrove management policies ................................... 43
Figure 4.9: Power versus interest grid (adapted from Eden & Ackermann, 1998) ................ 47
8
List of tables
Table 3.1: Landsat data used in the study ............................................................................ 20
Table 3.2. Data layers to construct dynamic maps of mangroves ......................................... 22
Table 4.1: Major features of mangrove management policies before 1997. .......................... 28
Table 4.2: Projects in the period of 1997 - 2005 in study site (MARD, 2006) ...................... 29
Table 4.3: Implementation process of management policies in Dai Hop and Bang La.......... 30
Table 4.4: Major features of mangrove management in Dai Hop and Bang La .................... 32
from 2005 to 2016............................................................................................................... 32
Table 4.5: Mangroves extent in 1990, 1997, 2005 and 2016 ................................................ 34
Table 4.6: Dynamics of mangrove extent in three different periods ..................................... 34
Table 4.7: Accuracy assessment of unsupervised classification method in 1990 .................. 35
Table 4.8: Accuracy assessment of unsupervised classification method in 1997 .................. 35
Table 4.9: Accuracy assessment of unsupervised classification method in 2005 .................. 35
Table 4.10: Accuracy assessment of unsupervised classification method in 2016 ................ 36
Table 4.11: Land Use Land Cover (LULC) changes in study site during three periods ........ 38
Table 4.12: Sources of incomes in Dai Hop and Bang La .................................................... 39
Table 4.13: Average income from seafood products of mangroves ...................................... 42
Table 4.14: Social satisfaction of local people about mangrove management policies.......... 43
Table 4.15: Households‘ participation in mangrove management policies ........................... 44
Table 4.16: Social participation in mangrove management projects ..................................... 45
Table 5.1: Policies effectiveness assessment based on three significant indicators ............... 50
9
Chapter 1: Introduction
Mangrove forest ecosystems occupy a narrow ecotone between marine and
terrestrial environments, but a broad latitudinal range between 25 oN and 30oS (Lugo and
Snedaker, 1974). Across Southeast Asia, human activities have caused rapid mangrove
system degradation and loss. In Vietnam, a country undergoing economic transition,
mangrove systems are vital to the livelihoods of coastal rural communities (Orchard,
Stringer and Quinn, 2016). It provides an important ecosystem service of safeguarding
human societies from natural disasters along tropical coastal zones (Sanford, 2009).
Mangroves serve as a buffer between land and sea and hence are protection against
erosion and even reduce the hazards of tsunamis and cyclones. They harbor a variety of
life forms like fish, amphibians, reptiles, birds and are good source of timber, fuel,
fodder, tannins, honey, etc. Despite their importance, mangroves are constantly under
threat worldwide. They are being sacrificed for civic facilities like house building, roads
and hotels and are often additionally subjected to pollution and disruption of their
sensitive water and salt balance (Faridah-Hanum et al., 2014).
Management of mangroves in a sustainable ecological as well as economic way is a
difficult proposition and needs multi-disciplinary intervention (Datta, Guha and
Chattopadhyay, 2010). The concept of sustainable mangrove management has therefore
become imperative to develop and establish broad guidelines which will help to achieve
multiple objectives of management and utilization of forest products without any
undesirable effect on the physical and social environment.
In Vietnam, policies on mangrove management in Vietnam still need to be revised
in which better coordination of coastal mangrove management and development at the
different levels should be strengthened. The process of developing a broadly integrated
management effort will need to incorporate a richer set of performance measures.
Institutional evaluation, an understanding community dynamics, and policy assessment
10
all play a central role (Bowen and Riley, 2003). An integrated wetland research
framework suggests that a combination of economic valuation, integrated modeling,
stakeholder analysis, and multi-criteria evaluation can provide complementary insights
into sustainable and welfare-optimizing wetland management and policy (Turner et al.,
2000). Although the importance of assessing policies and their effectiveness on
sustainable mangrove management is well recognized, accurate and reliable assessment
process is unanswered, including Hai Phong in general and Dai Hop and Bang La
communes in particular.
Hai Phong is a coastal city with a total of 125 km of seacoast. Coastal mangroves
not only reduce consequences from natural disaster but also bring huge economic benefit
for local people. Mangroves conservation and management has been implemented in the
city. However, the assessment of policies effectiveness is still rare in Vietnam also in Hai
Phong City.
Hai Phong is located on the North coast of Vietnam, where the mangroves are
classified as zone I and II among four mangrove zones in Vietnam. This city lies within
the tropical monsoons belt of Asia (Dat and Yoshino, 2013). With a sea coast length of
125 km this city is vulnerable to rising sea level and storms associated with climate
change. Mangroves play an important role in support for coastal dykes and reduce
consequence from natural disasters. Mangroves in Hai Phong are distributed in seven
districts: Thuy Nguyen, Kien Thuy, Tien Lang, Cat Hai, Do Son, Duong Kinh, and Hai
An.
Since 1992, there have been some mangrove plantation programs supported by both
international funding agencies and the government of Vietnam. For instance, PAM 5325,
327 Program are national afforestation programs related to mangrove plantation. Projects
in study site were funded by the Japanese Red Cross (JRC) and associate with Hai Phong
Red Cross. An efficient co-operate between city and government organizations, city and
11
non-government organizations, city and local people, as well as by efficiently using the
funds, these programs had some successes.
The livelihood of local people are gradually improving. Not only could the damage
from natural disaster be reduced but also their income have increased through the
foraging of product from the mangroves. Raising in local people awareness about
importance of mangrove is crucial for coastal environmental management toward
sustainability.
Policy effectiveness evaluation helps to raise important question about
environmental policies: Are they working? Are they cost – effective? If not, how can they
be improved? (European Environment Agency, Policy effectiveness evaluation).
Effectiveness evaluation also provides an important feedback mechanism in the policy
cycle which would be the useful guideline for policy – makers. However, there is limited
information available on how to assess the effectiveness of mangroves management
policies in developing countries, especially in coastal regions of Vietnam. In recent years,
there has been a significant increase in scientific and volunteer surveys (Adeel and
Pomeroy, 2002). Yet, this information usually focus separately on ecological, social or
livelihood aspects and the application of criteria or set of indicators to assess policies
effectiveness is rare. Meanwhile, a management policy meet ecological, social and
economic aspects which can considered as an effective policy in a sustainable way.
(Datta et al., 2010) highlights the importance of criteria and indicators to evaluate the
status of performance of communities in managing their mangroves sustainably. The
importance of the information available on the status and threats to mangroves in
developing country using geographic information system (GIS) had been focused by
(Adeel and Pomeroy, 2002).
There have been a lot of studies about mangroves conducted in coastal districts of
Hai Phong city, such as: Effectiveness of aquaculture to dynamics of coastal mangrove in
12
Thai Binh River valley in Tien Lang district, Hai Phong of Nguyen Huy Thang (1996);
Effectiveness of shrimp farm expansion to mangrove in Giao Thuy, Nam Dinh during the
period 1986 – 2001 of Martin Boojand, Ferdinamd Bonn and Pham Van Cu, especially is
comparing mangrove forest management in Hai Phong City, Vietnam towards sustainable
aquaculture (Dat and Yoshino, 2013).
The scientific assessment of sustainability in natural resource management is an
interdisciplinary task and it is generally agreed that sustainability assessments require
environmental, economic and social criteria (Glaser and Diele, 2004). Some recent
proposals for the assessment of marine fisheries also integrate ecological, economic and
social assessment criteria, but few integrated, indicator-based assessments of the
sustainability of coastal fisheries have been implemented to date.
For those reasons, I come up with my research of evaluating policy effectiveness
on coastal mangrove management: case study in Kien Thuy and Do Son districts,
Hai Phong city in order to initially build up a set of indicators for policies effectiveness
assessment to apply on coastal mangrove management in Vietnam.
13
Chapter 2: Study Goals and Objectives
2.1. Study goal and objectives
2.1.1. Goal
This research aims to assess the effectiveness of policies on coastal mangrove
management using three main indicators in study area and propose possible solutions to
enhance the mangrove management in study site.
2.1.2. Specific objectives
Objective 1: To investigate relevant policies and projects on coastal mangrove
management in Dai Hop and Bang La communes, Hai Phong city.
Objective 2: To assess the effectiveness of mangrove management policies using three
main indicators
●
Ecological indicator: dynamics of coastal mangroves during three significant
period of policies applied;
●
Economic indicator: improvements of local livelihoods before and after
policies applied in study areas;
●
Social indicator: social satisfaction and local participation.
Objective 3: To propose the solutions to enhance management of coastal mangroves.
2.2. Research questions and hypothesis
2.2.1. Research questions
(1) What are relevant policies and projects on coastal mangrove management in Dai Hop and
Bang La communes, Hai Phong city?
(2) Do policies and projects on coastal mangrove management meet three significant
indicators of policies effectiveness?
(3) How to enhance the policies effectiveness on coastal mangrove management?
14
2.2.2. Hypothesis
Policies in study site have been implemented effectively to enhance management of coastal
mangroves over last 26 years.
15
Chapter 3: Study Site and Research Methodology
3.1. Study site
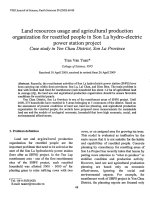
Study site belongs to two districts, including Kien Thuy and Do Son. Specifically, it
only belongs inside frontier of two communes. They are Dai Hop (Kien Thuy) and Bang La
(Do Son). Fig. 3.1 shows the location of study site.
Fig. 3.1: Study Site: (a) Vietnam (b) Hai Phong city (c) Kien Thuy and Do Son districts
and the distribution of mangroves in study site.
3.1.1. Geographical location and topography
a) Geographical location
Bang La commune (20°42‘42‘‘N, 106°44‘43‘‘E) has 966.73 hectares of natural area.
Contiguous zones includeEast: Ngoc Xuyen and Van Huong communes; West: Kien Thuy
district; South: Gulf of Tonkin; North: Minh Duc commune and Kien Thuy district.
Dai Hop commune (20°41′45″N, 106°42′51″E) has 1097.79 hectares of natural area with 4.2
km in length of coastline. Contiguous zones include:
16
East: Bang La commune; West: Doan Xa commune; South: Van Uc seaport ; North: Tu Son
commune.
Dai Hop commune includes four villages: Dai Loc, Quan Muc, Dong Tac and Viet Tien.
b) Topography
Study area is far from city center. Topography is not flat, separated by river, encompassed by
sea and along the northwest - southeast. The soil has high acidity and salinity.
3.1.2. Climate
Hai Phong features subtropical climate. Precipitation depends on seasons and
monsoon. Rainy season starts from May to October, summer wind is cool and makes rain.
Dry season starts from November to April, winter wind is cold and dry. Average temperature
in summer is approximately 32.5°C, in winter is approximately 20.3°C. Annual average
temperature is greater than 23.9°C. Average precipitation is about 1600-1800 mm.. Dai Hop
and Bang La are threatened by one to two storms per year, offered from June to September.
3.1.3. Natural resources
Dai Hop and Bang La are located along the coast so it contains mainly alkaline soil,
saline soil, sediment, feralit.
Forest resource: Dai Hop and Bang La have more than 500 ha of mangroves which
stretches along seven kilometer of sea dyke and more than one kilometer from the shore
toward the sea.
3.1.4. Population
According to statistical data, population in Dai Hop (Kien Thuy) is 9491, 2675
households. Average population density was greater than 865 people/km2. Number of
households who are farmers, fishermen account for 69.5% and 8.1% respectively. Number of
people in working age account for 46%, population size. Dai Hop is one of communes in Kien
17
Thuy. Population in Bang La commune is 8765, average population density was 1339
people/km2.
3.1.5. Economy
In Dai Hop, economic components mainly focus on aquaculture and aquatic products
exploitation. In 2008, aquatic product exploitation was 43.5%, aquaculture accounted for
30.5% and small scale industry and services was 26%. Dai Hop is in process of developing
economy towards promoting potential advantages for catching fish.
In Bang La, local administration determines to develop economy towards
interdisciplinary and focused on aquatic products exploitation. In particular, the adjustment of
economic structure narrowed the traditional salt-making area for low-income and moved
toward higher proportion of animal husbandry, horticulture and business services. Many
welfare projects such as roads, lighting, schools, clinics, markets, irrigation system have been
repaired, new construction next to hundreds of multi-storied villas of people has grown up.
3.2. Research methodology
Rationale:
Policy effectiveness:
In this study, policy effectiveness is evaluated using three main indicators. Therefore,
a policy is considered as the effectiveness as it could meet these indicators.
Policy effectiveness indicators:
Ecological indicator
Ecological indicator in this study is considered as the extent of mangroves in three
different periods of time from 1990 to 2016. (Seto and Fragkias, 2007) presented satellite
imagery as a powerful tool to assess land cover conditions before and after designation of
Ramsar Convention in Vietnam. Mangroves extent is used to be one of three indicators to
assess policies effectiveness. This method is also adapted from (Harty and Cheng, 2003).
18
Economic indicator
Economic indicator in this study is considered as the improvement of local livelihood.
A livelihood is a means of making a living. It encompasses people‘s capabilities, assets,
income and activities required to secure the necessities of life (Aheto et al., 2016). A
livelihood is sustainable when it enables people to cope with and recover from shocks and
stresses, such as natural disasters and economic or social upheavals, and enhance their wellbeing and that of future generations without undermining the natural environment or resource
base (International Federation of Red Cross and Red Crescent Societies).
Social indicator
Social indicator in this study includes two main aspects:
Local empowerment: Local communities being supported to do things for themselves –
community empowerment (Aminu Liman and Ibrahim Ngah, 2015). People have their
voices heard in the planning and delivery of services – community engagement and
participation.
Local satisfaction: local communities has their own point of views about how were
policies and projects well implemented and this assessment is one of the most important
step to improve management policies in natural resources management (Brosius, Tsing
and Zerner, 1998).
3.2.1. Literature review and secondary data
Literature review is an indispensable part to deal with definitions and rationale as well
as collect the secondary data. All the documents which related to policies in study site (Since,
1990), published documents, papers of previous researches, and case studies all over the
world focusing on mangroves and study areas were reviewed. This method helps study has an
overview of the research topic. The information collected from this method including but not
limited to:
● Socio- economic conditions of study sites;
19
● Geographic Information System layers and Land Use Land Cover maps
● Technical steps of processing Landsat image;
● Data related to the dynamics of coastal mangroves;
● Relevant policies on coastal mangrove management in Dai Hop (Kien Thuy) and Bang
La (Do Son) communes.
● Social – economic reports from communes
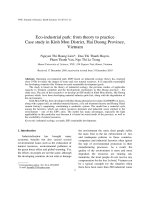
3.2.2. Landsat Images classification and processing
The multi-temporal Landsat images are used in this study to assess the dynamics of
the coastal mangrove area before and after the introduced policies (Table 3). The visual
interpretation and unsupervised classification methods are used to map the coastal mangroves
extent since 1990. In the combination with data collected in the field, the accuracy can be
assessed using ground truth method.
Table 3.1: Landsat data used in the study
Years
Landsat image code
Date
Resolution
Path/Row
1990a
LT51260461990234BKT01
22/08/1990
30 m
126/46
1997a
LT51260461997157BKT00
06/06/1997
30 m
126/46
2005a
LT51260462005099BJC00
09/04/2005
30 m
126/46
2016a
LE71260462016154EDC00
27/06/2016
30 m
126/46
1990b
Map of Mangrove Status
2000
1:50 000
2000b
Map of Mangrove Status
2008
1:50 000
2008b
Map of Mangrove Status
2010
1:50 000
Source: (a) (b) Hai Phong Institute of Oceanography
The visual interpretation and unsupervised classification methods are used to map the
coastal mangroves extent in 1990, 1997, 2005 and 2016.
20
Constructing a map of coastal mangrove extents in particular year:
Step 1: Processing Landsat images
Step 2: Constructing maps of the current state of mangroves in particular years and dynamic
maps of mangroves.
Constructing thematic maps of mangroves
This study used unsupervised classification approach. This approach was used to
classify satellite images. The result of this method was the division of Landsat images into
many groups, each group includes a set of points which have similar spectral characters.
Hence, group of mangroves as well as other groups (populated areas; water; agricultural,
industrial classes) were separated from other classes. After that, ―reclass‖ command was used
to reclass the object into two main categories: mangroves and others.
Normalized Difference Vegetation Index (NDVI) used as supporting tool in this report
to reclass layers. NDVI values could be calculated for Landsat 5 and Landsat 7 image as the
following equation:
Landsat 5/7:
(BandNir – BandRed)/(BandNir + BandRed) Or (Band 4 – Band 3)/(Band 4 + Band 3)
Images from google earth and maps of mangrove status obtained from Hai Phong
institute of oceanography were also significant documents for this research to work out final
thematic map of mangroves as well as accuracy assessment.
Constructing dynamic maps of mangroves
After using unsupervised classification, maps of the current state of mangroves in
particular years (1990, 1997, 2005 and 2016) were formed. Then, two map layers were
overlaid to get dynamic maps over periods. Following table shows the basic information of
two layers
21
Table 3.2. Data layers to construct dynamic maps of mangroves.
Years
1990
Description
Variables
Forest Coverage in Id - 0= Non-Forested,
1990
1=Forested
Source
From Landsat Images
Count - Counter Variable
1997
Forest Coverage in Id - 0= Non-Forested,
1997
1=Forested
From Landsat Images
Count - Counter Variable
2005
Forest Coverage in Id - 0= Non-Forested,
2005
1=Forested
From Landsat Images
Count - Counter Variable
2016
Forest Coverage in Id - 0= Non-Forested,
2016
1=Forested
From Landsat Images
Count - Counter Variable
Two layers were added together in ArcGIS (Arc Map). The final result is the dynamics
map of coastal mangrove in three periods: 1990 – 1997; 1997 – 2005 and 2005 - 2016 with
four main categories: No Forest; Forest Loss, Forest Gain, Stable Forest.
Accuracy assessment
In this study, the accuracy is measured to which the ground cover classes produced in
a classified image are actually found in situ.
To assess the accuracy of unsupervised classification method, research uses the same
set of ground control points which have been chosen during the process of image
classification. This data set is classified as mangrove and non-mangroves categories. Then
each point is checked and compared with the actual ground control point in the field,
identified by GPS device in 2016. For three other significant years 1990, 1997 and 2005,
research uses the image from Google earth, maps from Hai Phong institute Oceanography,
information from interviewing local people and NDVI method to support the assessment
22
process. Totally, there are 80 points were chosen in 1990, 1997, 2005 and 132 ground control
points were marked with GPS devices in the field.
Data collection
Data information
in the field
Remote
sensing
images
GIS data, statistic
data
Image processing and
analysises
Maps of the current state of mangroves
in particular years
Dynamic maps of mangroves over
some periods
Accuracy assessments
Fig.3.1: Flowchart of Landsat images classification and processing.
23
3.2.3. Structured interview and Semi-structure interview
Primary data in this study was mainly obtained from structured interview method and
the semi-structured interview is used as a support for certain types of information. Total
samples are 55 households in diverse groups of age, jobs, genders and social well-being (rich,
middle and poor families).
a) Structured interview
A designed questionnaire form (Appendix 1) was used to interview which finally records
all the following data:
●
History, and the dynamics of the mangroves along the investigated time periods; The
policies and projects about mangroves in Dai Hop (Kien Thuy) and Bang La (Do Son);
changes of livelihood through periods of time.
●
The level of participation which local people have been involved in management
activities as well as projects.
●
The responsibilities and rights of local people in mangroves management
●
Living condition in term of well-being and social conditions.
b) Semi – structured interview
Semi – structured interview is an interview in which the interviewer uses a list of
questions and topics that need to be covered during the conversation, usually in a particular
order. To collect the data, transect walk was applied in the field to interview some key people:
hamlet leader, head of commune, private secretary, and also some local people: seller,
experienced farmers, etc.
In this case, we verified information which were potential to use for social indicator
assessment such as social empowerment and social satisfaction and to contribute to figure out
optimal solutions in mangrove management in this area.
24
3.2.4. Data analysis
Data collected from interviewing local people were analyzed by Microsoft Excel.
Descriptive statistics were used for social and economic indicators assessment. Besides, raw
data after processing with Microsoft Excel, were used to draw graph to illustrate the trends
and changes of different variables in this study.
25