Degradation of toluene vapor using vacuum ultraviolet photolytic a way to reduce air pollution
Bạn đang xem bản rút gọn của tài liệu. Xem và tải ngay bản đầy đủ của tài liệu tại đây (2.05 MB, 42 trang )
THAI NGUYEN UNIVERSITY
UNIVERSITY OF AGRICULTURE AND FORESTRY
LE NGOC KHANH
DEGRADATION OF TOLUENE VAPOR USING VACUUM
ULTRAVIOLET: A WAY TO REDUCE AIR POLLUTION
BACHELOR THESIS
Study Mode: Full-time
Major:
Environmental Science and Management
Faculty:
Advanced Education Programs Office
Batch:
2014 - 2018
Thai Nguyen, 25/09/2018
ACKNOWLEDGEMENT
I would like firstly to emphasize the sincere appreciation to lecturers in the
Advance Education Program as well as lecturers in Thai Nguyen University of
Agriculture and Forestry, who have lectured me profound knowledge not only for
my subjects but also for my soft skills and gave me a chance to do my thesis abroad.
In addiction, I would like to thank all supports and help from Department of
Environmental Engineering, Falculty of Engineering, King Mongkut’s University
Technology of Thonbori for the time I conducted my research in Thailand.
It is my pleasure to work with a profound supervisor- Professor Prapat
Pongkiakul, who always helped me any time. He also gave me the best conditions,
supported all materials for my research and discussed any problems I got
whnenever I did experiments in his Environmental Engineering Laboratory.
I would like to give my special thanks to Dr. Profesor. Nguyen Hung
Quang, who always supported and cheered me up the whole time I worked oversea.
He also helps me a lot in spending much tim checking my thesis report.
Finally, I would like to express my gratitude to my family and friends, who
always beside me all the time. Their help support and encouragements created the
pump leading me to my success.
Sincerely
Khanh
Le Ngoc Khanh
i
TABLE OF CONTENT
ACKNOWLEDGEMENT ........................................................................................ i
TABLE OF CONTENT ............................................................................................. ii
LIST OF FIGURES................................................................................................... iv
LIST OF TABLES ......................................................................................................v
LIST OF ABBREVIATIONS ................................................................................... vi
DOCUMENTATION PAGE WITH ABSTRACT .................................................. vii
PART I. INTRODUCTION ............................................................................................ 1
1.1. Research rationale ................................................................................................1
1.2. Reasearch’s Objectives ........................................................................................2
1.3. Research questions and hypothesis ......................................................................2
1.4. Limitations ...........................................................................................................3
1.5. Definitions ............................................................................................................3
1.5.1. Toluene .............................................................................................................3
1.5.2. Standard of toluene ..........................................................................................5
PART II. LITERATURE REVIEW ............................................................................. 7
PART III. METHOD ...................................................................................................... 10
3.1. Materials ............................................................................................................10
3.2. Method ...............................................................................................................10
3.2.1. Experiment setup .............................................................................................10
3.2.2. Calculate flow rate of gas based on a retention time ......................................11
3.2.3. Experimental setup ..........................................................................................13
PART VI. RESULT AND DISSCUSION .................................................................. 14
4.1. Result ..................................................................................................................14
4.1.1. Reduction of outlet concentration of 200 ppm and C/Co(%) ..........................14
4.1.2. Reduction of outlet concentration of 150 ppm and C/Co(%) ..........................16
4.1.3. Reduction of outlet concentration of 100 ppm and C/Co(%) ..........................19
4.2. Disscusion ..........................................................................................................21
4.2.1. Reduction of outlet concentration ...................................................................21
4.2.1.1. Inlet concentration of 200 ppm ....................................................................21
ii
4.2.1.2. Inlet concentration of 150 ppm ....................................................................22
4.2.1.3. Inlet concentration of 100 ppm ....................................................................23
4.3. Removal efficiecy ..............................................................................................23
4.3.1. C/Co efficiency at 200 ppm inlet concentration ..............................................23
4.3.2. C/Co efficiency at 150 ppm inlet concentration .............................................24
4.3.3. C/Co efficiency at 100 ppm inlet concentration ..............................................25
4.3.4. Comparison of removal efficiency of toluene.................................................25
PART V. CONCLUSION .......................................................................................27
REFERENCE ..........................................................................................................28
PART VI. APPENDICES .......................................................................................32
iii
LIST OF FIGURES
Figure 1.1. Chemical properties of toluene .................................................................3
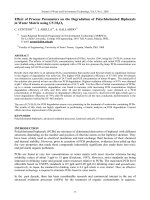
Figure 1.2. Schematic diagram of experiment setup .................................................11
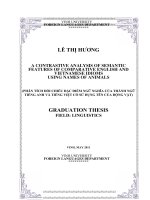
Figure 1.3. Size of reactor .........................................................................................12
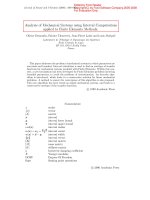
Figure 1.4. Changes of outlet toluene concentration (inlet concentration at 200 ppm)
after apply VUV radiation ..........................................................................22
Figure 1.5. Changes of outlet toluene concentration (inlet concentration at 150 ppm)
after apply VUV radiation ..........................................................................22
Figure 1.6. Changes of outlet toluene concentration (inlet concentration at 100 ppm)
after apply VUV radiation ..........................................................................23
Figure 1.7. Changes of removal efficiency at the inlet concentration of 200 ppm ...24
Figure 1.8. Changes of removal efficiency at the inlet concentration of 150 ppm ...24
Figure 1.9. Changes of removal efficiency at the inlet concentration of 100 ppm ...25
Figure 1.10. Comparison of toluene removal efficiency for the inlet concentrations
of 100, 150, and 200 ppm ...........................................................................26
iv
LIST OF TABLES
Table 1.1. Physical properties of toluene ....................................................................4
Table 1.2. Occupational Exposure Limits of toluene from USA ................................5
Table 1.3. Maximum allowable concentration of some hazardous substances in
ambient air in Viet Nam (Legal 2006) ..........................................................6
Table 1.4. List of materials used in the experiment ..................................................10
Table 1.5. Calculate the flow rate based on retention time .......................................12
Table 1.6. Degradation and removal efficiency of outlet concentration of 200 ppm ....14
Table 1.7. Degradation and removal efficiency of outlet concentration of 150 ppm ...17
Table 1.8. Degradation and removal efficiency of outlet concentration of 100 ppm ...19
v
LIST OF ABBREVIATIONS
VUV
Vacuum Ultraviolet
VOC
Volatile organic compounds
CNS
Central nervous system
PID
Photoionization detection
OSHA PEL
The Occupational Safety and Health Administration
STEL
Short-term exposure limit
NIOSH IDLH
The National Institute for Occupational Safety and Health
immediately dangerous to life or health
ACGIH TLV
American Conference of Governmental Industrial Hygienists
threshold limit value
AIHA ERPG-2
American Industrial Hygiene Association emergency response
planning guideline
WHO
World Health Organization
TWA
Time weighted average
PEL
Permissible exposure limit
vi
DOCUMENTATION PAGE WITH ABSTRACT
Thai Nguyen University of Agriculture and Forestry
Degree Program
Bachelor of Environmental Science and Management
Student name
Le Ngoc Khanh
Student ID
DTN1454290015
Thesis Title
Degradation of Toluene Vapor using Vacuum
Ultraviolet Photolytic : A Way to Reduce Air
Pollution
Supervisor (s)
Nguyen Hung Quang
Supervisor’s signature (s)
Abstract
Vacuum ultraviolet is a simple way to destruct volatile organic compounds
(VOCs). In this paper, we are experiment the concentration of toluene during 30
minutes open VUV lamp. Results indicate that the toluene removal efficiency is
only 11 % in the VUV process. This process is depend on the influence
concentration of toluene, the concentration of toluene increased, removal
efficiency decreased and the concentration decreased, removal efficiency
increased.
Keywords
Toluene vapor
VUV radiation
Flow rate
Removal efficiency
Toluene concentration
VUV
Number of Pages
42
Date of Submission:
25/09/2018
vii
PART I. INTRODUCTION
1.1. Research rationale
Organic compounds are chemicals that contain carbon and are usually found
in all living things. Volatile organic compounds, sometimes referred to as VOCs,
are organic compounds that easily become vapors or gases (high vapor pressure).
Most of VOCs has a low boiling point of less than 15 C. However, some VOCs
may also contains some other substitutes such as hydrogen, oxygen,
fluorine, chlorine, bromine, sulfur or nitrogen, which may cause more harmful
effects to human. VOCs are commonly released from burning fuel, such as gasoline,
wood, coal, or natural gas. They are also emitted from oil and gas fields and diesel
exhaust. They are also released from solvents, paints, glues, and other products that
are used and stored at home and at work.
A number of petrochemical industry and some other types of industry also
produces or uses many types of VOCs in their processes. Loss of those chemicals
into air has been investigated more than 500 tons per year from industrial sector in
Thailand. Exposure with multi VOCs may associate with various syndromes, such
as fatigue, nausea, impaired vigilance, confusion, drowsiness, irritant-induced
asthma, and some respiratory symptoms. High exposure of VOCs at short period
may cause various actual effects, whereas many species of VOCs has a close-link to
be a major cause of cancer (called “carcinogen”). For example, formaldehyde and
benzene are considered by many authorities to be probable human carcinogens.
Nowadays, there are totally 5 conventional techniques to control VOCs
emission from various types of industry, which are absorption, adsorption,
incineration/oxidation, bio-filtration, and condensation. Each technique has their
own advantages and limitations. Absorption commonly limits on VOC gas
solubility in the selected liquid used in thes system. Smaller liquid droplet may
increase the solubility of the gas. Adsorption is a promising technology, which
always provides high removal efficiency, but the cost of operation and dispose is
also high. Incineration/oxidation is generally applied for VOCs emission at high
concentration, which high enough to be self-ignition. Lower concentration may also
increase operation costs due to additional co-fuel in the system. Bio-filtration is a
1
cheapest technology, which has low investment and operation cost. The
microorganism including bacteria and fungi are immobilized in the biofilm and
degrade the pollutant in the system. Due to the system rely mainly on microbial
growth, bio-clogging may be found for sometime. The condensation is one of the
recycling technologies to condense the gaseous pollutants (VOC) to become liquid
under high pressure and/or low temperature. However, pollutant concentration
should be high for cost effectiveness.
Vacuum Ultraviolet, or VUV, (has wavelengths shorter than 200 nm) are
strongly absorbed by molecular oxygen in the air. Longer wavelengths of about
150–200 nm can propagate through nitrogen, which is highly active for VOCs
oxidation. A VUV lamp emits UV light at a wavelength of 185 nm and generated
energetic photons that can activate oxygen and water vapor to produce numerous
reactive species such as O(D), O(P), hydroxyl radicals (OH) and Ozone. VUV has
been used to destruct various VOCs including benzene, toluene. Nevertheless, its
application is greatly limited by the formation of O3 byproduct and low degradation
capacity and mineralization rate for VOC destruction.
In this study, VUV was applied to remove toluene vapor from synthesis gas,
as a case study. Oxidation of VOCs was performed under VUV radiation in a
continuous flow reactor.
1.2. Reasearch’s Objectives
To assess the efficiency of toluene removal using VUV radiation in a
continuous flow reactor
1.3. Research questions and hypothesis
1. A breach-scale experiment was set up at the Department of
Environmental Engineering, King Mongkut’s University of Technology Thonburi
(KMUTT). A 3-L stainless reactor was selected in the study.
2. Toluene vapor was simulated using a toluene generator developed under
this study.
3. A continuous flow experiment was
4. The removal efficiency was assessed using measurement at inlet and
outlet of the reactor.
2
5. A multi-gas detector (MultiRae) was used for measurement of toluene
concentration based on photoionization detection (PID).
6. Optimum inlet concentration was also studied by vary an inlet gas flow rate.
The target inlet toluene concentrations under this study were 100, 150, and 200 ppm.
1.4. Limitations
The old VUV lamp is used that may ganerate the weak radiation, which
affect to the result of this experiment. Reactor design should be mentioned because
we do not have enough time to design the reactor.
Time is also a limitation to conduct this experiment because the internship
was taken place on only three and half of a month. It took time to study about this
new field of air pollution and searched the information about VUV, also knowledge
of VOC.
1.5. Definitions
1.5.1. Toluene
Chemically, toluene, also known as methylbenzene or phenylmethan, is an
aromatic hydrocarbon that is a colorless transparent liquid with a low viscosity.
Toluene is slightly soluble in water, its water solubility at 160C is 0.047 g/100ml
and at 150C is 0.04 g/100ml, a very good soluble lipid, oil, resin, phosphorus,
sulfur and iodine, in addition it can melt completely with some organic solvents
such as alcohol, ether, ketone, and especially toluene itself is a flammable solvent.
The chemical formula for toluene is C7H8, the molecular structure described, as
follows:
Figure 1.1. Chemical properties of toluene
3
Table 1.1. Physical properties of toluene
Physical state and appearance
Clear liquid
Color
Colorless
Odor
Sweet, solvent-like
Odor threshold
2.14 ppm (8 mg/cu.m.)
Vapor density at 0°C
3.1 (Air = 1)
Boiling point
110.6 °C (383,8 K)/ 231.08 °F
Melting point
−93 °C (180 K)/(-135,4 °F)
Solubility
0.053 g/100 mL (20-25 °C) in water
Specific gravity
0.870 tại 150C
Log K (octanol/water coefficient)
2.72
Percent volatile
100
Flammability classification
Flammable liquid
Toluene is used as an additive in gasoline mixtures to increase octane ratings,
in benzene production, and as a solvent in paints, coatings, inks, adhesives, and
cleaners. Additionally, toluene is used in the production of nylon, plastics, and
polyurethanes. Toluene was once used as a medicinal anthelmintic agent against
roundworms and hookworms.Toluene (methylbenzene) is a natural substance of
gasoline and crude oil. It is also used for synthesis of benzene and other chemicals,
including graphic pigments, paints, and solvents. It is a highly lipophilic white
matter toxin resulting in loss of myelin in cerebral and cerebellar white matter, as
well as in diffuse cerebral and cerebellar atrophy.
Toluene is irritating to the skin, eyes, and respiratory tract. It can cause
systemic toxicity by ingestion or inhalation and is slowly absorbed through the skin.
The most common route of exposure is via inhalation. Symptoms of toluene
poisoning include CNS effects (headache, dizziness, ataxia, drowsiness, euphoria,
hallucinations, tremors, seizures, and coma), ventricular arrythmias, chemical
pneumonitis, respiratory depression, nausea, vomiting, and electrolyte imbalances.
4
1.5.2. Standard of toluene
The American Conference of Governmental Industrial Hygienists (ACGIH)
(1997) has recommended 188 mg/m 3 as the 8-h time-weighted average threshold
limit value, with a skin notation, for occupational exposures to toluene in
workplace air. Values of 100– 380 mg/m3 are used as standards or guidelines in
other countries (International Labor Office, 1991). The World Health
Organization has established a provisional international drinking water guideline
for toluene of 700 μg/L (WHO, 1993).
Table 1.2. Occupational Exposure Limits of toluene from USA
Organization
Permission limit
OSHA PEL ( Occupational Safety and
200 ppm (averaged over an 8-hour
Health
Administration
permissible work-shift)
exposure limit)
OSHA ceiling = 300 ppm
300 ppm
OSHA STEL (short-term exposure limit) 500 ppm (10-minute exposure)
NIOSH IDLH (immediately dangerous 500 ppm
to life or health)
ACGIH TLV (threshold limit value)
50 ppm (averaged over an 8-hour workshift)
AIHA ERPG-2 (emergency response 300 ppm
planning guideline) (maximum airborne
concentration below which it is believed
that nearly all individuals could be
exposed for up to 1 hour without
experiencing or developing irreversible
or other serious health effects or
symptoms
which
could
impair
an
individual's ability to take protective
action)
5
Table 1.3. Maximum allowable concentration of some hazardous substances in
ambient air in Viet Nam (Legal 2006)
Inorganic substances
Chemical formula
The average time
Allowable
concentration
Toluene
C6H5CH3
30 min
1000
Unit: Microgram per
1 hour
500
cubic meter (μg/m3)
Year
190
1.5.3 Vacuum ultraviolet Vacuum Ultraviolet, or VUV, wavelengths (10 200 nm) are strongly absorbed by molecular oxygen in the air, though the longer
wavelengths of about 150–200 nm can propagate through nitrogen, which are
highly active for VOCs oxidation. A VUV lamp emits UV light at wavelength of
185 nm and generates energetic photons that can activate oxygen and water vapor to
produce numerous reactive species such as O(D), O(P), hydroxyl radicals (OH) and
Ozone. VUV has been used to destruct various VOCs including benzene, toluene.
Nevertheless, its application is greatly limited by the formation of O3 byproduct and
low degradation capacity and mineralization rate for VOC destruction.
6
PART II. LITERATURE REVIEW
Nowadays, air pollution is one of the most serious problems in the world. It
refers to the contamination of the atmosphere by harmful chemicals or biological
materials especially VOCs, SO2 and NO2 pollutants. Base on this issues, Chinese’s
researcher was found the way to reduced VOCs gaseous pollutant by using VUV
radiation and catalyst.
Huang and Leung (2014) had conducted the enhanced degradation of
gaseous benzene under vacuum ultraviolet (VUV) radiation over TiO2 (titanium
dioxide) modified by transition metals. They found that, the highest benzene
removal efficiency achieved 58% with photocatalysts as Mn/Tio2, Co/TiO2, Ni/TiO2
and P25 have the same benzene removal efficiency (50%). But it was declined to
45% for both Fe/TiO2 and undoped TiO2. This is because benzene could not able to
be destructed. There was no ozone produced in radiation of 254 nm UV lamp. This
indicated that the effect of direct photo-oxidation and catalytic ozonation of benzene
were absent. In the study, water vapor played a dual role in benzene oxidation in the
VUV-PCO process. Catalytic is mostly responsible for benzene abatement at low
humidity while 185 nm photooxidation is the dominant pathways at high humidity.
Huang (2016) studied the photo catalytic oxidation of gaseous benzene under
VUV radiation over TiO2/Zeolites catalysts. 100% benzene removal efficiency was
achieved over TiO2/zeolite due to the contribution of absortion in initial stage. The
benzene absorption capacity does not only depend on BET (Brunauer-EmmettTeller theory) surface area but also pore diameter of zeolite. The product of benzene
photocatalytic oxidation was only CO2.
Zhao(2013) evaluated the health risk of vacuum ultraviolet (VUV) photolysis
of naphthalene (NP) in indoor air, intermediates were detected by gas
chromatograph–mass spectrometry and proton transfer reaction-mass spectrometry.
His result shown the accumulation of VOCs, especially highly harmful aldehydes,
resulted in an increased of health risk influence index (ᶯ ) to 150 after VUV
irradiation of 2.81 min, while the mineralization of VOCs led to a sharp reduce of
(ᶯ ) to 28 after VUV irradiation of 7.01 min. It could be concluded that the
mineralization of VOCs was a key factor to alleviate the health risk of photolysis.
7
The results will give a safe and economical application of VUV photolysis
technology in indoor air purification.
Chaolin Li(26 February 2014) researched on Photolysis of low concentration
H2S under UV/VUV irradiation emitted from high frequency discharge
electrodeless lamps. The photolysis of low concentration of H2S malodorous gas
was studied under UV irradiation emitted by self-made high frequency discharge
electrodeless lamp with atomic mercury lines at 185/253.7 nm. In their study,
researcher have shown that a high efficiency for H2S removal (>90%) in the
presence of low [H2S] (3.1–29.6 mg m^-3) at various gas residence time (2.9–23.2
s). More importantly, the significant effects of relative humidity and oxygen
concentration on H2S removal demonstrated that the media played an significant
role in the photolysis processes, which is to some extent capable of probing into the
mechanisms of photolysis. Possible mechanisms for photolysis includes: direct
photolysis by UV/VUV light and indirect photolysis mediated by ozone and
hydroxyl radicals.
Huiling Huang and Haibao Huang(6 January 2016) examined the Efficient
degradation of gaseous benzene by VUV photolysis combined with ozone-assisted
catalytic oxidation: Performance and mechanism. In this study, they are the first
combining an efficient Mn/ZSM-5 catalyst with VUV photolysis to eliminate O3
and improved VOC degradation efficiency via ozone-assisted catalytic oxidation
(OZCO). Results indicate that the benzene removal efficiency was only 48% with
83 ppm residual O3 in the VUV photolysis process. However, both benzene and O3
were completely removed after the adoption of the Mn/ZSM-5 catalyst. The
possible degradation pathways and mechanism in such a novel VUV-OZCO process
was proposed according to the identified products. This study provided an efficient
and potential process with promising insights for the degradation of VOCs.
In our study, toluene was selected as the representative VOCs due to its high
toxicity and photochemical activity. Toluene was testes in a closed system under
vacuum ultraviolet radiation The concentrations of toluene at inlet and outlet were
observed. Noted that the outlet concentration was start measured when VUV lamp
turn on.
8
Toluene is a compound of the benzene series. At room temperature, toluene
is a clear-to-amber colorless liquid with a pungent, benzene-like odor. Although it is
a liquid at room temperature, toluene’s low vapor pressure results in extensive
volatilization. It is flammable with a flash point of 4.4 oC. Toluene is strongly
reactive with a number of chemical classes, particularly nitrogen-containing
compounds, and may react with some plastics. ACGIH (2000) has recommended an
8-hour time-weighted average (TWA) of 50 ppm (189 mg/m3) for toluene to protect
against effects on the central nervous system. OSHA (1993) has promulgated an 8hour permissible exposure limit (PEL) of 200 ppm (754 mg/m3).
The principal source of toluene exposure for the general population is
gasoline, which contains 5% to 7% toluene by weight. Toluene is released to the
atmosphere during the production, transport, and combustion of gasoline. Not
surprisingly, toluene concentrations are highest in areas of heavy traffic, near
gasoline filling stations, and near refineries. Toluene is short-lived in ambient air
because of its reactivity with other air pollutants. Toluene is used in aviation
gasoline and high-octane blending stock, and as a solvent for paints, coatings, gums
and resins. Other sources include tobacco smoke, petroleum and coal production,
use as a chemical intermediate, and for styrene production.
The highest concentrations of toluene usually occur in indoor air from the
use of common household products (paints, paint thinners, adhesives, synthetic
fragrances and nail polish) and cigarette smoke. The deliberate inhalation of paint or
glue may result in high levels of exposure to toluene, as well as to other chemicals,
in solvent abusers.
Toluene exposure may also occur in the workplace, especially in occupations
such as printing or painting, where toluene is frequently used as a solvent.
Levels of toluene was measured in rural, urban, and indoor air averaged 1.3,
10.8, and 31.5 micrograms per cubic meter (µg/m3), respectively.
9
PART III. METHOD
3.1. Materials
The list of materials used in this experiment is shown below.
Table 1.4. List of materials used in the experiment
Pump
1
Generate the fresh
Valve
3
Use to controll flow rate of gas
Pipe
3 meters
Lead the gas and toluene
Rotameter
1
Measure the flow rate of gas
Box
2
1 mix gas and toluene
Toluene bottle
1 lit
1 contain toluene
Reactor
1
Generrate toluene
VUV lamp
1
VOCs meter
1
Generrate electromagnetic
radiation
Notebook
1
Note the data
3.2. Method
3.2.1. Experiment setup
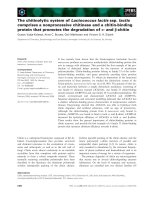
The experiment was set up, as presented in Figure 1.2. The pump draws fresh
air through a toluene bottle. With higher pressure due to the fresh air passing
through, part of toluene liquid in the bottle is vaporized. Generated highconcentration toluene vapor was mixed with a fresh air again in a mixing box to
dilute toluene concentration to the target concentration. The mix toluene vapor will
transport to the continuous flow VUV reactor. The inlet concentration of toluene
was measured at VOCs meter#1, whereas VOCs meter#2 was used for
10
measurement of outlet toluene concentration. Removal efficiency of toluene was
estimated. Valve#1, #2 and #3 were installed to control volume of gas passing into
the pipe. A 3-L stainless reactor was selected in the study to reduce the toluene
adsorption effect on the surface of reactor.
Figure 1.2. Schematic diagram of experiment setup
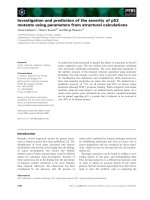
3.2.2. Calculate flow rate of gas based on a retention time
To study changes of efficiency due to a retention time, a target flow rate was
calculated based on a retention time in the reactor at 0.5, 1, 2, 3, and 4 minutes.
Detail calculation is shown as below.
d= 10 cm = 0.1 m
H= 43 cm = 0.43 m
Volume of the reactor
V=
=
= 3.3755*
m³
11
Table 1.5. Calculate the flow rate based on retention time
Retention time (min)
Volume (m³)
Flow
rate(L/min)
Flow rate(m³/min)
T
V
0.5
3.3755*
6.751*
6.75
1
3.3755*
3.3755*
3.38
2
3.3755*
1.68775*
1.69
3
3.3755*
1.125*
1.13
4
3.3755*
8.438*
0.84
Q=
Q
Figure 1.3. Size of reactor
Based on the volume of reactor, the target flow rate was calculated as shown
in Table 1.5. A rotameter was installed to control a flow rate of gas passing through
the reactor.
12
3.2.3. Experimental setup
Step 1: Set the inlet toluene concentration at 100 ppm and controll the
concentration to be stable within 30 minutes. Check the toluene concentration for
every 1 minute during the control period (30 minutes)
Step 2: Check the leakage of the system (with VUV lamp but not turn on) by
measuring the outlet concentration for every 1 minutes during 30 minutes. The
outlet concentrations are expected to be equal with the inlet one.
if the outlet concentrations stable at 100 ppm, the experiment can be
started by turn on the VUV lamp.
if the concentration is not stable 100 ppm, the inlet concentrations
should be recheck again by going back to Step 1
Step 3: Activated carbon was installed to clean the remaining toluene at the
outlet
Step 4: Start the experiment by turn on the VUV lamp and measure the outlet
concentrations for every 1 minute during 30 minutes
Step 5: Adjust the inlet toluene concentrtions at 150 and 200 ppm, respectively and
start step 1, 2, 3 and 4 again. After the experiment, the system efficiencies for
toluene removal were calculated.
The experiment was taken place at laboratory of the Department of
Environmental Engineering, Faculty of Engineering. We conducted 3 sample of
toluene concentration at 100, 150 and 200 ppm respectively. For each sample, the
concentration is measured 30 times before we turned on VUV lamp and 30 times
with VUV lamp turned on.
13
PART VI. RESULT AND DISSCUSION
4.1. Result
4.1.1. Reduction of outlet concentration of 200 ppm and C/C₀(%)
We conducted the sample of toluene concentration at 200 ppm:
Generated the oulet concentration of toluene at 200 ppm and controlled
concentration to be constant within 30 minutes. Then, check the leakage of the
system (with VUV lamp but not turn on) by measuring the outlet concentration for
every 1 minutes during 30 minutes. Start the experiment by turn on the VUV lamp
and measure the outlet concentrations for every 1 minute during 30 minutes.
Followed by calculating the removal efficiency, as the result shown (table 1.6) the
concentrations before and after turn on the VUV lamp and removal efficency.
Table 1.6. Degradation and removal efficiency of outlet concentration of 200 ppm
Turn off the lamp
Time (minute)
Concentration (ppm)
C/C₀
0
200
1
1
199.9
0.9995
2
200
1
3
199.8
0.999
4
200
1
5
199.5
0.9975
6
200
1
7
199.8
0.999
8
199.9
0.9995
9
200
1
10
200
1
11
199.5
0.9975
12
200
1
13
199.5
0.9975
14
200
1
15
199.7
0.9985
14
Turn on the lamp
16
199.8
0.999
17
200
1
18
199.8
0.999
19
200
1
20
199.8
0.999
21
199.9
0.9995
22
200
1
23
200
1
24
199.9
0.9995
25
200
1
26
200
1
27
199.7
0.9985
28
200
1
29
200
1
30
200
1
31
200
1
32
198
0.99
33
197.9
0.9895
34
197.4
0.987
35
197.8
0.989
36
197.6
0.988
37
197.7
0.9885
38
197.7
0.9885
39
197.5
0.9875
40
197
0.985
41
196.8
0.984
42
195.9
0.9795
43
194.4
0.972
44
193.5
0.9675
45
192.6
0.963
15
46
191.9
0.9595
47
191.5
0.9575
48
191.5
0.9575
49
191.4
0.957
50
191.2
0.956
51
191.3
0.9565
52
191.1
0.9555
53
191.1
0.9555
54
191.2
0.956
55
191.3
0.9565
56
191.1
0.9555
57
191.2
0.956
58
190.9
0.9545
59
191
0.955
60
191.1
0.9555
As the table 1.6 shown, toulene concentration reduced approximately 9 ppm
after 30 minutes when VUV lamp was turned on. With this result, removal
efficiency were calculated by 5%, it is reasonable but the removal efficiency is
lower than the other literature.
4.1.2. Reduction of outlet concentration of 150 ppm and C/C₀(%)
We conducted the sample of toluene concentration at 150 ppm:
Generated the oulet concentration of toluene at 150 ppm and controlled
concentration to be constant within 30 minutes. Then, check the leakage of the system
(with VUV lamp but not turn on) by measuring the outlet concentration for every 1
minutes during 30 minutes. Start the experiment by turn on the VUV lamp and measure
the outlet concentrations for every 1 minute during 30 minutes. Followed by calculating
the removal efficiency, as the result shown (table 1.7) the concentrations before and after
turn on the VUV lamp and removal efficency.
16
Table 1.7. Degradation and removal efficiency of outlet concentration of 150 ppm
Time(minute)
Turn
lamp
off
Concentration(ppm) C/C₀
the 0
150
1
1
150
1
2
149.9
0.999333333
3
150
1
4
150
1
5
149.9
0.999333333
6
149.8
0.998666667
7
149.9
0.999333333
8
150
1
9
150
1
10
150
1
11
150
1
12
150
1
13
150
1
14
149.9
0.999333333
15
150
1
16
149.9
0.999333333
17
150
1
18
149.9
0.999333333
19
150
1
20
150
1
21
150
1
22
150
1
23
149.9
0.999333333
24
150
1
25
150
1
26
150
1
27
150
1
28
150
1
17