Quasimodo pattern (over and under)
Bạn đang xem bản rút gọn của tài liệu. Xem và tải ngay bản đầy đủ của tài liệu tại đây (3.54 MB, 72 trang )
1
Quasimodo Pattern (Over and Under)
Easy guide to trading the Quasimodo Pattern
The Quasimodo Pattern or Over and Under pattern is a relatively new entrant to the field of
technical analysis in the financial markets. Although new, the Quasimodo pattern is a commonly
occurring theme that is more frequent when price carves a top or a bottom or when price begins a
major correction to the trend.
The Quasimodo Pattern, although complex as it might seem is actually very simple. This trading
pattern is especially powerful because when it occurs, in most cases, traders will notice a confluence
with other methods of analysis.
For example, when a trader spots a Quasimodo pattern near a support or resistance level, it
increases the confidence of the trader or the trading probability. Likewise, when trading divergences,
when you spot a Quasimodo pattern, that confluence can be used to trade the divergence set up with
more confidence.
As we can see from the above, the Quasimodo pattern is not a trading strategy by itself but is more of
a confluence pattern that can be used to confirm a trader’s bias. Of course, the Quasimodo pattern
doesn’t appear all the time, but when it does, traders can be sure that the market offers a high
probability trade set up.
What is the Quasimodo (Over and Under) Pattern?
A Quasimodo Pattern is simply a series of Highs/Lows and Higher or Lower highs or lows.
Quasimodo Short Signal Pattern
1.
2.
3.
4.
5.
There should be a prior uptrend in the markets
Price makes a new high, declines and makes a new local low
Price then rallies above the previous high to mark a new higher high
Price then falls to form a new lower low
Price then rises towards the initial high (but does not make a new higher high).
The fifth level in the set up is the trigger, where a short position is taken. Stops are set above the
higher high and the take profit level is up to the trader.
Quasimodo Long Signal Pattern
1.
2.
3.
4.
5.
There should be a prior downtrend in the markets
Price makes new low then makes a small rally and forms a local high
Price then declines to form a new lower low taking out the previous low
Price then rallies to make a new higher high and then declines
The final decline is equal to the first low
The fifth leg in this pattern is the trigger for long positions with stops set to at or below the lower low
2
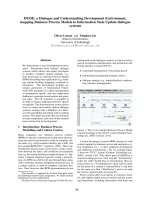
Quasimodo Long Signal Pattern Examples:
Quasimodo Long Example #1
1.
2.
3.
4.
5.
Price is in a downtrend
Price then makes a new low at 99.923 and then makes a new local high at 100.274
Price then declines and makes a new lower low at 99.983
Price then rallies to make a new higher high at 100.38 and then declines
The final leg in the decline is just a few pips above the previous low. This triggers a long
signal
Here is another example of the Quasimodo Long example:
Quasimodo Long Example #2
3
Quasimodo Short Signal Pattern Examples:
Quasimodo Short Example #1
1.
2.
3.
4.
5.
Price is in an uptrend
Price then makes a new high at 1.5251 and then declines to make a low at 1.5187
Price then rallies to make a higher high at 1.5321 and then declines
A new lower low is posted at 1.5165
Price then makes a modest rally and this high stalls a few pips close to/above the previous
high
6. A short entry is then taken with stops near the highest high
7. There is also an additional confirmation yet again with the RSI divergence as well
Another example of the Quasimodo Short pattern example is given
below:
Quasimodo Short Example #2
4
A Quasimodo / Over and Under Price Pattern
Revision
I have been treating this blog like a personal log of observations for years, and one of the first
patterns I wrote about was the over and under (nicknamed “Quasimodo” by some of our members).
The bulk of my trading consists of a simple set of processes:
1. Fundamental landscape, which for me translates to “how humans (and their machines) react
to fundamental data”
2. Stage of a trend. Depending on the timeframe I am trading, I want to see at least 2 movements. I
will enter on either the first or second piece of a movement, to a predefined target.
3. Measured move / target. There are countless targets available to traders. What I classify as a
“natural” movement in price typically results in approximately 1.5X+ the movement leading
immediately preceding it.
4. A handful of entry patterns that happen either at bottoms / major reversals, or in the context of a
trend. Over and Unders are one of them.
Why do we like this pattern so much?
Over and Unders follow both conventional and non-conventional price behaviors. Conventional in
the sense that they essentially nothing more than the beginning of a head and shoulders pattern.
Unconventional in the sense that they follow our rules for inner trendlines and confluence points.
But there is much more to this little pattern than I initially discussed. When I wrote about these many
years ago, I had one extra “qualification” that required price to move beyond a specified high or low
in order to demonstrate a commitment of buyers or sellers. In many cases, however, you will not find
this to be the case. As a result, you will be missing out on a considerable amount of opportunity.
Over time, I have realized the the contextual value of any pattern is of course much more relevant
than the pattern itself. After all, there is a reason that most price patterns demonstrate much better
behavior when found within the context of trends. Common sense should tell you that your
performance should get a bump simply when conditions are prime, by latching onto underlying
macro movements.
Context Overrules All
I put particular emphasis on price patterns found within trends for the simple reason stated above.
These “rules” stand true in any market. So for today, we will think less about the extra qualification
previously stated with this pattern and take a look at the pattern itself with a solid contextual
reference.
This same methodology stands true for any other continuation / reversal pattern (more specifics in
upcoming posts). As I mentioned earlier, there are really only a handful that I use (6 to be exact).
They are:
Triple Taps
Over and Unders
Double Top/Bottom Pullbacks
Double Top/Bottom Fakeouts (where a double bottom or top is exceeded by a small amount)
Square roots (Top or Bottom followed by a lower or higher double top or bottom)
5
V tops or bottoms
My workday is essentially a constant hunt for these (all the better when there is a combination of
them), usually with declining volume, and a simple count of legs and identifying targets. And so for
today, we will only worry about Over and Under‘s.
Over and Under's are More Common Than One Might Think
As with any patterns I seek, abundance is a word I like to use in relation to them. If I can't see them
everywhere, then I know I am dealing with nothing more than an anomaly. The following chart
demonstrates just how common of a pattern these really are. Many of these are of course legitimate
head and shoulders patterns as well:
Before you let your mind wander on what each of those levels might represent, I want you to bear
one word in mind: yield. Which of these patterns provided the best return, and which ones did you
have to “fight against” a little more in order to turn a profit?
The answer is as obvious as you would initially believe it to be, and the shorts as a whole paid off
more than the longs (on this timeframe). This is not to say that the longs didn't provide some help as
well, but if we are looking at these trades from a safety standpoint then the choice is clear. When
found in the context of trends, Over and Unders (and any other pattern) will give up more yield and
at a much faster rate than countertrend.
Below is a more recent chart displaying 2 trend following trades, confirmed with Over and Unders,
and one reversal:
6
There are some patterns which are extremely popular: head and shoulders is one of them. Because of
this, traders take note when that right shoulder is set in place. These patterns are so popular to the
point at which, when a “right shoulder” is seen on a higher timeframe some form of a scalp can very
consistently be made with them. A minimum target on these is going to be the neckline itself, with of
course a break of the neckline signifying further follow-through in classic head and shoulders form.
In trend following situations, this neckline is going to come very, very quickly of course and so I
recommend using measured movements on a more macro scale in order to define your target. As an
example:
7
Here we have a series of Over and Unders found within the context of a trend. Those of you who
become “scared” at trading smaller timeframes please bear this in mind: many of these are NOT
visible on higher timeframes. We have a clear trendline break to the upside, and you, as a trader,
want to get in. In order to find these smaller patterns, you're going to have to scale down.
You can see from the chart that range-based measured move is applied to find a reasonable intraday
target. As I write, we are getting 3 shoves to the upside (in a parabolic move), insinuating short-term
slowdown. There is also another Over and Under at the peak of price, this very moment (not shown
in the chart but explained below).
As far as other patterns on this chart are concerned (used for the purpose of entering this trend) they
are there, but I am going to save them for future posts. This pattern in particular is easy to identify
and happens very frequently. Witnessing these, in the example above, accompanied with bullish bar
behavior thereafter is a prime example of what I personally, actively seek on a regular basis.
Other Pattern Mash-Ups
Over and Unders will commonly appear with other patterns, such as triple taps, as well. In the case
of triple taps, the second to last shove is used as the point at which price ricochets. Let's take a look
at another example:
Being a 3 minute chart above, once again, more detail can be found. From left to right on this chart,
we have a wider channel turning into a sharp drive, and then another small “channel” which is
essentially a tripe tap. Within the context of all of this, you have smaller, intraday patterns such as
these that can be used to latch onto the underlying movements.
Note that with many of these, the “right shoulder” can be created very soon after the actual lowest
low or high. After that, it becomes a matter of breaking trendlines. Bullish or bearish bar closes
directly ahead of the opposing trendlines (not shown) will suffice.
8
The Falsity of “False” Breakouts
One term I have never cared for is “false” breakouts. There is nothing “false” about these. It is
normal market behavior: no one is out to “fool” you, no one is out to “get” you, it's just price
exceeding a certain level, picking up more order flow, and reversing. Most of the time, it is the result
of last minute trend followers latching on for a quick trade, and others reversing at better prices.
When an Over and Under is in place, you may hear the masses calling these a “false” breakout. In
my opinion, those using the term “false breakout” are regularly getting fooled themselves. They
believe that their support and resistance levels are essentially written in scripture and when they are
broken, the “big guys” are running them down (well the second part of this sentence is true). Two
little rules rules will keep you out of this mess:
1. Expect it
2. Understand what is normal market behavior
Price running down levels is all a part of a day's routine. Stay on the side of the trend, and you'll be
the one running then down.
Using smaller, intraday patterns such as these are going to allow you to latch onto the correct
movements. In future posts, I'll cover the others listed above. As usual, my work/life schedule doesn't
allow me to update this blog as much as I would like to, but these are some solid beginner points to
use as a framework and add to your trading arsenal.
9
Double Top and Double Bottom Pattern
Double tops and double bottom chart patterns are perhaps the best and easiest of Reversal chart
patterns to get accustomed to trading with price action. These two chart patterns are indicative of a
reversal and are also visually easy to identify. In this article, we will explain the concepts of double
tops and double bottoms and also how to trade them effectively.
What are double tops and double bottoms?
A double top pattern is formed when price tries to rally and fails to break a previous resistance level
and a double bottom pattern is formed when price drops but fails to break a previous support level.
These chart patterns are very reliable chart patterns and can be traded in isolation. However, traders
should bear in mind that there are many instances when a double top or a double bottom pattern can
fail. The reliability however ensures that the trading approach using double tops and double bottoms
offers a very low risk, high reward ratio.
Identifying Double tops and Double bottoms
The following chart illustrates how a double top or a double bottom pattern visually looks like.
Figure 1: Double Top and Double Bottom Pattern
In order to trade the double top or double bottom patterns, the following rules must be kept in mind.
10
Double Top Pattern
Price rallies to previous resistance level but fails to break any higher
Sell on break of previous support or on retest
Target is the measure of distance between the top and the bottom, projected from the break
out
The chart below gives an illustration of the double top pattern and the projected moves based on the
distance of the prior intermediary support.
Figure 2: Double Top Pattern
Double Bottom Pattern
Price drops to find support and tries to attempt for the second time to break below the
established support
When price fails to break the support, buy on the break of the intermediate resistance level
formed
Target is the measured distance between the support and resistance, projected from the break
out price.
Figure 3 illustrates how to trade the double bottom pattern based on the projected price from the
intermediary resistance level from previously established support level.
11
Figure 3: Double Bottom Pattern
Trading the Double Top and Double Bottom
patterns
The following sections illustrate how to trade the double top or double bottom patterns. Note that
most traders tend to use the candlestick or bar charts. The problem is that the highs and lows can be a
bit misleading. Therefore, a closing line chart is best suited to find double top and double bottom
patterns. Although the patterns may not be that common, trading a double top or double bottom
pattern using the line chart offers more probability of success.
Figure 4: Double Top Pattern Example
12
In Figure 4, we have a classic example of a double top pattern identified with a line chart. Here, we
can see a sharp reversal from the previously established resistance level. When price breaks the
intermediate support formed, a short position is taken, with the price objective being the measured
distance between the intermediate support and the main resistance level.
Figure 5 shows the above same pattern but with candlestick chart. Notice how confusing it is to
properly identify this same double top pattern formed by the line chart?
Figure 5: Confusing Double Top Pattern in Candlestick charts
In the next chart below, we can see how a double bottom pattern is formed, identified with the line
chart. After a break of the intermediary resistance level, we take long position, targeting the
measured distance between the established support level to the intermediary resistance level and
projected from the break out level.
Figure 6: Double Bottom Pattern Example
The double top and double bottom patterns are two reliable chart patterns that can form either
towards an exhausted trend or within a consolidation price range. Stops are usually left to the trader’s
discretion. An aggressive approach of trading the double tops and double bottoms is to place a buy or
13
sell order at the intermediate support or resistance level or to wait for a pullback, which may or may
not happen depending on the strength of the trend.
The double top and double bottom patterns can be traded with trend lines as well, as shown in the
chart below.
Figure 7: Double Top Pattern with trend lines
Here we notice how a double top pattern was formed within the two trend lines. While we already
get the minimum target of the downside move, an earlier entry could have been taken when the
second trend line was broken along with the most immediate support level shown on the chart. This
trade would have given a very low risk, high reward trade opportunity.
While double top and double bottom patterns are not 100% reliable, the fact that they can
combined with other price action trading ensures that they offer a low risk, high reward trade set ups
thus ensuring that the losses are well covered by the winners.
14
ABCD Pattern Trading
The ABCD pattern (AB=CD) is one of the classic chart patterns which is repeated over and over
again. The ABCD pattern shows perfect harmony between price and time and is also referred to as
‘measured moves’. It was developed by Scott Carney and Larry Pesavento after being originally
discovered by H.M Gartley. (see more about Gartley patterns)
Within the ABCD patterns, there are 3 types as mentioned below.
Price and Time: Under this type of ABCD pattern the amount of distance and the time it takes
for price to travel from A to B is equal to the time and distance from C to D
Classic ABCD: In this pattern, the BC is a retracement of 61.8% – 78.6% of AB, with CD
being the extension leg of 127.2% to 161.8% (equal in price distance)
ABCD extension: CD leg is an extension of AB between 127.2% – 161.8%
The chart below shows the three different ABCD bullish patterns.
Trading the ABCD bullish pattern
Swing points A and B form the highest high and the lowest low of the swing leg
When AB is identified, the next step is to plot BC
C must be lower than A and must be the intermediate high after the low point at B
C usually retraces to 61.8% or 78.6% of AB
In strong markets, C can trace only up to 38.2% or up to 50% of AB
Point D must be a new low below point B
CD must be 127.2% or 161.8% of AB or of CD
Buy at point D
Some variations to the rule include:
CD can be an extension of AB anywhere from 1.272% up to 2.00% and even greater
CD leg usually slopes at an angle that is wider than the AB leg
When there is a gap formed after point C, it indicates that the CD leg will be much larger
than the AB leg ( ? Read more about Gap Trading )
Appearance of wide range bars near point C is also an indication that CD will be an extended
leg
In most cases, AB and CD are equal in time and price
If the CD leg is covered within just a few price bars as compared to the AB leg, then it is an
indication that the CD leg will be an extension of AB
15
The opposite rules apply for bearish ABCD patterns. The chart below illustrates a Buy trade example
where we notice that BC retraced close to 61.8% (at 59.4%) after which CD travelled close to
139.6% of the AB leg. After the D point has been identified, a buy order would be place at or above
the high of the candle at point D.
Traders should note that the ABCD count should not be confused with the ABC corrective waves
from the Elliott Wave count.
The ABCD is a recurring pattern that is repeated over and over in the price charts, with each of the
patterns qualify any of the rules mentioned above forming any of the 3 patterns. The ideal way to get
started with the ABCD pattern is to look for highs and lows in the price. A good way would be to
make use of the zig-zag indicator found with the MT4 trading platform. This indicator can
automatically plot the highs and lows and thus identify the traders to any potential ABCD patterns.
Additionally, using an oscillator helps in identifying the turning points once pivot swing point D is
formed. The ABCD also forms the basis of many other chart patterns such as the three-drives
patterns and also within the price channels.
16
The chart above shows the bullish ABCD pattern being easily identified with the zig-zag indicator.
After point D is formed, price makes a small rally right after this pivot swing low if formed. As we
can see from the above, the ABCD pattern is a simple harmonic pattern that appears on the price
charts frequently. If can give clues to the trader about potential future moves.
17
Forex CYPHER pattern
The Harmonic Cypher pattern is visually an inverse pattern of the more common Butterfly
harmonic pattern (read more about butterfly pattern). It is not as commonly occurring as the
Butterfly pattern and is distinct by the strict rules that govern the Cypher harmonic pattern. The
Cypher pattern was discovered and defined by Darren Oglesbee.
The chart below illustrates a bullish and a bearish Forex Cypher pattern.
Forex cypher pattern– Bullish and Bearish
The main rules of the Bullish and Bearish Cypher patterns are as follows:
Cypher Pattern – Rules
The Cypher pattern starts with a market price that establishes the X and A points. Once
this leg is determined, the pattern evolves.
Point B retraces to 0.382 – 0.618 Fibonacci level of the leg XA
Point C is formed when prices extend the XA leg by at least 1.272 or within 1.130 – 1.414
Fibonacci extension level
Point D is formed when it retraces 0.782 Fibonacci level of XC
Point D is also where prices are expected to reverse
Targets are determined as 0.382 and 0.618 Fibonacci retracement levels of the CD leg
Stops losses are placed a few pips below or above the high or low of point X
18
Forex cypher pattern Targets
Bearish Cypher Pattern – Sell Trade Example
The following chart illustrates a bearish cypher pattern example.
BearishCypher Pattern, Sell Set up
After forming the (XA) leg, price retraced to 0.566% to form point (B)
From (B), the (C) leg extended (XA) by a 1.418%
From (C), price then rallied to point (D), marking a 0.972% retracement of (XA)
The short position after point D saw prices falling to 0.382% and 0.618% of the CD leg with
stops at the high above or near (X)
Bullish Cypher Pattern – Buy Trade Example
The following chart illustrates a bullish cypher pattern example.
19
BullishCypher Pattern buy set up
After the (XA) rally, prices retraced to 0.462% to mark point (B)
From B, price rallied back but did not make a new high, but just close enough to point (A)
high to mark (C)
From (C), prices then fell below (B) but above (X), retracing (XA) to 0.763
From (D), price then rallied to reach the 0.382% and 0.618% retracement level of (CD). The
entry would have been a few points above (D) with stops at (X)
Important points when trading the Cypher Pattern
The cypher forex pattern is not as common as other harmonic patterns such as Gartley’s or
butterfly patterns
Although the occurrence of the cypher pattern is rare, it is by no means a pattern that offers a
higher probability
Due to the rare occurrence of the cypher pattern, traders should make room for adjustments to
the Fib levels
Waiting for the perfect cypher pattern will result in the trader watching the charts for a very
long time with no valid set up occurring
The cypher pattern can occur on any time frame, but is best to use on H1 and higher
20
Flags and Pennants Chart Patterns
Trading Flags and Pennants Patterns
Flags and pennants chart patterns are primarily known for signaling a continuation of the
previous trend. The flag or pennant chart pattern is formed right after a bullish or bearish price
movement followed by a period of consolidation. This is where price tends to take a pause before
continuing in the original direction of the trend.
Flags and pennants chart patterns are easy to identify and can be found just after an important
news release such as the NFP/unemployment reports or other important economic news release.
(read more about NFP here)
Trading the Flag Patterns
The flag pattern is identified by two main elements.
The flag post, which is basically the strong price action
The flag, which is a period of consolidation
A bullish flag is identified by a downward sloping flag, where as a bearish flag is identified by an
upward sloping flag.
The following chart shows the bullish and bearish flag patterns along with how they are traded.
21
Figure 1: Bullish Flag Example
After price starts to consolidate and move gradually lower, look to buy on the break out of the flag.
The price objective is expected to be the minimum previous distance of the flag post from the break
out price level. The Figure 2 shows an example of a bullish flag trade example.
Figure 2: Bullish Flag Trade Example
Figure 2 above shows a bullish flag example. We notice how the price moved rapidly before entering
a period of gradual exhaustion, shown by the number of candles within the flag. After breaking out
of the flag pattern, price rallies to reach not only the minimum price objective but rallies to make
higher highs. The stops for the bullish flag are placed just at the low prior to the break out from the
bullish flag.
A bearish flag is characterized by a sharp drop in price followed a period of gradual price congestion
moving higher within a channel. On break out of the bearish flag, price then travels a minimum
distance of the flag post. The Figure 3 illustrates a typical bearish flag pattern.
22
Figure 3: Bearish Flag Example
The next chart below, Figure 4 shows an example of how the bearish flag is traded.
Figure 4: Bearish Flag Trade Example
An interesting point to bear in mind in the above bearish flag trade example is the retest of the break
out level. This retest may or may not happen, but it does remind traders that trading on a retest of a
break out price level is always a safe option. However, this is not always as the case as in most cases
with flags, the break it sharp and quick.
In the case of the above bearish flag break out, despite the rally back to retest the break out level,
price did manage to reach the minimum price objective.
23
Trading the Pennant Patterns
The pennant patterns are similar to flags, with the main difference being that the patterns are formed
as converging trend lines into a triangle. The bullish and bearish pennant chart patterns work on the
same principles of the flag patterns. The following chart shows a bearish pennant pattern.
Figure 5: Bearish Pennant Example
As seen by the above chart, the bearish pennant pattern is identified by converging trend lines
forming a pennant that is sloping upwards at the bottom end. The pattern is somewhat similar to a
symmetrical triangle formed within a smaller number of candles, but preceded by a sharp bearish
drop.
Figure 6 illustrates a bearish pennant example. In this example, we also get to see a fake out that
occurred out of the bearish pennant/symmetrical triangle. When taken in view of the larger chart
pattern, the bearish pennant, the fakeout could have been easily avoided. Price eventually manages to
break lower out of the pennant pattern eventually retesting the break out before dropping to reach the
price objective.
24
Figure 6: Bearish Pennant Trade Example
The bullish pennant pattern is the opposite of the bearish pennant pattern and almost similar to a
bullish flag pattern, with the exception that the pennant is formed by converging trend lines forming
a symmetrical triangle. The chart below, Figure 7, shows a bullish pennant example and how it can
be traded.
Figure 7: Bullish Pennant Example
Figure 8 represents a trade example of a bullish pennant pattern. Here we can see after a rapid rally,
prices started to consolidate within a tight range forming a pennant. Upon break out from this
pennant, price then subsequently rallied to reach the projected target.
25
Figure 8: Bullish Pennant Trade Example
The flags and pennant patterns can be a good way to trade chart patterns. Because they are
continuation patterns, the chances of them failing a very low and therefore can offer a safer way to
trade chart patterns, especially for those who are just getting started with this approach to trading.