Using satellites images for mapping and estimating aboveground biomass of mangrove forest in thai binh province
Bạn đang xem bản rút gọn của tài liệu. Xem và tải ngay bản đầy đủ của tài liệu tại đây (2.42 MB, 78 trang )
ABSTRACT
Mangroves are recognized as a highly valuable resource due to their provision
of multiple ecosystem services. Mapping and monitoring mangrove ecosystems is a
crucial objective for tropical region. Thai Binh province is one of the most important
mangrove ecosystem in Vietnam. The mangrove ecosystem in this area faces the threat
of deforestation from urban development, land reclamation, increase in tourism and
natural disasters (global warming). On other hand, a large mangrove area are planted
in this area. The aim of this research to detect the changing of mangrove area and
mapping the aboveground biomass in Thai Binh province. It also aimed at determining
the changes that has occurred over the years 1998, 2003, 2007, 2013 and 2018. The
land use land change map was obtained by using supervised classification. The
accuracy assessment for the classified images of 1998, 2003 and 2007, 2013 and 2018
are 93%, 86%, 96%, 94% and 91% respectively with kappa of 0.88, 0.79, 0.93, 0.91
and 0.87. The mangrove cover in 1998 was 5874.93ha, in 2003, it increased to
5935.77ha but in 2007, it decreased to 4433.85ha, increased to 6345.09 in 2013 and
further increased in 2018 to 6587.88ha. This study also estimate AGB by using
vegetation indices. In 1998, the total AGB in this study area are 62880 ton and in 2018
are 187990ha with the root mean square error (RMSE) = 7.2 ton/ha.
i
TABLE OF CONTENT
ABSTRACT ........................................................................................................................ I
CHAPTER 1 : INTRODUCTION .................................................................................... 1
1.1
BACKGROUND ............................................................................................................ 1
1.2
PRIOR STUDY .............................................................................................................. 2
1.3
ROLE OF REMOTE SENSING AND GIS IN MANGROVE MONITORING ............................ 3
1.4
PROBLEM STATEMENT ............................................................................................... 4
1.5
RESEARCH OBJECTIVES ............................................................................................. 5
1.6
ORGANIZATION OF THE THESIS .................................................................................. 6
CHAPTER 2 : LITERATURE REVIEW ........................................................................ 7
2.1
MANGROVES .............................................................................................................. 7
2.2
PHYSICAL FACTORS AFFECTING THE GROWTH OF MANGROVES ................................ 7
2.2.1 Climatic factor ........................................................................................................... 8
2.2.2 Temperature............................................................................................................... 8
2.2.3 Precipitation .............................................................................................................. 8
2.2.4 Waves and tidal range ............................................................................................... 9
2.2.5 Salinity conditions ..................................................................................................... 9
2.2.6 Soil structure .............................................................................................................. 9
2.3
THE APPLICATION OF REMOTE SENSING IN MONITORING MANGROVES ................. 10
2.3.1 Aerial photography .................................................................................................. 11
2.3.2 Satellite imagery ...................................................................................................... 11
2.3.3 GIS, Remote Sensing and Change Detection .......................................................... 12
2.3.4 Mangrove biomass estimation by Remote Sensing and GIS ................................... 12
CHAPTER 3 : METHOD ................................................................................................ 15
3.1
STUDY AREA ............................................................................................................ 15
3.1.1 Geography location ................................................................................................. 15
3.1.2 Climate ..................................................................................................................... 16
3.1.3 Tidal regime ............................................................................................................. 16
3.1.4 Mangroves forest in Thai Binh Province ................................................................. 16
3.2
DATA COLLECTION................................................................................................... 17
3.2.1 Instruments and software......................................................................................... 17
ii
3.2.2 Satellite image collection......................................................................................... 18
3.2.3 Field survey ............................................................................................................. 22
3.3
DATA ANALYSIS ....................................................................................................... 25
3.3.1 Image pre-processing .............................................................................................. 25
3.3.2 Filling the Gaps of Landsat 7 ETM+ image. .......................................................... 27
3.3.3 Cloud Masking ......................................................................................................... 28
3.4
CLASSIFICATION....................................................................................................... 29
3.4.1 Supervised classification ......................................................................................... 29
3.5
ACCURACY ASSESSMENT ......................................................................................... 32
3.5.1 The Error Matrix ..................................................................................................... 32
3.5.2 Kappa Statistics ....................................................................................................... 34
3.6
ESTIMATING ABOVE GROUND BIOMASS.................................................................. 34
3.6.1 Allometric Equation ................................................................................................. 35
3.6.2 Vegetation indices and estimate above-ground biomass......................................... 36
3.7
REGRESSION ANALYSIS ............................................................................................ 39
3.7.1 Linear regression ..................................................................................................... 39
3.7.2 Model validation and accuracy assessment ............................................................ 40
CHAPTER 4 : RESULT AND DISCUSSION ............................................................... 41
4.1
MANGROVE CLASSIFICATION .................................................................................. 41
4.1.1 Classification feature ............................................................................................... 41
4.1.2 Mangrove Classification mapping........................................................................... 42
4.1.3 Land use land cover change Accuracy Assessment ................................................. 46
4.2
MANGROVE BIOMASS ESTIMATING .......................................................................... 51
4.2.1 Single linear regression ........................................................................................... 51
4.3
AGB ACCURACY ASSESSMENT ............................................................................... 54
4.4
SPATIAL DISTRIBUTION OF MANGROVE VEGETATION BIOMASS IN 1998 AND
2018………….. ............................................................................................................. 56
CHAPTER 5 : CONCLUSION, LIMITATION, REMOMENDATION .................... 60
5.1
LIMITATION OF THE RESEARCH ................................................................................ 60
5.2
RECOMMENDATION .................................................................................................. 60
ACKNOWLEDGEMENT ............................................................................................... 61
iii
REFERENCE.................................................................................................................... 62
APPENDIX........................................................................................................................ 70
iv
LIST OF FIGURE
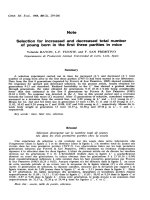
FIGURE 1: STUDY AREA..................................................................................................15
FIGURE 2: CIRCULAR PLOT OF 1000 M² ..........................................................................23
FIGURE 3: SAMPLING LOCATION ....................................................................................24
FIGURE 4: DIAGRAM OF RESEARCH WORKFLOW .......................................................... 25
FIGURE 5: LANDSAT 7 IMAGE (BAND 4, 3, 2) RECEIVED ON OCTOBER 21TH 2003
BEFORE AND AFTER GAP FILLING .................................................................................. 28
FIGURE 6: OPEN MANGROVE .......................................................................................... 31
FIGURE 7: DENSE MANGROVE FOREST ...........................................................................31
FIGURE 8: WATER BODY LAND USE ...............................................................................32
FIGURE 9: LAND USE LAND COVER MAP IN 1998, 2003, 2007, 2013, 2018 ..................44
FIGURE 10: LAND COVER CHANGE FROM 1998 TO 2018 ................................................45
FIGURE 11: SCATTERPLOTS OF CORRELATIONS BETWEEN ABOVEGROUND BIOMASS
(AGB) AND NORMALIZED DIFFERENCE VEGETATION INDEX (NDVI) .......................... 52
FIGURE 12: SCATTERPLOTS OF CORRELATIONS BETWEEN ABOVEGROUND BIOMASS
(AGB) AND SOIL-ADJUSTED VEGETATION INDICES (SAVI) .........................................53
FIGURE 13: SCATTERPLOTS OF CORRELATIONS BETWEEN ABOVEGROUND BIOMASS
(AGB) AND GREEN NDVI (GNDVI) .............................................................................53
FIGURE 14: RELATIONSHIP BETWEEN NDVI LINEAR REGRESSIONS TO
ESTIMATED
AGB AND FIELD‐BASED MEASURED AGB .................................................54
FIGURE 15: RELATIONSHIP BETWEEN SAVI LINEAR REGRESSIONS TO
ESTIMATED
AGB AND FIELD‐BASED MEASURED AGB .................................................55
FIGURE 16: RELATIONSHIP BETWEEN GNDVI LINEAR REGRESSIONS TO
ESTIMATED
AGB AND FIELD‐BASED MEASURED AGB .................................................55
FIGURE 17: THAI BINH AGB MAPPING BASE ON VEGETATION INDICES IN 2018 ...........57
FIGURE 18: THAI BINH AGB MAPPING BASE ON VEGETATION INDICES IN 1998 ...........58
v
LIST OF TABLE
TABLE 1: INSTRUMENT AND SOFTWARE ARE USED .......................................................18
TABLE 2: SATELLITE IMAGES USED IN RESEARCH ........................................................18
TABLE 3: THE BAND DESIGNATIONS FOR LANDSAT 5 THEMATIC MAPPER (TM) AND
LANDSAT 7 ENHANCED THEMATIC MAPPER PLUS (ETM+) ..........................................20
TABLE 4: THE BAND DESIGNATIONS FOR THE LANDSAT 8 SATELLITES ........................21
TABLE 5: WAVELENGTH REGIONS AND DESCRIPTION OF EACH SENTINEL BAND ........22
TABLE 6: LULC ID AND NAMES ....................................................................................30
TABLE 7: WOOD DENSITY FOR EACH SPECIES IN MANGROVE FOREST ACCORDING TO
THE GLOBAL WOOD DENSITY DATABASE ..................................................................... 36
TABLE 8: CLASS NAME AND ASSIGNED CLASS COLOURS .............................................41
TABLE 9: AREA OF LULC FOR YEARS 1998, 2003, 2007, 2013, 2018 ........................... 45
TABLE 10: PERCENT (%) OF LAND COVER IN STUDY AREA ..........................................45
TABLE 11: ACCURACY ASSESSMENT OF THE CLASSIFIED IMAGES IN 1998. ..................47
TABLE 12: ACCURACY ASSESSMENT OF THE CLASSIFIED IMAGES IN 2007 ...................48
TABLE 13: ACCURACY ASSESSMENT OF THE CLASSIFIED IMAGES IN 2003 ...................48
TABLE 14: ACCURACY ASSESSMENT OF THE CLASSIFIED IMAGES IN 2013 ...................49
TABLE 15: ACCURACY ASSESSMENT OF THE CLASSIFIED IMAGES IN 2018 ...................49
TABLE 16: ACCURACY ASSESSMENT OVERALL ............................................................. 50
TABLE 17: RATING CRITERIA OF KAPPA STATISTICS .....................................................50
TABLE 18: SUMMARY OF SIMPLE LINEAR REGRESSION MODELS USING SINGLE
INDEPENDENT VARIABLE................................................................................................ 52
TABLE 19: AGB ACCURACY ASSESSMENT .....................................................................56
TABLE 20: TABLE SHOWING ESTIMATED AGB BY NDVI IN 1998 AND 2018 ................59
vi
LIST OF ABBREVIATIONS
ETM
Enhanced Thematic Mapper
FAO
Food and Agricultural Organization
GIS
Geographic Information System
GPS
Global Positioning System
NDVI
Normalized Difference Vegetation Index
RGB
Red Green Blue
TM
Thematic Mapper
UTM
Universal Transverse Mercator
NIR
Near Infrared
USGS
United States geological survey
MLC
Maximum likelihood classifier
NIR
Near infra-red
RMSE
Root Mean Square Error
AGB
aboveground biomass
GLOVIS
Global Visualization Viewer
AOI
area of interest
SLC
Scan Line Corrector
OLI
Operational Land Imager
vii
CHAPTER 1: INTRODUCTION
1.1 Background
Mangroves are the complex ecosystems that have the unique condition. It has
specific characters of flora and fauna, which live in land and salt water habitats in the
same time between tidal and low tide boundaries. Mangroves are amongst the most
important and productive coastal resources that link terrestrial and marine systems and
provide valuable ecosystem goods and service (Alongi, 2002).They typically dominate
in the coastal zone of low energy tropical and subtropical coastlines. Mangroves not
only importance role in ecosystem but also define an economic resource for the local
communities (Kamal & Phinn, 2011). Mangroves can be stabilizing shorelines and
having devastating impact of natural such as dissipated the incoming wave energy,
trapping sediment in their roots, protecting the land behind, becoming a barrier against
wind. They also provide important ecological and social well-being though ecosystem
services. They provided essential nursery habitat for fish, crabs, and shrimp (Giri,
Pengra, Zhu, Singh, & Tieszen, 2007).
Mangroves forest are the highest biodiversity in all of coastal wetland.
Mangroves plant are salt tolerant species, thrive in water that varies in tonnage and is
rich with nutrients. According Aubreville (1970) ―mangroves‖ or ―mangals‖ are
coastal tropics and found along the sea border, lagoon and river bank where is
submerged in brackish water or cover by salt water in high tide (Puri, Gupta, MeherHomji, & Puri, 1989). Mangroves represented by the concept: mangrove are
community of evergreen trees and shrubs of different mangrove species but they have
the similar about physiological characteristics and their structure adapt to coastal line
habitat and tidal activity, that communities are often growth in tropical and subtropical area (Syed, Hussin, & Weir, 2001). Mangrove forests trap sediments flowing
down rivers and off the land by virtue of their dense root system and this helps
stabilize the coastline and prevents erosion.
Likewise mangroves not only importance role in ecosystem but also define an
economic resource for the local communities (Rönnbäck, 1999). For instance, just the
1
fact that many peoples want to live in coastal regions because of economically and
aesthetically. The resources of coastal zone provide numerous job opportunities and
some peoples come to coastal area for recreation. In the other hand, many pressures
could exert on the coastal zone. Some of these are part of natural operation and the
effects of human-induced by activities. However, there are limits to extent to which
the coastal ecosystem can withstand external assault to its integrity. Pressures
emanating from human activities are particularly threatening.
A major driving force of mangrove forests loss in Southeast Asia and in
Vietnam is the rapid expansion of aquaculture development. In recent years, mangrove
forests have become threatened by development as in Thai Binh, so mangroves have
been lost due to coastal development (Alongi, 2002). Therefore, mapping their
distribution and areal extent in Vietnam and elsewhere is important for their
conservation and management.
Appropriate and cost effective methods are required to reduce the laborious
method of manually calculating for the amount of biomass. Remote Sensing (RS) is
noted for giving a good classification of mangroves. Therefore, using Remote sensing
(RS) and Geographic Information System (GIS) will be an appropriate choice (Sellers
et al., 1995). Christensen (1993) was shown that biomass can be evaluate by Deriving
light interception from spectral reflectance ratio (Christensen & Goudriaan, 1993). The
biomass in a large area can be compute by using remotely sensed satellite data to save
time and money (Tripathi, Soni, Maurya, & Soni, 2010). This research is based on the
integration of RS and GIS in estimating the spatial extent of mangrove and the rate of
change of mangrove in the costal line of Thai Binh province. It also estimate how
much above ground biomass in mangroves in the study area.
1.2 Prior study
Several research work have been carried out in this field of research. Dat (2011)
Monitoring mangrove forest using multi-temporal satellite data in the Northern Coast
of Vietnam (Dat & Yoshino, 2011), Pham Tien Dat (2012) were to analyse the current
status of mangroves using different ALOS sensors in Hai Phong, Vietnam in 2010 and
compare the accuracy of the post satellite image processing of ALOS imagery in
2
mapping mangroves (Pham & Yoshino, 2012). The research about implementation of
mangrove management investigated by the authorities, community or local people has
affected mangrove change in Vietnam (Pham & Yoshino, 2016).
Beland (2006) describes the use of a proposed change detection methodology in
the assessment of mangrove forest alterations caused by aquaculture development, as
well as the effectiveness of the measures taken to mitigate deforestation in the district
of Giao Thuy, Thai Binh Vietnam, between 1986, 1992 and 2001 (Beland, Goita,
Bonn, & Pham, 2006). Mazda (1997) give the demonstrate the usefulness of mangrove
reforestation for coastal protection in Thai Binh province (Mazda, Magi, Kogo, &
Hong, 1997). Nguyen Hai Hoa (2016) was using Landsat imagery and vegetation
indices differencing to detect mangrove change (Hoa).
1.3 Role of remote sensing and GIS in mangrove monitoring
Earth observing by using satellite remote sensing has made it possible to collect
data globally in a relatively short time and for these observations to be continued in the
future. Remote sensing system can record the biological and physical data; therefore
we can use that data for forest inventory and environment monitoring. It could be
support by Global Position System (GPS) in collecting ground data and truth data in
the earth surface (Parkinson, 2003).
A first step towards dealing with important environmental issues is to produce
relevant and up-to-date spatial information that may provide a better understanding of
the problems and form the basis for the identification of suitable strategies for
sustainable development. In this point, Remote Sensing and GIS are potentially can
process the mapping in order to monitor the mangroves (Green, Clark, Mumby,
Edwards, & Ellis, 1998).
Remote sensing is an important substitute for traditional field monitoring for
managing large-scale mangroves (Blasco et al., 1998). Aerial photographs and highresolution satellite images are the main sources of remote sensing data for mangrove
mapping. Satellite data with medium or low resolution and laser scanning data are
other remote sensing data sources that can be used to assess mangrove ecosystems. In
3
the scientific literature, there are a considerable number of studies related to mangrove
forests, remote sensing data and various image-processing algorithms.
Most of the remote sensing studies use high-resolution spatial images, mainly
with pixel sizes of 5 to 100 m. Image processing and imaging algorithms have a
significant impact on the accuracy of mangrove forest maps. Therefore, it is imperative
to identify appropriate sources of data and precise methods for processing mangrove
forests. When applying pixel based classification algorithms, there are some
limitations. Misalignment of mangrove forests, non-mangrove vegetation, urban areas
and even mudflats affect classification accuracy (Gao, 1998).
According Green (1998) Remote-sensing techniques have demonstrated a high
potential to detect, identify, map, and monitor mangrove conditions and changes. Also,
climate change-related remote-sensing studies in coastal zones have increased
drastically in recent years (Green et al., 1998). Remote sensing techniques offer
timely, up-to-date, and relatively accurate information for sustainable and effective
management of wetland vegetation. They also applications in discriminating and
mapping wetland vegetation, and estimating some of the biochemical and biophysical
parameters of wetland vegetation (Adam, Mutanga, & Rugege, 2010).
1.4 Problem Statement
Meanwhile, various ongoing activities will greatly affect to coastal area and
mangrove and then long-term cumulative impacts will become more evident. Coastal
areas are inter-land and seashore interchanges that are unique geologic, ecological, and
biological sites of vital importance for a wide range of terrestrial and marine life forms
including human (Beatley, Brower, & Schwab, 2002). Coastal ecosystems are very
fragile due to the variability of tectonic and terrain processes and variability.
Vietnam's coastal regions are constantly experiencing changes by the impact of
nature as well as human activities. Mangroves is a sensitive ecosystem, which
vulnerable by environmental change include sea level rise and hydrological changes in
coastal areas (Mitra, 2013).Nevertheless, mangroves are under severe threat. High
population growth, and migration into coastal areas, hasled to an increased demand for
4
its services. The situation is further exacerbated by weak governance, poor
planningand uncoordinated economic development in the coastal zone. Globally more
than 3.6 million hectares of Mangroveshas been lost since 1980. In Vietnam, it is
estimated that the number of mangrove forest was about 400,000 hectares in early 20th
century. However, this number declined dramatically over 50 years (T. Q. Vo,
Kuenzer, & Oppelt, 2015).
Since Remote Sensing (RS) technology provides data from which updated land
cover information cheaply and also it can be extracted efficiently. Thus, land use
change detection has become a major application of remote sensing data and can apply
to identify the changing in mangrove in Vietnam (Muchoney & Haack, 1994).
Maintaining mangrove ecosystem services and a healthy environment is one of
the priority goals of the Vietnam government. Although many studies about mangrove
forest have been done in Thai Binh province to understand the valuable of this
ecosystems, but some knowledge gaps still exist. In particular, baseline mangrove data
need to be updated, in addition to providing an indication of the species that are
vulnerable, death, or changes to drainage due to urban and rural developments.
Therefore, it is necessary to monitor mangrove forest, and mapping of
mangroves is important in order to support coastal zone management and planning
programs.
1.5 Research Objectives
The goals of this research is mapping out mangrove forest from 1998 to 2018. It
further aims at determining the amount of above-ground biomass in mangrove using
allometric equations and Remote Sensing.
The primary objective can be subdivided into following tasks:
Mapping mangrove forest and
using RS and GIS and assess of
mangrove forest change using Remote Sensing
Estimate amount of aboveground biomass by different vegetation index
within study area.
Assessing the accuracy of each AGB estimation model.
5
Estimate the changing of aboveground biomass from 1998 to 2018
within study area.
1.6 Organization of the Thesis
The content of the research is structured under the following chapters:
Chapter I: Chapter 1 introduces the research work. It highlights on prior
research work based on mangrove above ground biomass. The objectives of the
research is highlighted within this chapter. This chapter also show the problem
statement and research question.
Chapter II: Chapter 2 gives a theoretical and conceptual of mangrove. Literature
review on mangroves and further talks about climate change, effect of climate change
to mangrove. This chapter further researches on the various RS methods that have
been employed in similar study.
Chapter III: Chapter 3 gives the method about establish survey pots, collecting
data, analysis data, estimate above ground biomass and change detection.
Chapter IV: Chapter 4 shows the results obtained from the research. Analysis
and discussions are carried out on the result.
The conclusions and recommendations drawn from the research are presented
in chapter five.
6
CHAPTER 2: LITERATURE REVIEW
2.1 Mangroves
Mangrove forest have been described by many authors over time and the
literature (for example (M. Spalding, Kainuma, & Collins, 2010), (FAO, 2007)).
Mangrove forests literally live in two worlds at once. Mangroves are comprised of
salt-tolerant tree or shrub species growing in the intertidal areas and estuary mouths
between land and sea. They thrive in intertidal region (includes: sheltered coastlines,
shallow-water lagoons, estuaries, rivers or deltas) (MAP, 2013). Mangroves are found
in the tropical and subtropical regions of the world between approximately 30°N and
30°S latitude (FAO, 2007). The total species of mangroves forest are 54-75 species,
which are found only in the intertidal zone of coasts. There species are highly adapted
to intertidal environment, capable of expelling salt, allowing mangroves to thrive in
saline waters and soils. Mangroves are found worldwide, but the greatest species
diversity is in Southeast Asia (MAP, 2013).
The total area of mangroves in the year 2000 was 137,760 km2 in 118 countries
and territories in the tropical and subtropical regions of the world. The largest extent of
mangroves is found in Asia (42%) followed by Africa (20%), North and Central
America (15%), Oceania (12%) and South America (11%). Approximately 75%of
mangroves are concentrated in just 15 countries (Giri et al., 2011)
In recent years, the area and the quality of mangrove forest was decreased in
Thai Binh province, especially in in the period 1995 – 2000 because the changing land
use from mangrove forest to aquaculture farm. The land and forest area in coastal line
of Thai Binh province are 9,167 ha therein forest area is 3,709 ha and non-forest area
is 5,908 ha. In the low tide area, the percent of sand in soil from 83.64% to 86.57%
some area can reached 98.32%. In the high tired area, the rate of sand in soil from
39.19% to 43.69% (Đỗ Quý & Bùi Thế, 2018).
2.2 Physical factors affecting the growth of Mangroves
There are some important biological and abiotic factor influence to develop of
mangroves. That factor formed specific characteristic of mangroves forest. They include:
7
2.2.1 Climatic factor
Mangrove ecosystems are threatened by climate change. The state of
knowledge of mangrove vulnerability and responses to predicted climate change and
consider adaptation options. All the climate change outcomes, relative sea-level rise
may be the greatest threat to mangroves. Most mangrove sediment surface elevations
are not keeping pace with sea-level rise, although longer-term studies from a larger
number of regions are needed. Rising sea-level will have the greatest impact on
mangroves experiencing net lowering in sediment elevation, where there is limited
area for landward migration (Gilman, Ellison, Duke, & Field, 2008).
2.2.2 Temperature
The mean annual temperature in the South coastal is about 270C and decreases
northwards to about 210C in the North coastal. Cold air was brought by the northeast
monsoon to the north, there by affecting the growth and composition of mangroves in
this region (Lugo & Patterson-Zucca, 1977).Mangrove species are largest size and the
most abundant in the equatorial and subtropical areas, where annual temperatures are
high and narrow temperature range. The appropriate temperature and about 250C-300C
as in the southern provinces of Vietnam. The number of mangrove species and
mangrove forest tree in the north is generally lower or smaller than in the south of
Vietnam, partly because of the low temperature in winter and the high temperatures in
summer. High temperatures or sudden fluctuations in temperature, can also have an
adverse effect on mangrove.
2.2.3 Precipitation
The distribution and growth of tropical forest are mostly in equatorial areas
where the rainfall is high (about 1800-2500mm/year). Precipitation is the main factor
for the distribution of mangroves forest in different tired areas (Eslami-Andargoli,
Dale, Sipe, & Chaseling, 2009). Mangroves require a certain amount of fresh water for
optimum growth, even though they are salt tolerant species. Rain regulates salt
concentration in soil and plants and provides an extra source of fresh water, in addition
to river water, for mangroves and this favours their physiological processes. In
8
Vietnam, there are about 100 rainy days per year with average rainfall of 1.500 to
2.000 mm and air humidity of less than 80%.
Southwest monsoons from the ocean bring heavy rain to Vietnam during the
summer months. Consequently, the most dense mangrove forest are found in this
region. For instance, mangroves flourish at Ca Mau cape, where rainfall are 2000-2200
mm annually with 120-150 rainy days per year. On the other hand, mangroves are
sparse along the small estuaries of Khanh Hoa coast where they receive less than 1000
mm/years ("AccuWeather," 2018)
2.2.4 Waves and tidal range
Even though mangrove can survey and develop with waves and tide activity but
mangrove propagules and seedlings require a low energy habitat. Therefore,
mangroves often grow in sheltered shores areas. Surface slope and tidal range will
determine the area and distribution of mangrove, with large tide range and large tide
area mangrove will be larger (De Vos, 2004).
2.2.5 Salinity conditions
Survival declined with decrease in irradiance, except where very low salinities
apparently induced sensitivity to high irradiance in vulnerable species. Survival in
understorey shade was lower in the high than low salinity environment. However,
these apparent effects of salinity were eliminated by reducing below-ground
interactions with adult trees (Ball, 2002). For example, Excoecaria agallochaspecies
was distribute in low salinity condition area (smaller than 5psu), if salinity from 5-15
will be reduce the rooting growth of seed, when the salinity higher than 15psu the seed
will not rooted. Salinity also effect to the ability of leaves growing and leave area, high
salinity will make lower in mangrove height and leave area will be smaller. High
salinity also decrease the longevity of leave and reduce the ability of leave born, it lead
to mangrove will dead in long term (Chen & Ye, 2014).
2.2.6 Soil structure
Soil condition is also effect to the distribution of dominate mangrove species
(McKee, 1993). The condition for develop mangrove in the area with substrate,
9
waterlogged, anaerobic as sediments, sand and coarse sand, peat soil or coral reef.
However, the best condition for mangrove forest are living in silty clay soils (Hong &
San, 1993). Mangroves soil is formed by alluvial, sediment from rivers and sea with
rich of nutrients such as magnesium, sodium. The soil physical and chemical
characteristic depend on the sources of alluvial and sediments, therefore it effect to the
distribution of mangrove forest (Tam & Wong, 1996).
2.3 The Application of Remote Sensing in monitoring Mangroves
In recent year, many researches have shown that remote sensing are important
tool for mangrove forest research with low cost in a large scale (Giri et al., 2011; Giri
et al., 2007; Winarso et al., 2017). Remote sensing data often use for change detection
and monitor mangroves forest. Remote sensing is science that collect information
about object, area or a phenomenon in the world though analysis the data obtained by
using device that is not exposed to the object, area or phenomenon under investigation
as satellite or radar. Remote sensing has been identified as a cost-effective method
using in a large area and even a geographic areas. They have a great effect in
monitoring the change of vegetation especially in forest sector research (Lillesand,
Kiefer, & Chipman, 2014).
Data on vegetation cover change is important with planners for monitoring
effect of vegetation change in local level or in the world. That data are valuable for
resource management and planning for evaluate the changing of vegetation and
anticipate changes in the future. According to Macleod et al (1998) four important
aspects of change detection in natural resource monitoring: detecting the change have
occurred, determining the essence of change, measuring the change and assessing the
spatial pattern of change (Macleod & Congalton, 1998).
The applications of RS and GIS provide various guidelines for the sustainability
of management of tropical coastal ecosystems, including mangroves. It shows that
remote sensing technology can be integrated in long-term studies combining the past
and present to make predictions about the future and, if necessary they can show the
action to prevent degradation of natural resources. Especially, they have been used to
study mangroves (Ramachandra & Ganapathy, 2007). For the large mangroves forest
10
study, high-resolution satellite image can be show the forest structure characteristic.
These results can be used to predict future changes in forest structure. (DahdouhGuebas, 2001).
The essence of using remote sensing data to detect mangrove forest cover
changing is detection change in radiance value, which can recognize through remotely
sensed. Nowadays, the technique of using remote sensing images to detect change has
grown very rapidly following the development of computers. Coppin et al (1996)
summarized 10 types of techniques used to detect the change they include: Monotemporal change delineation, delta or post classification comparisons, multidimensional temporal feature space analysis, and composite analysis. Others are image
differencing, multi-temporal linear data transformation, change vector analysis, image
regression, multi-temporal biomass index NDVI, background subtraction, and image
rationing (Coppin & Bauer, 1996)
2.3.1 Aerial photography
Aerial photography (AP) and high-resolution image system as Landsat and
sentinel are the most common approaches to mangrove remote sensing (Newton et al.,
2009). AP has been widely used in mangrove mapping and assessment. AP can be
more cost effective over small areas than satellite remote sensing. Anderson (1997)
found aerial photographs still useful in mapping wetlands. Furthermore, aerial
photographs are relatively cheap to analyse especially if the areas covered are small,
such as mangroves and the AP can provide a quick assessment to detect the change
(M. D. Spalding, Blasco, & Field, 1997)
In aerial mapping, many limitations that can affect the outcome of the product.
The major limitation are the limited areal extent and relatively high costs of data for
large geographic areas. Some limitation related to the sensor, the airborne platform,
the environment, the interpreter user of the information (Witenstein, 1955).
2.3.2 Satellite imagery
The vast majority of mangrove remote sensing studies have employed highresolution satellite imagery such as Landsat (MSS, TM, or ETM+), SPOT (HVR,
11
HRVIR, or HRG), ASTER, or IRS (1C or 1D).The techniques used to detect and
classify mangroves forest are unsupervised classification techniques such as the
ISODATA approach, supervised classification techniques such as the maximum
likelihood classification (MLC), mahalanobis distance, or other techniques commonly
available
in
commercial
image
processing
software,
or
a
hybrid
unsupervised/supervised classification scheme (Wilkinson, 2005). The new techniques
can improve accuracy of mangrove classification, detect individual species, and
provide reliable estimates of structure such as leaf area, canopy height, and biomass
(Heumann, 2011)
2.3.3 GIS, Remote Sensing and Change Detection
The advantage of creation of thematic map using Remote Sensing and
Geographical Information Systems (GIS) is effective and efficiency. Both Remote
Sensing and GIS techniques are important fields of study particularly in the three
major application that are in area of urban growth studies, area of land use change
detection analysis, and vegetation studies (NDVI). In this study GIS application, plays
significant role in change detection of mangrove forest studies that involves the use of
GIS software of both remote sensing and GIS techniques with powerful tools that has
the capacities of incorporating different data set particularly in this study.
Definition of Remote sensing refers to Lillesand dan Kiefer (2014) that is the
science and art of obtaining information (acquisition) about objects, regions or
phenomena by analysing the data obtained by without direct contact with the object,
area or phenomenon which being studied (Lillesand et al., 2014). As an information
that can analyse, remote sensing can provide a variable source of data updated and
land cover information.
2.3.4 Mangrove biomass estimation by Remote Sensing and GIS
While biomass derived from field data measurements is the most accurate, it is
not a practical approach for broad-scale assessments. This is where Remote Sensing
has a key advantage. It can provide data over large areas at a fraction of the cost
associated with extensive sampling and enables access to inaccessible places. Data
12
from Remote Sensing satellites are available at various scales, from local to global,
and from a number of different platforms (Kumar, Sinha, Taylor, & Alqurashi, 2015).
Estimates of forest biomass can provide valuable insights into the carbon
storage and cycling in forests (Litton, Raich, & Ryan, 2007). Traditional remote
sensing approaches can provide important information for monitoring change of
mangroves in area. Recent advances in satellite sensors and techniques can potentially
improve the accuracy of mangrove classifications, provide reliable estimates of
structure such as leaf area, canopy height, detect individual species, and biomass
(Heumann, 2011). Remote sensing-based methods of aboveground biomass (AGB)
estimation in forest ecosystems have gained increased attention, and substantial
research has been conducted in the past three decades (Lu et al., 2016). Proisy, (2007)
using Fourier-based textural ordination to estimate mangrove forest biomass from very
high-resolution (VHR) IKONOS images. The FOTO method computes texture indices
of canopy grain by performing a standardized principal component analysis (PCA) on
the Fourier spectra obtained. In addition, a multiple linear regression based on the
three main textural indices yielded accurate predictions of mangrove total
aboveground biomass (Proisy, Couteron, & Fromard, 2007).
According to Simard, (2006) the application of the elevation data from the
Shuttle Radar Topography Mission (SRTM), which was calibrated using airborne
LIDAR data and a high resolution USGS digital elevation model (DEM) for produced
a landscape scale map of mean tree height in mangrove forests. And then, he using
field data to derive a relationship between mean forest stand height and biomass in
order to map the spatial distribution of standing biomass of mangroves by applied
linear regression (Simard et al., 2006).
Fatoyinbo, (2008) was determine the mean tree height spatial distribution and
biomass of mangrove forests using Landsat ETM+ and Shuttle Radar Topography
Mission (SRTM) data. The SRTM data were calibrated using the Landsat derived
land‐cover map and height calibration equations. Stand‐specific canopy height‐
biomass allometric equations developed from field measurements and published
height‐biomass equations were used to calculate aboveground biomass of the
13
mangrove forests on a landscape scale. (Fatoyinbo, Simard, Washington‐Allen, &
Shugart, 2008)
Lu, (2016) was provides a survey of current biomass estimation methods using
remote sensing data and discusses four critical issues – collection of field-based
biomass reference data, extraction and selection of suitable variables from remote
sensing data, identification of proper algorithms to develop biomass estimation
models, and uncertainty analysis to refine the estimation procedure. Additionally, he
also discuss the impacts of scales on biomass estimation performance and describe a
general biomass estimation procedure. Although optical sensor and radar data have
been primary sources for AGB estimation, data saturation is an important factor
resulting in estimation uncertainty (Lu et al., 2016)
14
CHAPTER 3: METHOD
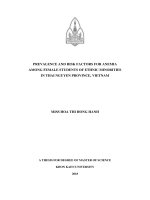
3.1 Study area
The study area includes the province of Thai Binh, located in northeastern
coastal Viet Nam.
3.1.1 Geography location
Thai Binh is an eastern coastal province in the Red River Delta region; the
distance with Ha Noi capital is 110 km, with Hai Phong city 70 km and with Nam
Dinh city 18 km. This province is a coastal province in the Red River Delta region.
The North part border the provinces of Hai Duong, Hung Yen and Hai Phong city ;
The South part border Nam Dinh province ; The Western part border Ha Nam
province and the Eastern part border Gulf of Tonkin. They being a delta province with
flat terrain and slope of below 1 percent; the terrain of Thai Binh province runs
downward from the North to the South and varies its height of 1 to 2m to the sea level.
In administrative border, over natural land area of province, nowadays there is above
16 thousands ha of Thai Thuy and Tien Hai district‘s coastal land was measured, today
is being invested exploited to aquaculture and afforest, in there, it inserted aquaculture
over 4.000 ha and planted 7.000 ha salt-marsh forest.
Figure 1: Study area
15
3.1.2 Climate
This study focused on the Thai Binh province, Vietnam. The province is lie in
tropical monsoon area, big heat radiation, create high temperature. Average
temperature from 23oC to 24oC this temperature are good for the development of
mangrove. Thermal amplitude in season is 13oC with the temperature of 3 month are
lower than 20oC, in January and February the lowest temperature can be lower than
5oC. This factor will be effect to the development of mangrove (Cúc, 2013).
Average rainfall in year from 1.500 millimetre to 1.900 mm in a year maximum
rainfall in August and September, this precipitation is lower than the suitable rainfall
for mangrove (Yinxia, 1995). In winter the precipitation are lower than 30 mm/month;
average moisture is 85% - 90%.
3.1.3 Tidal regime
The plain is affected by diurnal tide of Tonkin gulf with tidal range of
approximately 4m. In a day, there is one high tide and one low tide and in one month,
one spring tide and one neap tide occur. The tidal range tends to decrease slightly from
north to south as well sea to rivers inland but not so much due to short distance
between two ends of estuaries. The highest water level recorded at Hon Dau (Hai
Phong) was 2,66m above MSL (October, 1955) and lowest level was - 1.62m
(January, 1969). (Cat & Duong, 2006).
3.1.4 Mangroves forest in Thai Binh Province
3.1.4.1 Status mangroves in Thai Binh Province
The area of mangrove forest in Thai Binh province are low compare with total
area of province but they have important roles in food chain, protecting coastal area,
economic value for local people. Most of mangrove forest in study site are plantation
mangrove. The percent of natural mangrove area low and they dispersed distribution.
Almost mangrove are planted by funding from international organizations, just a small
area planted by funding of Vietnam government. (Cúc, 2013)
Thai Binh mangrove forest distributed in the coastal area of 10 communities
16
belong to Thai Thuy and Tien Hai district. The mangrove area in Thai Thuy district is
2000ha and in Tien Hai district are 1400 ha. (Thụy et al., 2016)
Thai Binh coastal area have 12 species include: Acrostichum aureum,Acathus
ebracteatus,Acathus ilicifolus , Sensuvium portulacastrum, Avicennia marina,
Lumnitzera
racemose,
Derris
trifoliata,
Excoecaria
agallaocha,
Aegiceras
corniculatum, Bruguiera gymnorrohiz, Kandelia obovate, Rhizophora stylosa,
Sonneratia caseolaris (Cúc, 2013).
3.1.4.2 Effect of climate to mangroves in mangroves forest
There are some climate factor that effect to the development of mangrove forest
are:
Firstly, the effect of low temperature because of cold winter: The winter season
from December to February of next year. The lowest temperature often occur in
January with temperature lower than 150C and absolute minimum temperature < 50C.
Mangrove have low increasing rate in this season, some mangrove was dead because
of low temperature.
Secondly, the effect of storms and tropical depressions: Mangrove in Thai Binh
are often effect by the activities of storms and tropical depressions. When the storm
landed in the mainland, wind speed can reach 40-50 m/s, waves 5-7 m high, especially
when tides, often cause very serious consequences: broke mangrove tree, change the
salinity, seedling are submerged,…
3.2 Data collection
In this study, we collected two type of data field survey data and satellite image
data to detect mangrove change and estimate above ground biomass.
3.2.1 Instruments and software
The following list of instruments used for the fieldwork and the software used
for this study (see Table 1)
17
Table 1: Instrument and Software are used
No.
1
2
3
4
Type
Instrument
Instrument
Instrument
Name
GPS: Garmin 7 channel
Diameter Tape
Measuring tape 50 meter
Field Datasheet
5
Software
Arc GIS 10.2
6
7
Software
Software
MS Word
MS Excel
8
Software
Envi 5.3
9
Software
SPSS 23
Utility
Collecting ground truth coordinates
Diameter Measurement
Length of measurement
Recording field data
Image processing and data analysis, Spatial
analysis Principal Component Analysis
For documental
Data analysis
Image pre-processing and data analysis,
classification data.
Data analysis
3.2.2 Satellite image collection
In this study, satellite image were obtained from the United States Geological
survey (USGS) Global Visualization Viewer (GLOVIS) free of charge include Landsat
image and sentinel image. Image obtained are dated 1998, 2003, 2007, 2013 and 2018
as described in Table 2. Landsat image was obtained from Landsat constellation of
satellites that each had a resolution of 30 meters. The area of interest (AOI) for this
study is located within the dataset of WRS (World Reference System) path 126 and
Row 46 with correction level 1-T. The sensors on board the Landsat Satellites records
the surface reflectance of electromagnetic (EM) radiation from the sun in seven
discreet bands (Table 3 and Table 4).
Sentinel 2 image was obtained from a constellation of two satellites, both
orbiting Earth at an altitude of 786 km and they had a resolution of 10 meters. The
research was based on a decadal analysis of images but due to lack of clear images of
cloud cover less than 10%. SENTINEL-2 data are acquired on 13 spectral bands in the
VNIR and SWIR. The satellite image in this study was used in this research describe
below:
Table 2: Satellite Images Used in Research
No
1
Date of
image
acquisition
Satellite
Resolution
Path/row
02/11/1998
LT05_L1TP_126046_19980929_20161221_01_T
30x30
126/46
18