- Trang chủ >>
- Đại cương >>
- Kinh tế vi mô
Supply, demand, and government policies (KINH tế VI mô SLIDE)
Bạn đang xem bản rút gọn của tài liệu. Xem và tải ngay bản đầy đủ của tài liệu tại đây (380.22 KB, 29 trang )
Lecture 3
Supply, Demand, and
Government Policies
MICROECONOMICS
Overview
1.
2.
Controls on prices
Price ceiling
Price floor
Taxes
• In a “free”, unregulated market system,
market forces establish equilibrium prices and
quantities.
• While equilibrium conditions may be efficient
it may be true that not everyone, i.e. buyer or
seller are satisfied.
• Hence, market controls!
1.Controls on Prices
Enacted when policy-makers believe that the
market price is unfair to buyers and sellers.
Result in government policies, i.e. price
ceilings and floors.
1.1 How price ceilings affect market outcomes
Price ceiling: Legal maximum on the price at which
a good can be sold
– Not binding
• Above the equilibrium price
• No effect
– Binding constraint
• Below the equilibrium price
• Shortage: Sellers must ration the scarce goods
– The rationing mechanisms – not desirable
5
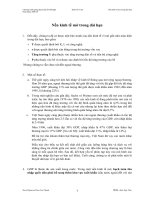
Figure 1
A market with a price ceiling
Price of
Ice
Cream
Cones
(a) A price ceiling that is not binding
Supply
Price ceiling
$4
Price of
Ice
Cream
Cones
Equilibrium
price
Supply
Equilibrium
price
$3
3
(b) A price ceiling that is binding
Price ceiling
2
Demand
Shortage
Quantity
supplied
Equilibrium
quantity
0
100
Quantity of Ice-Cream Cones
0
Demand
Quantity
demanded
125
75
Quantity of Ice-Cream Cones
6
Lines at the gas pump
• 1973, OPEC raised the price of crude oil
– Reduced the supply of gasoline
– Long lines at gas stations
• What was responsible for the long gas lines?
– OPEC: created shortage of gasoline
– U.S. government regulations: price ceiling on gasoline
• Before OPEC raised the price of crude oil
– Equilibrium price - below price ceiling: no effect
• When the price of crude oil rose
– Reduced the supply of gasoline
– Equilibrium price – above price ceiling: shortage
7
Figure 2
The market for gasoline with a price ceiling
(a) The price ceiling on gasoline
is not binding
Price of
(b) The price ceiling on gasoline
is binding
Price of
Gasoline
Gasoline
S2
1. Initially, the
price ceiling is
not binding …
Supply, S1
Price ceiling
S1
P2
Price ceiling
3…the price
ceiling becomes
binding…
P1
P1
4. …resulting
in a shortage
Demand
Demand
0
Q1
Quantity of Gasoline
2…but when
supply falls…
0
QS
QD
Q1
Quantity of Gasoline
Panel (a) shows the gasoline market when the price ceiling is not binding because the equilibrium price,
P1, is below the ceiling. Panel (b) shows the gasoline market after an increase in the price of crude oil (an
input into making gasoline) shifts the supply curve to the left from S 1 to S2. In an unregulated market, the
price would have risen from P1 to P2. The price ceiling, however, prevents this from happening. At the
binding price ceiling, consumers are willing to buy QD, but producers of gasoline are willing to sell only QS.
8
The difference between quantity demanded and quantity supplied, Q D – QS, measures the gasoline
Rent control in the short run
and the long run
• Price ceiling: rent control
– Local government - ceiling on rents
– Goal: help the poor (housing more affordable)
– Critique: highly inefficient way to help the poor raise
their standard of living
9
Rent control in the short run
and the long run
• People respond to incentives
– Free markets
• Landlords try to keep their buildings clean and safe
• Higher prices
– Rent control – shortages & waiting lists
• Landlords lose their incentive to respond to tenants’
concerns
– Tenants get lower rents & lower-quality housing.
10
1.2 How price floors affect market outcomes
Price floor: Legal minimum on the price at which a
good can be sold
• Not binding
– Below the equilibrium price
– No effect
• Binding constraint
– Above the equilibrium price
– Surplus
– Some seller are unable to sell what they want
» The rationing mechanisms – not desirable
11
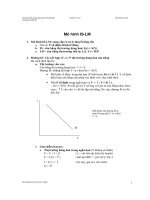
Figure 4
A market with a price floor
Price of
Ice
Cream
Cone
(a) A price floor that is not binding
Supply
Price of
Ice
Cream
Cone
$4
(b) A price floor that is binding
Surplus
Supply
Price floor
3
$3
Equilibrium
price
2
Equilibrium
price
Price floor
Demand
Demand
Quantity
demanded
Equilibrium
quantity
0
100
Quantity of Ice-Cream Cones
0
Quantity
supplied
120
80
Quantity of Ice-Cream Cones
12
The minimum wage
• Price floor: minimum wage
– Lowest price for labor that any employer may pay
• (Dân trí) Chính phủ vừa quy định mức lương tối thiểu mới áp
dụng trả cơng đối với người lao động. Theo đó, mức cao nhất
trong các tổ chức doanh nghiệp Việt Nam là 980.000
đồng/tháng (nghị định 97/2009/NĐ-CP) ; trong các doanh
nghiệp có vốn đầu tư nước ngồi là 1.340.000 đồng/tháng.
(Nghị định 98/2009/NĐ-CP )
• Quy định có hiệu lực từ 1/1/2010.
13
The minimum wage
• Market for labor
– Workers - supply of labor
– Firms – demand for labor
• If minimum wage – above equilibrium
– Unemployment
– Higher income - workers who have jobs
– Lower income - workers who cannot find jobs
14
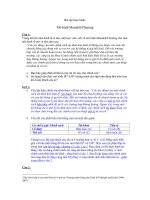
Figure 5
How the minimum wage affects the labor
market
(a) A free labor market
(b) A Labor Market with a
Wage
Binding Minimum Wage
Wage
Labor
supply
Labor
supply
Minimum
wage
Equilibrium
wage
0
Labor surplus
(unemployment)
Labor
demand
Labor
demand
Equilibrium
employment
Quantity
of Labor
0
Quantity
demanded
Quantity Quantity
supplied of Labor
15
The minimum wage
• Impact of the minimum wage
– Workers with high skills and much experience
• Not affected: Equilibrium wages - above the minimum
• Minimum wage - not binding
– Teenage labor – least skilled and least experienced
• Low equilibrium wages
• Willing to accept a lower wage in exchange for on-the-job
training
• Minimum wage – binding
16
1.3 Evaluating price controls
• Markets are usually a good way to organize
economic activity
• Economists usually oppose price ceilings
and price floors
• Prices – coordinate economic activity
17
1.3 Evaluating price controls
• Governments can sometimes improve market
outcomes by price controls - because of
unfair market outcome
– Aimed at helping the poor
– Often hurt those they are trying to help
– Other ways of helping those in need
• Rent subsidies
• Wage subsidies
18
2. Taxes
• Tax incidence
– Manner in which the burden of a tax is shared
among participants in a market
• Tax polices
– Taxes on sellers
– Taxes on buyers
19
2.1 How taxes on sellers affect market outcomes
• Immediate impact on sellers
– Shift in supply
– Supply curve shifts left
– Higher equilibrium price
– Lower equilibrium quantity
– The tax – reduces the size of the market
Figure 6
A tax on sellers
Price of
Ice-Cream
Cone
Price
buyers
pay
Price
without
tax
Equilibrium with tax
S2
S1
A tax on sellers
shifts the supply
curve upward
by the size of
the tax ($0.50).
$3.30
Tax
($0.50)
3.00
Equilibrium without tax
2.80
Price
sellers
receive
Demand, D1
0
90
100
Quantity of
Ice-Cream Cones
When a tax of $0.50 is levied on sellers, the supply curve shifts up by $0.50 from S1 to S2. The
equilibrium quantity falls from 100 to 90 cones. The price that buyers pay rises from $3.00 to
$3.30. The price that sellers receive (after paying the tax) falls from $3.00 to $2.80. Even though
21
the tax is levied on sellers, buyers and sellers share the burden of the tax.
2.1 How taxes on sellers affect market outcomes
Taxes discourage market activity
• Smaller quantity sold
• Buyers and sellers share the burden of tax
• Buyers pay more: Worse off
• Sellers receive less
– Get the higher price but pay the tax
– Overall: effective price fall
– Worse off
22
2.2 How taxes on buyers affect market outcomes
Initial impact on the demand
– Demand curve shifts left
– Lower equilibrium price
– Lower equilibrium quantity
– The tax – reduces the size of the market
23
Figure 7
A tax on buyers
Price of
Ice-Cream
Cone
Price
buyers
pay
Price
without
tax
Equilibrium with tax
Supply, S1
Equilibrium without tax
$3.30
A tax on buyers
shifts the demand
curve downward
by the size of
the tax ($0.50).
Tax
($0.50)
3.00
2.80
Price
sellers
receive
D2
0
90
100
D1
Quantity of
Ice-Cream Cones
When a tax of $0.50 is levied on buyers, the demand curve shifts down by $0.50 from D1 to D2.
The equilibrium quantity falls from 100 to 90 cones. The price that sellers receive falls from $3.00
to $2.80. The price that buyers pay (including the tax) rises from $3.00 to $3.30. Even though the
24
tax is levied on buyers, buyers and sellers share the burden of the tax.
2.2 How taxes on buyers affect market outcomes
– Buyers and sellers share the burden of the tax
– Sellers get a lower price
• Worse off
– Buyers pay a lower market price
• Effective price (with tax) rises
• Worse off
• Taxes levied on sellers and taxes levied on
buyers are equivalent
25