- Trang chủ >>
- Đại cương >>
- Kinh tế vi mô
The theories of consumer behavior (KINH tế VI mô SLIDE)
Bạn đang xem bản rút gọn của tài liệu. Xem và tải ngay bản đầy đủ của tài liệu tại đây (275.36 KB, 17 trang )
Chapter
4
The Theories of
Consumer Behavior
MICROECONOMICS
Overview
Chapter
Theories of consumer behavior
Explanation of how consumers allocate
income to purchase different goods and
services (market basket)
Utility Theory
Theory of Consumer Choice
Three steps:
1. Consumer Preference
2. Budget Constraint
3. Given preferences and limited incomes, what
amount and type of goods will be purchased?
4
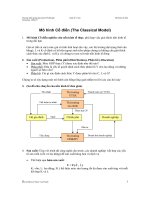
1. Utility Theory
• Utility is the satisfaction or pleasure that a
consumer gets from consuming a given bundle
of goods or service (market basket)
E.g. Utility for coffee
Number of
cups
Utility
0
1
2
3
4
5
0
6
10
13
15
16
Utility
a numerical indicator of a person’s satisfaction
If one item is preferred to some alternative, the
utility from the item is greater than the alternative.
Actual unit of measurement for utility is not
important (ordinal, not cardinal, ranking is sufficient)
– Consumers try to obtain the largest possible total
satisfaction (utility) from the market basket that they buy
with their incomes.
Utility Function
• Formula that assigns level of utility to individual
market baskets
– Baskets of X and Y
U = f (X; Y)
E.g.: Baskets (X-Coffee; Y-Sweets)
U = X.Y
or
U = X1/2.Y1/2
• Consumer’s purpose: maximizing total utility
Umax
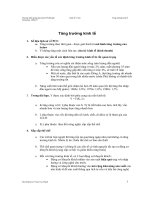
Marginal Utility (MU)
• MU measures additional satisfaction
obtained from consuming 1 additional unit of
goods or service.
– How much happier is individual from consuming
one more unit of coffee
• The change in total utility due to a one-unit
change in the quantity of a good or service
U
MU
Q
Marginal utility -MU
Number
of cups
Utility
MU
0
0
0
1
6
6
2
10
4
3
13
3
4
15
2
5
16
1
Observation: Marginal
Utility is diminishing as
consumption increase.
Marginal utility
Principle of Diminishing marginal utility: As
more good is consumed, additional utility
consumer gains will be smaller and smaller.
Note: total utility will continue to increase
since consumer makes choices that make
them happier.
Application 1
• Diminishing marginal utility and demand curve
• To a consumer, the larger marginal utility, the higher
willingness to pay.
• The smaller MU, the lower willingness to pay.
The diminishing marginal utility explains the slope
downward demand curve.
Willingness to Pay:
The maximum price that a buyer is willing and able to pay for a
good.
Measures how much the buyer values the good or service.
Application 2
• Diminishing marginal utility and Consumer
surplus
– Consumer Surplus: the maximum amount a
consumer will be willing to pay for a good
depends upon the expected utility (benefits) of
that good.
– CS = MUx – Px
– A lower market price will increase consumer
surplus
– A higher market price will reduce consumer
surplus
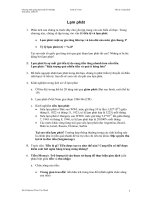
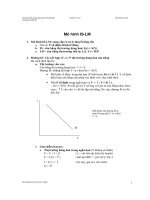
Consumer Surplus: Mathematically
Maximum Price = $11
Market Price = $6
Quantity Purchased = 6
Assume: Price drops $1 for every additional
unit sold.
Consumer Surplus = $15
$51 - $36 = $15
($11+$10+$9+$8+$7+$6) - ($6 x 6) = $15
$11
$10
$9
$8
$7
Market
Price
$6
D
1
2
3
4
5
6
Quantity Purchased
P
$11
$10
Total Consumer
Benefits
$9
$8
$7
$6
D
1
2
3
4
5
6
Q
P
$11
$10
$9
$8
Consumer’s
Expense
$7
$6
D
1
2
3
4
5
6
Q
P
Consumer Benefit
-Consumer Expense
CONSUMER SURPLUS!
$11
$10
$9
$8
$51 - $36 =
$15
$7
$6
D
1
2
3
4
5
6
Q
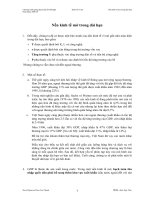
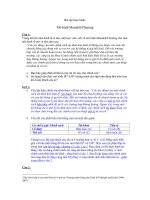
Consumer Surplus: Graphical
S
Pmax
Consumer
Surplus
PE
D
QE