- Trang chủ >>
- Đại cương >>
- Kinh tế vi mô
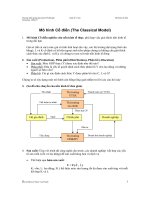
The market forces of supply and demand (KINH tế VI mô SLIDE)
Bạn đang xem bản rút gọn của tài liệu. Xem và tải ngay bản đầy đủ của tài liệu tại đây (332.37 KB, 46 trang )
Lecture 2
The Market Forces of
Supply and Demand
MICROECONOMICS
Overview
Market and Competition
Demand
Supply
Equilibrium
Price and Resource Allocation
Market Forces - Supply & Demand
Supply and Demand are the two words that
economists use most often.
Supply and Demand are the forces that
make market economies work!
Modern microeconomics is about supply,
demand, and market equilibrium.
Markets and Competition
Market
A group
of buyers and sellers of a particular
good or service
Can be highly organized
E.g.: agricultural commodities
Can be less organized
E.g.: ice cream
Buyers determine demand...
Sellers determine supply...
Market: any institution, mechanism, or
arrangement which facilitates exchange.
4
Market Structures
Perfectly Competitive:
Homogeneous Products
Buyers and Sellers are Price Takers
Monopoly:
One Seller, controls price
Oligopoly:
Few Sellers, not aggressive competition
Monopolistic Competition:
Many Sellers, differentiated products
Monopsony:
Only one buyer.
Quick Quiz!
What is a market?
Identify two characteristics of
a perfectly competitive
market.
Identify examples of noncompetitive markets.
Overview
Market
and Competition
Demand
Supply
Equilibrium
Price and Resource Allocation
Demand
Quantity demanded:
Amount
of a good
Buyers are willing and able to purchase
Law of demand
Other things equal
When the price of the good rises, quantity
demanded of a good falls
8
Demand
Relationship between Price of a good (P) and
Quantity demanded (QD) can be shown:
Demand schedule - a table:
a table that shows the quantity demanded at
each price
Demand curve - a graph:
illustrates how the quantity demanded of the
good changes as its price varies.
slopes downward.
Demand function:
QD= f (P)
9
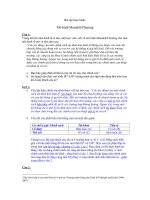
Figure 1
Catherine’s demand schedule and demand
Price of
curve
Ice-Cream
Cones
$3.00
Price of
Ice-cream cone
Quantity of
Cones demanded
$0.00
0.50
1.00
1.50
2.00
2.50
3.00
12 cones
10
8
6
4
2
0
1. A decrease
in price . . .
2.50
2.00
2. . . . increases quantity
of cones demanded.
1.50
1.00
Demand curve
0.50
0
1 2 3 4 5 6 7 8 9 10 11 12
Quantity of Ice-Cream Cones
10
Demand
Individual demand:
Demand
of one individual
Market demand
Sum of all individual demands for a good or
service
Market demand curve
Sum - individual demand curves horizontally
Total quantity demanded of a good varies
As the price of the good varies
All other factors that affect how much consumers
want to buy are hold constant
11
Figure 2
Market demand as the sum of individual
demands
(demand
Price ofschedule)
ice-cream cone Catherine
Nicholas
Market
$0.00
0.50
1.00
1.50
2.00
2.50
3.00
12
10
8
6
4
2
0
+
7
6
5
4
3
2
1
=
19
16
13
10
7
4
1
The quantity demanded in a market is the sum of the quantities demanded by all the
buyers at each price. Thus, the market demand curve is found by adding horizontally
the individual demand curves. At a price of $2.00, Catherine demands 4 ice-cream
cones, and Nicholas demands 3 ice-cream cones. The quantity demanded in the
market at this price is 7 cones.
12
Figure 2
Market demand as the sum of individual
Catherine’s
Nicholas’s
Market
demands
+
=
demand
demand
demand
Price of
Ice
Cream
Cones
$3.00
DCatherine
Price of
Ice
Cream
Cones
$3.00
Price of
Ice
Cream
Cones
$3.00
DNicholas
2.50
2.50
2.00
2.00
2.00
1.50
1.50
1.50
1.00
1.00
1.00
0.50
0.50
0.50
0
1 2 3 4 5 6 7 8 9 10 11 12
Quantity of Ice-Cream Cones
0
1 2 3 4 5 6 7
Quantity of
Ice-Cream Cones
2.50
0
DMarket
2 4 6 8 10 12 14 16 18
Quantity of Ice-Cream Cones
13
Demand
Shifts in demand
Increase
in demand
Any change that increases the quantity
demanded at every price
Demand curve shifts right
Decrease
in demand
Any change that decreases the quantity
demanded at every price
Demand curve shifts left
14
3
Shifts in the demand curve
Price of
Ice-Cream
Cones
Increase in
Demand
Decrease in
Demand
Demand
curve, D3
0
Demand
curve, D1
Demand
curve, D2
Quantity of Ice-Cream Cones
Any change that raises the quantity that buyers wish to purchase at any given
price shifts the demand curve to the right. Any change that lowers the quantity that
buyers wish to purchase at any given price shifts the demand curve to the left.
15
Demand
Variables that can shift the demand curve
Income
Prices
of related goods
Tastes
Expectations
Number
of buyers
16
Demand
Income
Normal
good: other things constant, an
increase in income makes increase in
demand
Necessary goods
Luxury goods
Inferior
good: Other things constant, an
increase in income makes decrease in
demand
17
Demand
Prices of related goods
Substitutes
- two goods
An increase in the price of one
Leads to an increase in the
demand for the other
Complements
– two goods
An increase in the price of one
Leads to a decrease in the
demand for the other
18
Demand
Tastes
Change
in tastes – changes the demand
Expectations - about the future (income,
prices)
Affect current demand
Number of buyers – increase
Market demand - increases
19
Determinants of Demand
What factors
determine how much
ice cream you will
buy?
What factors
determine how much
you will really
purchase?
Quick Quiz!
List the determinants of the
demand for pizza.
Give an example of a demand
schedule for pizza.
Give an example of something
that would shift the demand curve.
Overview
Market
and Competition
Demand
Supply
Equilibrium
Price and Resource Allocation
Supply
Quantity supplied
Amount
of a good
Sellers are willing and able to sell
Law of supply
Other things equal
When the price of the good rises
Quantity supplied of a good rises
23
Supply
Relationship between: P and QS can be shown
as:
Supply schedule - a table: shows the quantity
supplied at each price
Supply curve - a graph: illustrates how the quantity
supplied of the good changes as its price varies.
slopes upward.
Supply function: QS = g (P)
24
Figure 5
Ben’s supply schedule and supply curve
Price of
Ice-cream cone
Quantity of
Cones supplied
$0.00
0.50
1.00
1.50
2.00
2.50
3.00
0 cones
0
1
2
3
4
5
Price of
Ice-Cream
Cones
$3.00
2.50
Supply curve
1. An increase
in price . . .
2.00
1.50
1.00
2. . . . increases quantity
of cones supplied.
0.50
0
1 2 3 4 5 6 7 8 9 10 11 12
Quantity of Ice-Cream Cones
25