Composition of ground granulated blast-furnace slag and fly ash-based geopolymer activated by sodium silicate and sodium hydroxide solution: Multi-response optimization using Response Surface Methodology
Bạn đang xem bản rút gọn của tài liệu. Xem và tải ngay bản đầy đủ của tài liệu tại đây (1.9 MB, 9 trang )
<span class='text_page_counter'>(1)</span><div class='page_container' data-page=1>
<b>Vietnam Journal of Science,</b>
<b>Technology and Engineering</b>
21march 2021 • Volume 63 Number 1
<b>Introduction</b>
Alkali-activated binders were first investigated in the
1940s by Purdon’s research [1] with the use of GGBS
activated with NaOH solution. In 1991, Davidovits
developed and patented binders obtained from the alkaline
activation of metakaolin named "Geopolymer" [2]. The
chemistry of geopolymers are different from Portland
cement (OPC). It is well known that OPC is a fine powder
obtained by grinding a mixture of clinker, which is made by
heating limestone, clay, and other materials such as fly ash
with a few percent of gypsum (CaSO<sub>4</sub>.2H<sub>2</sub>O) or anhydrite
(CaSO<sub>4</sub>) to a high temperature (approximately 1450°C). The
main binding product, which is derived from the hydration
of clinker with water, is calcium silicate hydrate gels known
as “C-S-H” gels. The formation of C-S-H, which is an
apparently amorphous phase of variable composition, is
principally responsible for strength development and matrix
formation in Portland cement.
Unlike Portland cement, an alkali-activated binder can
be synthesized by exposure of aluminosilicate materials to
concentrated alkaline hydroxide (NaOH, KOH) and/or alkali
silicate (Na<sub>2</sub>SiO<sub>3</sub>) solutions, which are then curing at room
temperature or slightly elevated temperature [2]. Source
materials for alkali-activated binder synthesis should be rich
in silicon and aluminium. These could be natural minerals
such as kaolinite or metakaolin or one with an empirical
<b>Composition of ground granulated blast-furnace slag and </b>
<b>fly ash-based geopolymer activated by sodium silicate and </b>
<b>sodium hydroxide solution: multi-response optimization </b>
<b>using Response Surface Methodology</b>
<b>Hoang-Quan Dinh1*<sub>, Thanh-Bang Nguyen</sub>2</b>
<i>1<sub>Thuyloi University, Vietnam</sub></i>
<i>2<sub>Vietnam Academy for Water Resources, Vietnam</sub></i>
Received 13 August 2020; accepted 10 November 2020
<i> </i>
<i>*Corresponding author: Email: </i>
<i><b>Abstract:</b></i>
<b>Geopolymers are a class of new binder manufactured by activating aluminosilicate source materials in a highly </b>
<b>alkaline medium. This binder is considered “environmentally friendly” due to the recycling of industrial waste </b>
<b>sources such as fly ash and blast furnace slag. However, in order to be widely used, this binder has to ensure both </b>
<b>quality and economic efficiency. This paper focuses on the optimization of the composition of ground granulated </b>
<b>blast-furnace slag and fly ash-based geopolymers activated by sodium silicate and sodium hydroxide solutions. </b>
<b>Statistical models are developed to predict the compressive strength and cost of 1 ton of binder using Response </b>
<b>Surface Methodology (RSM). In this regard, the effects of three principal variables (%Na<sub>2</sub>O, M<sub>s</sub> and %GGBS) </b>
<b>were investigated in which: %Na<sub>2</sub>O - mass ratio of Na<sub>2</sub>O in the alkali-activated solution and total solids; M<sub>s</sub> - </b>
<b>mass ratio of SiO<sub>2</sub> and Na<sub>2</sub>O in the activated solution; %GGBS - mass ratio of ground granulated blast-furnace </b>
<b>slag (GGBS), and total binder. Quadratic models were proposed to correlate the independent variables for the </b>
<b>28-d compressive strength and cost of 1 ton of binder by using the Central Composite Design (CCD) method. </b>
<b>The study reveals that M<sub>s</sub> has a minor effect on the strength of mortar in comparison with %Na<sub>2</sub>O and %GGBS. </b>
<b>The optimized mixture proportions were assessed using the multi-objective optimization technique. The optimal </b>
<b>values found were %Na<sub>2</sub>O=5.18%, M<sub>s</sub>=1.16, and %GGBS=50%, with the goals of maximum compressive strength, </b>
<b>the largest amount of fly ash, and reasonable cost for one ton of binder. The experimental results show that the </b>
<b>compressive strength of the samples ranged between 62.95-63.54 MPa and were consistent with the optimized </b>
<b>results (the variation between the predicted and the experimental results was obtained less than 5%).</b>
<i><b>Keywords: </b></i><b>alkali-activated slag, fly ash, geopolymer, GGBS, optimization, Response Surface Methodology.</b>
</div>
<span class='text_page_counter'>(2)</span><div class='page_container' data-page=2>
formula containing Si, Al, and oxygen. Alternatively,
by-product materials such as fly ash, silica fume, slag, rice husk
ash, and red mud could also be used as source materials.
The choice of precursor for making an alkali-activated
binder depends on factors such as availability, cost, type of
application, and specific demand of end users.
According to Roy (1999) [3] and Palomo, et al. (1999)
[4], source materials for alkali-activated binder synthesis
can be classed into two groups:
- 1st<sub> group: aluminosilicate materials such as metakaolin </sub>
and class F fly ash produce N-A-S-H gel, also called
poly(sialates) gel or “geopolymer” when activated by an
alkaline solution.
- 2nd<sub> group: alkali-earth enriched aluminosilicate </sub>
materials such as blast furnace slag and class C fly ash
produce C-(A)-S-H gel like hydrated calcium silicate gel
with high amounts of tetracoordinated Al in its structure, as
well as Na+<sub> ions in the interlayer spaces when activated by </sub>
an alkaline solution.
Several authors suggested that blending these two groups
may produce both N-A-S-H and C-S-H gels in the matrix.
Puertas, et al. (2011) [5] studied the hydration products of
a geopolymer paste made by a mixture of 50% fly ash and
50% slag activated with 10 M NaOH and cured at 25°C
using XRD, FTIR, and MAS-NMR analysis. They found
that the main reaction product in these pastes is a hydrated
calcium silicate, like C-S-H gel, with high amounts of
tetracoordinated Al in its structure as well as Na+<sub> ions in the </sub>
interlayer spaces. Yunsheng, et al. (2007) [6] reported that a
geopolymer synthesized by 50% metakaolin and 50% slag
activated with water glass at 20°C had both N-A-S-H and
C-(A)-S-H gels forming within its matrix.
Previous studies on alkali-activated slag/fly ash binders
show that their mechanical properties are influenced by
many factors such as precursor materials, type, dosage
of alkali-activated solution, and curing conditions [7-9].
However, experimental design methods in these studies
stop at univariate analysis or combine simple multivariate
with orthogonal design to determine the optimal value
through a limited number of experiments. Response Surface
Methodology (RSM) allows one to determine the optimal
condition of multiple factors accurately and takes into
account the effects of these factors and their interactions
with one or more response variables with reliability. Some
authors have used RSM to optimize the composition of
alkali-activated binders. Research by Pinheiro, et al. (2020)
[10] focused on predicting equations for compressive
and flexural strength at 7 d and 28 d based on three input
variables (activator index, precursor index and sodium
hydroxide concentration). The ideal composition obtained
for the alkaline cement was a mixture constituted by 75%
sodium silicate and 25% sodium hydroxide, 50% slag and
50% fly ash, and a sodium hydroxide concentration equal 10
M. This mixture achieved 8.70 MPa of flexural strength and
44.25 MPa of compressive strength. Besides, other authors
have used a two-input-variable model in their research. For
example, Mohammed, et al. (2019) [11] focused on the
mass ratio of GGBS and total binder and the mass ratio of
sodium metasilicate anhydrous and total solid. In addition,
Rivera, el al. (2019) [12] studied SiO<sub>2</sub>/Al<sub>2</sub>O<sub>3</sub> and Na<sub>2</sub>O/SiO<sub>2</sub>
molar ratios with a fixed ratio of fly ash and slag. These
studies selected compressive strength as the target function
to optimize the binder composition. However, a product
requires not only good features but also a reasonable cost.
Therefore, using cost for one ton of binder as an objective
function is necessary.
Additionally, most previous studies have selected input
parameters when preparing the alkali solution as the mass
ratio of sodium silicate to sodium hydroxide
(SS/SH=1.5/1-2.5/1) and the molarity of sodium hydroxide solution (8-14
M). These studies all use sodium silicate liquid with a silica
modulus (SiO<sub>2</sub>/Na<sub>2</sub>O) of 2.0 while the water glass produced
in Vietnam and some other countries has silica moduli
ranging from 1.5 to 2.7. Therefore, preparation in this
manner is detrimental to practical application because the
quality of the concrete can be very different with different
types of water glass.
In this study, by using RSM, statistical models are
developed to predict the compressive strength and cost for
one ton of binder. For better quantification when preparing
the alkali solution, this study selected input parameters
%Na<sub>2</sub>O and M<sub>s</sub>, in which: %Na<sub>2</sub>O - mass ratio of Na<sub>2</sub>O in
the alkali-activated solution and total solids (FA, GGBS and
solids in alkali solution); M<sub>s</sub> - mass ratio of SiO<sub>2</sub> and Na<sub>2</sub>O
in the activated solution. Therefore, liquid sodium silicate,
sodium hydroxide, and added water were blended in
different proportions providing the required M<sub>s</sub> and %Na<sub>2</sub>O.
Additionally, the precursor index was characterized by the
input parameter of %GGBS - mass ratio of GGBS and total
binder (FA, GGBS). The effects of these principal variables
(%Na<sub>2</sub>O, M<sub>s</sub> and %GGBS) and their interactions were
investigated. Thus, the optimal compositions of ground
granulated blast-furnace slag and fly ash-based geopolymers
(AAFS) were determined through optimization analysis.
<b>Materials and experimental program</b>
<i><b>Materials</b></i>
</div>
<span class='text_page_counter'>(3)</span><div class='page_container' data-page=3>
<b>Vietnam Journal of Science,</b>
<b>Technology and Engineering</b>
23march 2021 • Volume 63 Number 1
ignition (LOI) fly ash products (LOI>6%). Therefore,
research on the use of FA with a high LOI content (this FA
is not allowed to be used as mineral additives for cement)
will bring great economic benefits. In this inquiry, 3 types
of class F fly ash, according to the Vietnamese national code
TCVN 10302:2014 [13], were used as the main binder. The
chemical constituents were identified by X-ray fluorescence
(XRF) and displayed in Table 1. These FAs with different
LOI were obtained from the Hai Phong (HP) Thermal
Power Plant (LOI=11.32%), Pha Lai (PL) Thermal Power
Plant (LOI=10.93%), and Formosa (FO) Thermal Power
Plant (LOI=1.83%). These three FA types were selected to
evaluate the effect of LOI on compressive strength.
<i>Ground granulated blast-furnace slag: ground </i>
granulated blast-furnace slag was used as the secondary
binder in this study. GGBS was obtained from Hoa Phat
Steel Joint Stock Company with finesses and chemical
constituents displayed in Table 1. The partial replacement
of FA with GGBS was expected to produce high strength
samples under room temperature curing condition.
<b>Table 1. Chemical composition of Fa and GGbS (percentage by </b>
<b>weight).</b>
<b>Chemical oxide</b> <b>FA from HP FA from PL FA from FO GGBS</b>
SiO2 49.31 47.45 53.48 36.15
Al2O3 21.68 20.55 28.84 10.59
Fe2O3 8.76 5.17 4.73 0.35
CaO 1.27 8.3 4.12 39.13
MgO 1.62 1.6 2.31 7.59
SO3 0.42 0.81 0.32 1.47
K2O 4.36 3.84 1.25 0.95
Na2O 0.13 0.24 0.85 0.2
TiO2 0.98 0.76 1.8 0.54
MnO 0.08 0.05 0.04 2.25
P2O5 0.13 0.14 0.26 <0.01
LOI 11.32 10.93 1.83
-Specific gravity
(g/cm3<sub>)</sub> 2.24 2.24 2.15 2.85
Blaine fineness
(cm2<sub>/g)</sub> 2935 2863 3617 3503
<i>Alkali-activated solution: alkali-activated solution </i>
includes sodium hydroxide (NaOH) in powder form of 99%
purity and sodium silicate as a solution (Na<sub>2</sub>SiO<sub>3</sub>), or called
waterglass, with 6.7% SiO<sub>2</sub>, 9.84% Na<sub>2</sub>O and 63.46% H<sub>2</sub>O
by weight. Liquid sodium silicate, sodium hydroxide, and
added water were blended in different proportions providing
the required M<sub>s</sub> and %Na<sub>2</sub>O.
<i><b>Experimental design</b></i>
<i>Input variables: the composition of alkali-activated </i>
binder includes FA, GGBS, and an alkali solution. The
water-to-solids ratio and the sand-to-solids ratio were
constant at 0.35 and 3.0 respectively. Therefore, the input
parameters were selected as %Na<sub>2</sub>O, M<sub>s</sub>, and %GGBS. The
surveyed domain, coded value, and the real value are shown
in Table 2.
<b>Table 2. Surveyed domain, the coded value and the real value </b>
<b>of input variables.</b>
<b>Input </b>
<b>variables</b>
<b>- Alpha</b> <b>Lower <sub>limit</sub></b> <b>Center <sub>point</sub></b> <b>Higher <sub>limit</sub></b> <b>+ Alpha</b>
<i><b>(-1.6818) (-1)</b></i> <i><b>(0)</b></i> <i><b>(+1)</b></i> <i><b>(+1.6818)</b></i>
%Na2O 1.64% 3% 5% 7% 8.36%
M<sub>s</sub> 0.83 1 1.25 1.5 1.67
%GGBS 7.96% 25% 50% 75% 92.04%
<i>Experimental design: Design Expert software has been </i>
used for the experimental design. Based on the Central
Composite Design (CCD) for three independent variables,
the mix design formulations of the alkali-activated pastes
were randomly selected. The results of this work are the
28-d compressive strength and cost for one ton of binder.
The software developed (23<sub>+2x3+6)=20 mixtures for these </sub>
responses with five randomized duplications. The five
duplications are the central points used by the software
to improve the experiment’s accuracy against any likely
errors. Thus, for three types of fly ash (HP, PL and FO), the
number of mixtures is 3x20=60. The composition of mortar
specimens are shown in Table 3.
</div>
<span class='text_page_counter'>(4)</span><div class='page_container' data-page=4>
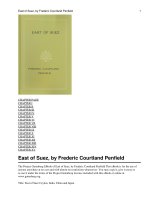
<b>Fig. 1. Flow test apparatus and measurement of the flow </b>
<b>diameter </b>[15].
<b>Results and discussion</b>
<i><b>Statistical models of 28-d compressive strength and the </b></i>
<i><b>cost for 1 ton of binder</b></i>
The effects of the three input variables (%Na<sub>2</sub>O, M<sub>s</sub>, and
%GGBS) and their interactions with the responses (the 28-d
compressive strength and the cost for one ton of binder)
were conducted by a quadratic function as follows:
<b>Results and discussion </b>
<i><b>Statistical models of 28</b><b>-</b><b>d compressive strength and the cost for 1 ton of binder</b></i>
The effects of the three input variables (%Na2O, Ms, and %GGBS) and their
interactions with the responses (the 28-d compressive strength and the cost for one ton of
binder) were conducted by a quadratic function as follows:
∑ ∑ ∑
where Y represents the response value, X represents the input variable, <i>βo is the </i>
interception coefficient, <i>βi is the coefficient of the linear effect, βii is the coefficient of the </i>
quadratic effect, and βij is the coefficient of the interaction effect.
The software Design Expert version 11 was used for multiple regression analysis
of the obtained experimental data. An F-test was employed to evaluate the statistical
significance of the quadratic polynomial. The multiple coefficients of correlation, R, and
the determination coefficient of correlation, R2<sub>, were calculated to evaluate the </sub>
performance of the regression equation.
The mixture proportions and the test results of the 60 prepared mixtures to derive
the CCD models are summarized in Table 3. The ANOVA response models for 28-d
compressive strength of HP, PL and FO specimens are shown in Table 5, Table 6 and
Table 7, respectively. The model’s F-values of 75.1, 188.8, and 188.0 for HP, PL, and FO
mixtures, respectively, show that the models are significant. There is only a 0.01%
chance that an F-value this large could occur due to noise. P-values less than 0.0500
indicate the model terms are significant and those greater than 0.1000 indicate the model
terms are not significant. The resulting p-values in Table 5-7 show that factors like
%Na2O and %GGBS were important at a confidence level of 95% and thus were
accepted as crucial parameters on the test results. However, Ms has a minor effect on the
28-d compressive strength in comparison with %Na2O and %GGBS. This result is
consistent with the study of Prusty and Pradhan [16]. The model’s quality could be
assessed on the basis of lack of fit, for example, the smaller lack of fit value indicates the
worthiness of the models. The lack of fit for the F-value was 4.05, 4.92, and 4.83 in the
models of HP, PL, and FO mixtures, respectively, implies that there was 7.54%, 5.25%,
and 5.44% chance that the lack of fit for an F-value this large could occur due to noise.
The lack of fit for the p-value in all models was larger than 0.05, which indicates “not
significant” and thus implies good fitness for all the model’s responses. Table 9 shows
high R2<sub>values of 0.985, 0.994</sub><sub>, and 0.964 for the 28-d compressive strength models of the </sub>
HP, PL, and FO mixtures, respectively, which indicate a good measure of the
correspondence between the predicted and experimental results. The predicted R2<sub> values </sub>
are in reasonable agreement with the adjusted R2<sub> as the differences are less than 0.2. All </sub>
models have sufficient precision values of more than 4, indicating that the models could
be used to navigate the design space. The predicted vs actual results are plotted in Fig. 2
where Y represents the response value, X represents the
input variable, β<i><sub>o</sub></i> is the interception coefficient, <i>β<sub>i</sub></i> is the
coefficient of the linear effect, β<i><sub>ii</sub></i> is the coefficient of the
quadratic effect, and β<sub>ij</sub> is the coefficient of the interaction
effect.
The software Design Expert version 11 was used for
multiple regression analysis of the obtained experimental
data. An F-test was employed to evaluate the statistical
significance of the quadratic polynomial. The multiple
coefficients of correlation, R, and the determination
coefficient of correlation, R2<sub>, were calculated to evaluate </sub>
the performance of the regression equation.
The mixture proportions and the test results of the 60
prepared mixtures to derive the CCD models are summarized
in Table 3.
<b>Table 3. Composition of mortar specimens and the experimental results. </b>
<b>Run</b>
<b>Input variables</b> <b>Composition of mortar specimens (gam)</b> <b>28-d Compressive strength <sub>(MPa)</sub></b> <b><sub>Cost for </sub></b>
<b>1 ton of </b>
<b>binder</b>
<i><b>%Na</b><b>2</b><b>O</b></i> <i><b>M</b><b>s</b></i> <i><b>%GGBS</b></i> <i><b>Sand</b></i> <i><b>GGBS</b></i> <i><b>FA</b></i> <i><b><sub>(liquid)</sub></b><b>Na</b><b>2</b><b>SiO</b><b>3</b></i> <i><b>NaOH </b><b><sub>(powder)</sub></b></i> <i><b>H</b><b><sub>(extra)</sub></b><b>2</b><b>O </b></i> <i><b>HP-R</b><b>28</b></i> <i><b>PL-R</b><b>28</b></i> <i><b>FO-R</b><b>28</b></i>
1 3% 1 75% 1350 317.3 105.8 51.9 11 124 28.1 30.5 36.1 $49.86
2 8.36% 1.25 50% 1350 182.7 182.7 180.9 26.2 40.9 49.4 46.3 51.2 $112.58
3 7% 1 75% 1350 290.3 96.8 121.2 25.7 79.4 62.8 64.1 65.2 $93.43
4 5% 1.67 50% 1350 195 195 144.5 11.2 64.2 55.5 55.8 52.0 $80.47
5 1.64% 1.25 50% 1350 216.7 216.7 35.5 5.1 134.7 0.0 0.0 0.0 $32.45
6 5% 1.25 50% 1350 199.7 199.7 108.2 15.7 87.6 56.8 62.1 60.2 $72.52
7 5% 1.25 92.04% 1350 367.6 31.8 108.2 15.7 87.6 59.1 68.3 63.5 $78.93
8 5% 1.25 7.96% 1350 31.8 367.6 108.2 15.7 87.6 5.9 14.3 12.9 $66.10
9 5% 0.83 50% 1350 204.4 204.4 71.8 20.2 111 58.5 55.8 46.2 $64.56
10 3% 1 25% 1350 105.8 317.3 51.9 11 124 6.5 9.8 0.0 $41.79
11 5% 1.25 50% 1350 199.7 199.7 108.2 15.7 87.6 59.4 58.9 56.8 $72.52
12 5% 1.25 50% 1350 199.7 199.7 108.2 15.7 87.6 62.1 62.5 60.7 $72.52
13 7% 1.5 25% 1350 92.8 278.4 181.7 18.2 40.4 29.9 40.3 36.0 $99.45
14 5% 1.25 50% 1350 199.7 199.7 108.2 15.7 87.6 62.1 61.6 59.8 $72.52
15 3% 1.5 75% 1350 312.2 104.1 77.9 7.8 107.3 25.4 37.4 32.1 $55.48
16 7% 1 25% 1350 96.8 290.3 121.2 25.7 79.4 28.7 36.1 32.0 $86.04
17 7% 1.5 75% 1350 278.4 92.8 181.7 18.2 40.4 63.0 70.4 62.3 $106.54
18 5% 1.25 50% 1350 199.7 199.7 108.2 15.7 87.6 58.7 62.2 59.8 $72.52
19 5% 1.25 50% 1350 199.7 199.7 108.2 15.7 87.6 56.6 60.3 60.2 $72.52
</div>
<span class='text_page_counter'>(5)</span><div class='page_container' data-page=5>
<b>Vietnam Journal of Science,</b>
<b>Technology and Engineering</b>
25march 2021 • Volume 63 Number 1
The ANOVA response models for 28-d compressive
strength of HP, PL and FO specimens are shown in Table
4-6, respectively. The model’s F-values of 75.1, 188.8, and
188.0 for HP, PL, and FO mixtures, respectively, show that
the models are significant. There is only a 0.01% chance
that an F-value this large could occur due to noise. P-values
less than 0.0500 indicate the model terms are significant
and those greater than 0.1000 indicate the model terms are
not significant. The resulting p-values in Tables 4-6 show
that factors like %Na<sub>2</sub>O and %GGBS were important at a
confidence level of 95% and thus were accepted as crucial
parameters on the test results. However, M<sub>s</sub> has a minor
effect on the 28-d compressive strength in comparison with
%Na<sub>2</sub>O and %GGBS. This result is consistent with the study
of Prusty and Pradhan (2020) [16]. The model’s quality
could be assessed on the basis of lack of fit, for example,
the smaller lack of fit value indicates the worthiness of the
models. The lack of fit for the F-value was 4.05, 4.92, and
4.83 in the models of HP, PL, and FO mixtures, respectively,
implies that there was 7.54, 5.25, and 5.44% chance that
the lack of fit for an F-value this large could occur due to
noise. The lack of fit for the p-value in all models was larger
than 0.05, which indicates “not significant” and thus implies
good fitness for all the model’s responses.
<b>Table 4. aNOVa response models for 28-d compressive strength </b>
<b>of HP specimens.</b>
<b>Source</b> <b>Sum of <sub>squares</sub></b> <b>Degrees of <sub>freedom</sub></b> <b>Mean <sub>Square F-value p-value Remark</sub></b>
Model 10102.5 9 1122.50 75.11 <0.0001 significant
A-%Na2O 2806.7 1 2806.65 187.79 <0.0001
B-Ms 9.4 1 9.43 0.63 0.4456
C-%BFS 3302.5 1 3302.49 220.97 <0.0001
AB 0.2 1 0.21 0.01 0.9077
AC 58.9 1 58.86 3.94 0.0753
BC 10.4 1 10.35 0.69 0.4247
A² 2627.3 1 2627.27 175.79 <0.0001
B² 62.5 1 62.49 4.18 0.0681
C² 1663.7 1 1663.66 111.32 <0.0001
Residual 149.5 10 14.95
Lack of fit 119.9 5 23.97 4.05 0.0754 not <sub>significant</sub>
Pure error 29.6 5 5.92
Cor total* <sub>10252.0</sub> <sub>19</sub>
*cor total: totals of all information corrected for the mean.
<b>Table 5. aNOVa response models for 28-d compressive strength </b>
<b>of PL specimens.</b>
<b>Source</b> <b>Sum of <sub>squares</sub></b> <b>Degrees of <sub>freedom</sub></b> <b>Mean <sub>square</sub></b> <b>F-value p-value</b> <b>Remark</b>
Model 9795.5 9 1088.39 188.80 <0.0001 significant
A-%Na2O 2715.3 1 2715.27 471.01 <0.0001
B-Ms 6.1 1 6.06 1.05 0.3293
C-%BFS 3625.6 1 3625.56 628.92 <0.0001
AB 37.4 1 37.41 6.49 0.0290
AC 0.3 1 0.28 0.05 0.8296
BC 17.7 1 17.70 3.07 0.1103
A² 2829.2 1 2829.22 490.78 <0.0001
B² 87.8 1 87.77 15.23 0.0030
C² 831.2 1 831.17 144.18 <0.0001
Residual 57.7 10 5.76
Lack of fit 47.9 5 9.58 4.92 0.0525 not <sub>significant</sub>
Pure error 9.7 5 1.95
Cor total 9853.1 19
<b>Table 6. aNOVa response models for 28-d compressive strength </b>
<b>of FO specimens.</b>
<b>Source</b> <b>Sum of <sub>squares</sub></b> <b>Degrees <sub>of freedom</sub></b> <b>Mean <sub>square</sub></b> <b>F-value p-value Remark</b>
Model 9719.0 9 1079.89 188.02 <0.0001 significant
A-%Na2O 3306.7 1 3306.73 575.75 <0.0001
B-Ms 4.9 1 4.87 0.85 0.3789
C-%BFS 3263.0 1 3263.03 568.14 <0.0001
AB 18.6 1 18.60 3.24 0.1021
AC 6.8 1 6.84 1.19 0.3006
BC 1.8 1 1.80 0.31 0.5874
A² 2319.0 1 2319.02 403.78 <0.0001
B² 276.1 1 276.07 48.07 <0.0001
C² 976.3 1 976.25 169.98 <0.0001
Residual 57.4 10 5.74
Lack of fit 47.6 5 9.52 4.83 0.0544 not <sub>significant</sub>
Pure error 9.9 5 1.97
Cor total 9776.4 19
</div>
<span class='text_page_counter'>(6)</span><div class='page_container' data-page=6>
<b>Table 7. aNOVa response models for the cost of 1 ton of binder.</b>
<b>Source</b> <b>Sum of <sub>squares</sub></b> <b>Degrees of <sub>freedom</sub></b> <b>Mean <sub>square</sub></b> <b>F-value p-value Remark</b>
Model 8664.81 3 2888.27 1505.28 <0.0001 significant
A-%Na2O 8150.72 1 8150.72 4247.90 <0.0001
B-Ms 327.55 1 327.55 170.71 <0.0001
C-%BFS 186.53 1 186.53 97.22 <0.0001
Residual 30.70 16 1.92
Lack of fit 30.70 11 2.79
Pure error 0.0000 5 0.0000
Cor total 8695.51 19
The cost for one ton of binder and the 28-d compressive
strength of GGBS-FA geopolymer mortar for the HP,
PL, and FO mixtures can be predicted using the analysis
of variance (ANOVA). The relationships and influence
between the variables (%Na<sub>2</sub>O, M<sub>s</sub> and %GGBS) and their
responses were achieved through variance analysis and are
presented in Eqs. (1), (2), (3), and (4).
R28 of HP =
-155.763 + 37.8043 * %Na2O + 69.2449 * Ms + 1.84237
* %GGBS + 0.325 * %Na<sub>2</sub>O * M<sub>s</sub> + 0.05425 * %Na<sub>2</sub>O *
%GGBS + 0.182 * Ms * %GGBS - 3.37552 * %Na2O2 -
33.3171 * Ms2 -0.017191 * %GGBS2
(1)
R28 of PL =
-146.623 + 36.485 * %Na<sub>2</sub>O + 67.8557 * M<sub>s</sub> + 1.55059
* %GGBS + 4.325 * %Na2O * Ms + 0.00375 * %Na2O *
%GGBS + 0.238 * Ms * %GGBS -3.50285 * %Na2O2 -
39.4861 * Ms2 - 0.0121511 * %GGBS2
(2)
R28 of FO =
-253.679 + 44.231 * %Na2O + 188.911 * Ms + 1.93268
* %GGBS - 3.05 * %Na<sub>2</sub>O * M<sub>s</sub> - 0.0185 * %Na<sub>2</sub>O *
%GGBS + 0.076 * Ms * %GGBS -3.17133 * %Na2O2 -
70.0289 * Ms2 - 0.0131689 * %GGBS2
(3)
Cost of 1 ton of
binder = -20.7913 + 12.215 * %Na%GGBS 2O + 19.5896 * Ms + 0.14783 * (4)
It should be noted that Eq. (4) was established based on
the unit price of material as shown in Table 8. Therefore,
Eq. (4) is of reference only because the unit price of the
material can change over time, for example, by taxes or
transportation distance.
<b>Table 8. Unit price of material.</b>
<b>Materials</b> <b>GGBS FA</b> <b>Sodium silicate <sub>liquid</sub></b> <b>Sodium <sub>hydroxide</sub></b>
Unit price* (USD per ton) 21.49 4.30 171.90 567.25
Note: unit price includes taxes and transportation costs.
Table 9 shows high R2<sub> values of 0.985, 0.994, and 0.964 </sub>
for the 28-d compressive strength models of the HP, PL, and
FO mixtures, respectively, which indicate a good measure of
the correspondence between the predicted and experimental
results. The predicted R2<sub> values are in reasonable agreement </sub>
with the adjusted R2<sub> as the differences are less than 0.2. </sub>
All models have sufficient precision values of more than
4, indicating that the models could be used to navigate the
design space. The predicted vs actual results are plotted
in Fig. 2 and show that the predicted response model was
precise. The points were fitted smoothly to a straight line,
which indicates a good relationship between experimental
and predicted outcomes in the established models.
<b>Table 9. Validation properties of response model.</b>
<b>Response</b>
<b>28-d compressive strength</b>
<b>Cost for 1 ton </b>
<b>of binder</b>
<i><b>for HP </b></i>
<i><b>mixture</b></i> <i><b>for PL </b><b>mixture</b></i> <i><b>for FO </b><b>mixture</b></i>
Standard deviation 3.87 2.4 2.4 1.39
Mean 41.5 44.91 42.41 72.16
C.V. % 9.32 5.35 5.65 1.92
R² 0.9854 0.9941 0.9941 0.9965
Adjusted R² 0.9723 0.9889 0.9888 0.9958
Predicted R² 0.9074 0.9583 0.9617 0.9934
Adequate precision 25.2553 43.6859 39.7157 132.6476
<b> </b>(<b>a</b>) <b> </b> (<b>b</b>) <b> </b> (<b>C</b>)
</div>
<span class='text_page_counter'>(7)</span><div class='page_container' data-page=7>
<b>Vietnam Journal of Science,</b>
<b>Technology and Engineering</b>
27march 2021 • Volume 63 Number 1
Three-dimensional surface plots were generated for the
pairwise combination of the three factors while keeping
one constant. The graphs are given here to highlight the
roles played by the various factors in the 28-d compressive
strength. Fig. 3 shows the effect of %GGBS and %Na<sub>2</sub>O
while Fig. 4 shows the effect of %GGBS and M<sub>s</sub> on the 28-d
compressive strength of mortar. It is noteworthy that the
sources of FA with different LOI have minor effect on the
compressive strength of mortar. In other words, although fly
ash is obtained from different factories, it is only necessary
to ensure that the class F fly ash is in accordance with the
Vietnamese national code TCVN 10302:2014 and contains
less than 12% of LOI. With those two conditions met, it
can be used to make a high strength alkali-activated binder.
It is also noteworthy that M<sub>s</sub> has a very small effect when
compared to the other factors (%Na<sub>2</sub>O and %GGBS).
This result opens up a promising research direction;
instead of the standard combination of sodium silicate
and sodium hydroxide, 100% sodium silicate can be used
as an activator. With the properties that exist in powder
form (Na<sub>2</sub>SiO<sub>3</sub>.5H<sub>2</sub>O) and are not heat generating like
sodium hydroxide, we can pre-mix Na<sub>2</sub>SiO<sub>3</sub>.5H<sub>2</sub>O with FA
and GGBS in the appropriate ratio for bagging to use as
traditional cement.
<i><b>Optimizations</b></i>
Although alkali-activated binders are considered to have
many good properties and are environmentally friendly, it has
not been widely used as Portland cement due to its high cost.
Therefore, an optimisation of binder composition should be
performed to ensure both high strength and reasonable cost.
Furthermore, most of the thermal power plants in Vietnam
use poor quality coal, which results in high-LOI fly ash
products (LOI>6%). Therefore, the increased use of FA
with high LOI content (this FA is not allowed to be used as
mineral additives for cement), the more environmental and
economic benefits. Based on the purpose of optimisation, the
characteristic goals of the factors and their response for the
multi-response optimization process are shown in Table 10.
(<b>a</b>) (<b>b</b>) (<b>C</b>)
<b>Fig. 3. 3D surface plots of 28-d compressive strength models for the (a) HP mixture, (b) PL mixture, and (C) FO mixture - effect of </b>
<b>%GGbS and %Na2O.</b>
(<b>a</b>) (<b>b</b>) (<b>C</b>)
</div>
<span class='text_page_counter'>(8)</span><div class='page_container' data-page=8>
<b>Table 10. Definitions for the factors and the responses in the </b>
<b>optimization process.</b>
<b>Factors and response</b> <b>1st<sub> goal</sub></b> <b><sub>2</sub>nd<sub> goal</sub></b> <b><sub>Lower</sub></b> <b><sub>Upper</sub></b>
A:%Na2O is in range is in range 3 7
B:Ms is in range is in range 1 1.5
C:%GGBS is in range minimize 25 75
HP-R28 maximize maximize 0 63
PL-R28 maximize maximize 0 70.4
FO-R28 maximize maximize 0 65.2
Cost none minimize 31.076 113.248
Based on the purpose of optimization, the numerical
optimization solutions are presented in Table 11. According
to those results, for the 1st<sub> goal, the optimal values were </sub>
%Na<sub>2</sub>O=6.15%, M<sub>s</sub>=1.30, and %GGBS=73% with
predicted 28-d compressive strengths of 69.84, 74.06,
and 71.07 MPa. For the 2nd<sub> goal, the optimal values were </sub>
%Na<sub>2</sub>O=5.18%, M<sub>s</sub>=1.16, and %GGBS=50% with predicted
28-d compressive strengths of 60.69, 61.84 and 60.19 MPa.
To validate the appropriateness of the optimization
results and the entire response model, an additional set of
investigations were carried out using the optimized mixture
proportions. The experimental results were consistent with
predicted results with errors between them less than 5% as
shown in Table 11. However, the specimens containing 73%
GGBS (for the 1st<sub> goal) a microcracking network developing </sub>
on the surface was visible (Fig. 5). This phenomenon was
also found in the study of Zawrah, et al. (2018) [17] with
samples containing more than 70% GGBS. This result may
have contributions from the high autogenous and drying
shrinkage of the alkali-activated slag (AAS). Thomas, et
al. (2012) [18] proposed a hypothesis that this effect was
due to part of the greater chemical shrinkage of the alkali
activated slag. Additionally, the effect of autogenous
shrinkage may be exacerbated by the fact that incorporating
GGBS yields a lower permeability of the AAS samples,
which prevents excess water into the specimens during
saturated curing, which leads to differential stresses that
can cause cracking. This phenomenon was not observed
in the samples containing 50% GGBS (for the 2nd<sub> goal). It </sub>
is said that the higher replacement of GGBS with fly ash,
the lower shrinkage of AAFS mortars [19] and also lower
compressive strength.
<b>Conclusions</b>
This study focused on the effects of the input variables
%Na<sub>2</sub>O, M<sub>s</sub>, and %GGBS as well as the interaction between
them on the target responses of 28-d compressive strength
and the cost for one ton of binder. The following conclusions
were drawn:
- Although fly ash can be obtained from different
factories, it is only necessary to ensure that the class F fly
ash in accordance with the Vietnamese national code TCVN
10302:2014 and contains less than 12% of LOI. Then, it
<b>Table 11. Optimization results and model verification.</b>
<b>Optimization goal</b> <b>Response</b> <b>%Na2O</b> <b>Ms</b> <b>%GGBS</b> <b>Predicted results</b> <b>Experimental results</b> <b>Error (%)</b>
1st<sub> Goal</sub>
28-d compressive strength for
HP mixture (MPa) 6.15 1.30 73 69.84 71.75 2.73%
28-d compressive strength for
PL mixture (MPa) 74.06 73.99 -0.10%
28-d compressive strength for
FO mixture (MPa) 71.07 72.71 2.30%
Cost of 1 ton of binder (USD) $90.59
2nd<sub> Goal</sub>
28-d compressive strength for
HP mixture (MPa) 5.18 1.16 50 60.69 62.95 3.72%
28-d compressive strength for
PL mixture (MPa) 61.84 63.54 2.75%
28-d compressive strength for
FO mixture (MPa) 60.19 63.11 4.85%
Cost of 1 ton of binder (USD) $72.49
</div>
<span class='text_page_counter'>(9)</span><div class='page_container' data-page=9>
<b>Vietnam Journal of Science,</b>
<b>Technology and Engineering</b>
29march 2021 • Volume 63 Number 1
can be used to make high strength alkali-activated binder.
Moreover, the sources of FA with different LOI have minor
effects on the compressive strength of mortar.
- M<sub>s</sub> has a very small effect compared to the other factors
(%Na<sub>2</sub>O and %GGBS). This result opens up a promising
research direction; instead of the standard combination
of sodium silicate and sodium hydroxide, 100% sodium
silicate may be used as an activator.
- The optimal values were %Na<sub>2</sub>O=5.18%, M<sub>s</sub>=1.16, and
%GGBS=50% with the goals of maximum compressive
strength, the largest amount of fly ash, and reasonable
cost. The experimental results show that the compressive
strength of the samples were between 62.95 and 63.54 MPa
and consistent with the optimized results (the variation
between the predicted and the experimental results was less
than 5%).
For future work, with emphasis on the properties that
exist in powder form (Na<sub>2</sub>SiO<sub>3</sub>.5H<sub>2</sub>O) and the lack of
heat generation like sodium hydroxide, research will be
conducted to pre-mix Na<sub>2</sub>SiO<sub>3</sub>.5H<sub>2</sub>O with FA and GGBS
in an appropriate ratio for bagging for use as a traditional
cement.
<b>ACKNOWLEDGEMENTS</b>
This study is a part of the national project
KC08.21/16-20. The authors would like to admit the program
KC08/16-20, Ministry of Science and Technology, Vietnam for the
research financial support.
<b>COMPETING INTERESTS </b>
The authors declare that there is no conflict of interest
regarding the publication of this article.
<b>REFERENCES</b>
[1] A.O. Purdon (1940), “The action of alkalis on blast furnace
slag”, <i>Journal of the Society of Chemical Industry</i>, <b>59</b>, pp.191-202.
[2] J. Davidovits (1991), “Geopolymer: inorganic polymeric new
materials”, <i>Journal of Thermal Analysis</i>, <b>37</b>, pp.1633-1656.
[3] D.M. Roy (1999), “Alkali-activated cements: opportunities
and challenges”, <i>Cement and Concrete Research</i>, <b>29</b>, pp.249-254.
[4] A. Palomo, et al. (1999), “Alkali-activated fly ashes: a cement
for the future”, <i>Cement and Concrete Research</i>, <b>29</b>, pp.1323-1329.
[5] F. Puertas, et al. (2011), “A model for the C-A-S-H gel formed
in alkali-activated slag cements”, <i>Journal of the European Ceramic </i>
<i>Society</i>, <b>31(12)</b>, pp.2043-2056.
[6] Z. Yunsheng, et al. (2007), “Synthesis and heavy metal
immobilization behaviors of slag based geopolymer”, <i>Journal of </i>
<i>Hazardous Materials</i>, <b>143(1-2)</b>, pp.206-213.
[7] A. Wardhono, et al. (2015), “The strength of alkali-activated
slag/fly ash mortar blends at ambient temperature”, <i>Procedia </i>
<i>Engineering</i>, <b>125</b>, pp.650-656.
[8] S. Kumar, et al. (2013), “Development and determination
of mechanical properties of fly ash and slag blended geopolymer
concrete”, <i>International Journal of Scientific & Engineering </i>
<i>Research</i>, <b>4(8)</b>, 5pp.
[9] P. Abhilash, et al. (2016), “Strength properties of fly ash
and GGBS based geopolymer concrete”, <i>International Journal of </i>
<i>ChemTech Research</i>, <b>9(3)</b>, pp.350-356.
[10] C. Pinheiro, et al. (2020), “Application of the response
surface method to optimize alkali activated cements based on
low-reactivity ladle furnace slag”, <i>Construction and Building Materials</i>,
<b>264</b>, DOI: 10.1016/j.conbuildmat.2020.120271.
[11] B.S. Mohammed, et al. (2019), “Optimization and
characterization of cast in-situ alkali-activated pastes by response
surface methodology”, <i>Construction and Building Materials</i>, <b>225</b>,
pp.776-787.
[12] J.F. Rivera, et al. (2019), “Synthesis of alkaline cements
based on fly ash and metallurgic slag: optimisation of the SiO<sub>2</sub>/Al<sub>2</sub>O<sub>3</sub>
and Na<sub>2</sub>O/SiO<sub>2</sub> molar ratios using the response surface methodology”,
<i>Construction and Building Materials</i>, <b>213</b>, pp.424-433.
[13] Vietnamese National Standard, TCVN 10302:2014 (2014),
<i>Activity Admixture - Fly Ash for Concrete, Mortar and Cement</i>.
[14] European Standard, EN196-1 (2006), <i>Methods of Testing </i>
<i>Cement - Part 1: Determination of Strength</i>, pp.1-33.
[15] ASTM International, ASTM C230/C230M-20 (2020),
<i>Standard Specification for Flow Table for Use in Tests of Hydraulic </i>
<i>Cement</i>.
[16] J.K. Prusty and B. Pradhan (2020), “Multi-response
optimization using Taguchi-Grey relational analysis for composition
of fly ash-ground granulated blast furnace slag-based composition of
fly ash-ground granulated blast furnace slag based”, <i>Construction and </i>
<i>Building Materials</i>,<b>241</b>, DOI: 10.1016/j.conbuildmat.2020.118049.
[17] M.F. Zawrah, et al. (2018), “Optimization of slag content and
properties improvement of Metakaolin-slag geopolymer mixes”, <i>The </i>
<i>Open Materials Science Journal</i>, <b>12</b>, pp.40-57.
[18] J.J. Thomas, et al. (2012), “Density and water content of
nanoscale solid C-S-H formed in alkali-activated (AAS) paste and
implications for chemical shrinkage”, <i>Cement and Concrete Research</i>,
<b>42</b>, pp.377-383.
</div>
<!--links-->