- Trang chủ >>
- Mầm non - Tiểu học >>
- Lớp 2
Sustainability assessment of community-based water resource management of irrigation systems for agriculture
Bạn đang xem bản rút gọn của tài liệu. Xem và tải ngay bản đầy đủ của tài liệu tại đây (942.27 KB, 7 trang )
<span class='text_page_counter'>(1)</span><div class='page_container' data-page=1>
<i><b>EnvironmEntal SciEncES </b></i>|<i> Climatology</i>
<b>Introduction</b>
The ever increasing water demand of communities has
caused serious problems in water resource management.
Because there are many methods of water resource
management, assessments of the sustainability of a
particular scheme of water resource management are of
great importance. A meaningful assessment can help a
policymaker select the most suitable method to apply to
water resource management.
A large number of rural areas around the world, mainly
in developing countries, have applied various models of
CbWM. Nevertheless, retaining CbWM sustainability has
faced difficulties due to lack of the continuous provision of
the necessary technical, financial, and social resources from
the responsible stakeholders. In several circumstances, the
development of a number of community organizations has
contributed to CbWM sustainability, which is the key role of
community in the process of policy-making [1].
Community participation in the process of water resource
management is considered as an inevitable rule. According to
F. Molle (2005), CbWRM is a participatory process in which
the community is the centre of an effective water management
system. From planning to operating to maintaining the water
supply system, the community is responsible for the resource
from which they benefit. This engagement can be both
considered as a tool for better management or as a process for
community empowerment [2] as it can be established under a
consumer association, by community action groups in urban
areas, or by water-user groups and irrigation cooperatives in
rural areas [3]. The capacity of the community in CbWRM
is strongly emphasized in Madeleen (1998) [4]. This study
addressed the potential for technical, labour, and financial
contributions, as well as community support in the planning
process, implementation, and sustainable maintenance of a
water supply system. The work also demonstrated that the
community has a decisive role in resolving contradiction and
<b>Sustainability assessment of community-based </b>
<b>water resource management of irrigation </b>
<b>systems for agriculture</b>
<b>Huynh Thi Lan Huong1*<sub>, Pham Ngoc Anh</sub>2</b>
<i>1<sub>Vietnam Institute of Meteorology, Hydrology and Climate change, Vietnam</sub></i>
<i>2<sub>Ministry of Natural Resources and Environment, Vietnam</sub></i>
Received 20 August 2020; accepted 5 November 2020
<i> </i>
<i>*Corresponding author: Email: </i>
<i><b>Abstract:</b></i>
<b>To study community-based water resource </b>
<b>management (CbWRM) of irrigation for agriculture, </b>
<b>the participation of the community in the management </b>
<b>of the irrigation system must be considered. CbWRM </b>
<b>is the cooperation between a farming organization </b>
<b>(the water-using cooperative group) and </b>
<b>state-related organizations (such as the Department of </b>
<b>Water Resources Management and commune-level </b>
<b>authorities) in the process of the operation and </b>
<b>management of water. In the CbWRM model, the </b>
<b>community participates in the selection and election </b>
<b>of the management board, meetings to collect ideas to </b>
<b>build a CbWRM model, and financial contributions to </b>
<b>water use fees. The community also participates in the </b>
<b>annual operational planning of water use. Therefore, </b>
<b>this study aimed to develop indicators to assess the </b>
<b>sustainability of the CbWRM model of irrigation for </b>
<b>agriculture in the Hau Giang province, Vietnam. With </b>
<b>an assessment result of 0.54 (relatively sustainable), </b>
<b>this study shows a picture of water resource </b>
<b>management in general and community participation </b>
<b>in particular. These research results can help managers </b>
<b>and policymakers promote community participation to </b>
<b>achieve high-efficiency water resource management in </b>
<b>the agriculture of the Hau Giang province.</b>
<i><b>Keywords: </b></i><b>agriculture, community-based, irrigation </b>
<b>system, water resource management.</b>
<i><b>Classification number:</b></i><b>5.2</b>
</div>
<span class='text_page_counter'>(2)</span><div class='page_container' data-page=2>
conflicts in the use, exploitation, and sustainability of water
resource management [4].
In Vietnam, according to Viet Dung Nguyen, et al. (2006)
[5], community participation in water resource management
has a long history, especially around the northern and
southern deltas. There are two basic approaches of water
resource management. The first considers water as a
common property. This approach is common in the upland
and mountainous areas and in some lowlands of Vietnam.
The second approach considers water as a commodity. Such
an approach pays attention to the multiple purposes of water
such as for agriculture, domestic use, aquaculture, industry,
and services. This approach was taken by the Participatory
Irrigation Management (PIM), which was applied in
Vietnam in the early 1990s after the government officially
decided to transfer agricultural land use rights to households.
This is seen as an effective method for CbWRM because
the communities are involved as water users, managers,
and protectors of water resources, especially for
small-scale irrigation systems. The PIM has been experimentally
applied in many provinces such as Tuyen Quang, Bac Kan,
Thanh Hoa, Nghe An, Quang Tri, Quang Ngai, Binh Dinh,
and Hau Giang.
According to I. Juwana, et al. (2010) [6], a great number
of indicators of water resource sustainability have been
deployed in numerous countries such as the Canadian
Water Sustainability Index (CWSI), Water Poverty Index,
Watershed Sustainability Index (WSI), and West Java Water
Sustainability Index (WJWSI). All of these indicators aim
to provide the current condition of a water resource and
generate inputs for policymakers to prioritize water issues.
I. Juwana, et al. (2012) [7] has proposed a list of six
sub-component indicators for accessing water resource
sustainability. Based on the literature review of
indicator-based water sustainability in this study, water stakeholders
can apply and customize existing indicators and/or develop
new indicators. From these indicators, the community can
learn about their current water resource situation and which
element can improve its condition. In addition, the water
sustainability indicators can support policymakers during
the process of prioritization of problems, challenges, and
water resource programs.
In a study by P. Kamalesh, et al. [8], a framework based
on technical, environmental, financial and institutional
criteria was developed. Similar to the above study [7], Tier
I indicators were described through several component
indicators. The author also provides weights for each Tier
I indicator and the lower tier indicators, which make the
water sustainability assessment process more accurate
and reasonable. The weights were determined based on
interviews and consultations with experts in sustainable
water resource development. The information obtained was
integrated into the scoring system to help evaluate whether
the project under consideration was sustainable. The score
was divided into 3 types: sustainable, partly sustainable, and
unsustainable.
Richter, et al. (2018) [9] developed a set of indicators for
assessing the sustainability of urban water supply systems
including: (1) governance of water resource and its role;
(2) preparedness for droughts and other capabilities for
emergency response; (3) monitoring of water resources;
(4) capacity to pay for water resources and social justice;
(5) efficiency and conservation in water usage and water
quality; and (6) protection of the watershed. The indicators
presented in this work supports cities with improving the
sustainability of their water supply systems. While it is
straightforward to quantify and evaluate the subcomponents
of these indicators, in some cases subjective judgement
and ultimate weighting are needed. In order to enhance the
service reliability, financial viability, customer satisfaction,
and environmental health, these indicators can be evaluated
and tracked by utilities over time.
Popawala and Shah (2011) [10] provided a set of
indicators to evaluate the sustainability of an urban water
management system, including primary, secondary, and
first-level indicators that encompass social, economic,
environmental, and technical aspects [10]. The second-level
indicators include, for example, population with access
to water supply, sewage, rainwater, investment capital,
maintenance costs and repair, daily water supply per person,
per capita water production waste per day, covered pipe
area, and energy consumption. In addition, the authors also
weighted the indicators for levels 1 and 2 based on expert
opinions combined with findings from field surveys.
In Vietnam, a variety sustainable assessment methods
have been proposed and applied. In the study of [11], the
authors analysed the social elements of model management
in terms of community participation. The authors used six
key indicators: (1) water sustainability; (2) sustainability
of the project; (3) community participation; (4) technology
sustainability; (5) sustainable financial economy; and (6)
organizational sustainability.
</div>
<span class='text_page_counter'>(3)</span><div class='page_container' data-page=3>
<i><b>EnvironmEntal SciEncES </b></i>|<i> Climatology</i>
Viet Dung Nguyen, et al. (2006) [5] explained the concept
of a sustainable water resource management model. It has
been said that community participation is very diverse both
in form and level, so it is difficult to say which model is the
best overall because each one corresponds to a community
with specific populational, geographical, institutional, and
cultural characteristics. Therefore, in order to consider the
success of a sustainable CbWRM model, specific criteria
and indicators are needed.
Within the framework of this study, the authors aim to
develop a set of indicators to evaluate the sustainability
of CbWRM models at the local level. The results of the
evaluation will help managers identify priority issues and
devise strategies, plans, and action programs to balance
factors in the process of developing a specific model of
CbWRM.
The Hau Giang province was selected for study. A survey
of irrigation in Hau Giang showed that there is a
community-based model in their agriculture known as “water use
cooperatives”, which is a form of PIM. This approach to
CbWRM of irrigation for agriculture in Hau Giang can be
described as follows:
First, the Government invests in an electric pumping
station. Through the Provincial Department of Irrigation
and the commune authorities, the government assigns a
water cooperative group (WCG) to manage and operate the
system. The WCG develops the plans to pump water and
collect fees from the households. All villagers participated
in the selection of a management board and meetings to
collect ideas to develop the system. The villagers also paid
water use fees and participated in the meetings for annual
operational planning.
According to the survey, the model in place at Hau
Giang has significant economic benefits such as reduced
investment costs, increased productivity, and profits. The
second-most significant benefit is social benefits such as
to stabilize people’s lives and increase their connectivity
in the community. However, most of models only work
for a short time (2 years), so it will take time for people
to get used to using and managing the system. The model
is based on an existing irrigation infrastructure that did
not involve the community from the beginning and thus
they did not participate in the planning, designing, and
construction stages. The community was only involved in
the management.
<b>Methodology and data</b>
<i><b>Methodology</b></i>
To assess the sustainability of CbWRM of irrigation for
agriculture in Hau Giang, the research team used several
methods: (1) data collection and social surveys; (2) expert
consultation; and (3) a set of indicators to evaluate the
sustainability.
<i><b>Data collection, social surveys</b></i>
The data included information related to community
participation in irrigation works; ability and willingness
to pay for irrigation services of community; information
related to economic, technical, and environmental factors,
and benefits of water supply services. A questionnaire was
used and applied to the communities (people living in the
area) and managers. The details of the application of this
method are described below.
<i>Expert consultation:</i>
Experts were consulted to determine the weights of the
Tier I and Tier II indicators to serve the assessment of the
sustainability CbWRM in the study area.
<i>Development of the set of indicators:</i>
A set of indicators was developed based on the following
criteria:
- Comprehensive: the indicators should provide
an overview and capture the multidimensional nature
of sustainable state management community models.
Sustainability aspects need to be assessed for each type of
model.
- Simplicity: the indicators must be simple enough to
facilitate data collection, analysis, and evaluation.
- Clarity: the indicators must be clearly defined and given
specific calculation instructions.
- Availability: the given indicators should be consistent
with the data available to collect and assess. This will
contribute to time and cost saving during the evaluation.
However, it should be noted that when data collection
and evaluation are not available, it is necessary to ensure
reasonable data collection time and cost.
- Relevance: the indicators will be compatible with the
objectives of the national and local strategies and master
plans.
To develop the set of indicators, five steps were followed:
Step 1: develop the frame of indicators
</div>
<span class='text_page_counter'>(4)</span><div class='page_container' data-page=4>
Step 2: selection of Tier I and Tier II indicators
The selection of Tier I and II indicators needs to follow
certain criteria: (1) feasibility of the data; (2) simplicity
of data; and (3) validity of the data. From the frame of
indicators developed in Step 1, the research team set up a
common set of indicators (level 1) for irrigation water supply
in agriculture (Table 1).
<b>Table 1. Set of indicators to assess the sustainability of CbWRM.</b>
<b>Tier I </b>
<b>indicators</b> <b>Tier II indicators</b> <b>Sources of data</b>
<i><b>Social </b></i>
<i><b>indicator</b></i>
Conflict possibility in using water resources From survey data
The level of community participation in
developing model From survey data
The level of community involvement in
operating the model From survey data
The level of community participation in
maintenance / repairing model From survey data
The level of community participation compared
to the model design From survey data
The level of community participation in the
financial decisions of the model From survey data
Service complaints regarding the model From survey data
Qualifications of managers and operators of
model From survey data
Percentage of model managers and operators
who participate in technical training and
operational management From survey data
The percentage of people participating in
technical training on how to operate and use
the model From survey data
Executive board of the model From survey data
<i><b>Technical </b></i>
<i><b>indicator</b></i>
Degree of meeting the demand of using water in
agricultural production From survey data
Access ability to water resources From hydro-<sub>meteorological data</sub>
Water quality From environmental <sub>data</sub>
Frequency of malfunctioning of models Survey data from the <sub>irrigation company</sub>
The frequency of periodic maintenance of the
model Survey data from the irrigation company
The rate of water loss Survey data from the <sub>irrigation company</sub>
<i><b>Environmental </b></i>
<i><b>indicator</b></i>
Possibility of the influence of the natural
environment on the model From environmental data
Risk of natural environmental pollution from
the model From environmental data
<i><b>Economic </b></i>
<i><b>indicator</b></i>
Capital for developing models Survey data from the <sub>irrigation company</sub>
Capital for operating the model Survey data from the <sub>irrigation company</sub>
Capital for model maintenance/repair. Survey data from the <sub>irrigation company</sub>
Step 3: collecting data
After setting up the indicators, the data is collected. This
data is very important and helpful for the calculation.
Step 4: calculating the sustainable index
The sustainability index (SI) of the CbWRM is calculated
directly through the values of the four Tier I indicators:
economic, social, environmental, and technical by Eq. (1):
10
Step 3: collecting data
After setting up the indicators, the data is collected. This data is very
important and helpful for the calculation.
Step 4: calculating the sustainable index
The sustainability index (SI) of the CbWRM is calculated directly through
the values of the four Tier I indicators: economic, social, environmental, and
technical by Eq. (1):
Sustainable Index ( S. I) = ∑ Mi Wi<b> </b> <b> </b>(1)
where Mi is the normalized value of a Tier I indicator number <i>i</i>; Wi is the weight
of Tier I indicator number <i>i</i>; and m is number of Tier I indicators.
The value Mi of a Tier I indicator number <i>i</i> is calculated based on the Tier II
indicators by Eq. (2):
Mi = <b> </b> <b> </b>(2)
where Xij is the normalized value of a Tier II indicator number <i>j</i> and N is the
number of the Tier II indicator <i>i</i> that belongs to the Tier I indicator.
As each Tier II indicator is calculated in different units, it is necessary to
calibrate each of these indicators to the same standard system [13].
(+) If the value of a Tier II indicator is proportional to vulnerability, then Eq.
(3) will be applied to normalize its value:
Xij = <b> </b> <b> </b> <b> </b>(3)
where <i>s </i>isa Tier II indicator; <i>smin</i> is the minimum value of a Tier II indicator, and
<i>smax</i> is the maximum value of a Tier II indicator.
(+) On the other hand, if the value of a Tier II indicator is inversely
proportional to vulnerability, then the value will be normalized by Eq. (4):
Xij = <b> </b>(4)
*
10
Step 3: collecting data
After setting up the indicators, the data is collected. This data is very
important and helpful for the calculation.
Step 4: calculating the sustainable index
The sustainability index (SI) of the CbWRM is calculated directly through
the values of the four Tier I indicators: economic, social, environmental, and
technical by Eq. (1):
Sustainable Index ( S. I) = ∑ Mi Wi<b> </b> <b> </b>(1)
where Mi is the normalized value of a Tier I indicator number <i>i</i>; Wi is the weight
of Tier I indicator number <i>i</i>; and m is number of Tier I indicators.
The value Mi of a Tier I indicator number <i>i</i> is calculated based on the Tier II
indicators by Eq. (2):
Mi = <b> </b> <b> </b>(2)
where Xij is the normalized value of a Tier II indicator number <i>j</i> and N is the
number of the Tier II indicator <i>i</i> that belongs to the Tier I indicator.
As each Tier II indicator is calculated in different units, it is necessary to
calibrate each of these indicators to the same standard system [13].
(+) If the value of a Tier II indicator is proportional to vulnerability, then Eq.
(3) will be applied to normalize its value:
Xij = <b> </b> <b> </b> <b> </b>(3)
where <i>s </i>isa Tier II indicator; <i>smin</i> is the minimum value of a Tier II indicator, and
<i>smax</i> is the maximum value of a Tier II indicator.
(+) On the other hand, if the value of a Tier II indicator is inversely
proportional to vulnerability, then the value will be normalized by Eq. (4):
Xij = <b> </b>(4)
(1)
where Mi is the normalized value of a Tier I indicator
number <i>i</i>; W<sub>i</sub> is the weight of Tier I indicator number <i>i</i>; and
m is number of Tier I indicators.
The value Mi of a Tier I indicator number <i>i</i> is calculated
based on the Tier II indicators by Eq. (2): <b> </b>
<b> </b>
10
Step 3: collecting data
After setting up the indicators, the data is collected. This data is very
important and helpful for the calculation.
Step 4: calculating the sustainable index
The sustainability index (SI) of the CbWRM is calculated directly through
the values of the four Tier I indicators: economic, social, environmental, and
technical by Eq. (1):
Sustainable Index ( S. I) = ∑ Mi Wi<b> </b> <b> </b>(1)
where Mi is the normalized value of a Tier I indicator number <i>i</i>; Wi is the weight
of Tier I indicator number <i>i</i>; and m is number of Tier I indicators.
The value Mi of a Tier I indicator number <i>i</i> is calculated based on the Tier II
indicators by Eq. (2):
Mi = <b> </b> <b> </b>(2)
where Xij is the normalized value of a Tier II indicator number <i>j</i> and N is the
number of the Tier II indicator <i>i</i> that belongs to the Tier I indicator.
As each Tier II indicator is calculated in different units, it is necessary to
calibrate each of these indicators to the same standard system [13].
(+) If the value of a Tier II indicator is proportional to vulnerability, then Eq.
(3) will be applied to normalize its value:
Xij = <b> </b> <b> </b> <b> </b>(3)
where <i>s </i>isa Tier II indicator; <i>smin</i> is the minimum value of a Tier II indicator, and
<i>smax</i> is the maximum value of a Tier II indicator.
(+) On the other hand, if the value of a Tier II indicator is inversely
proportional to vulnerability, then the value will be normalized by Eq. (4):
Xij = <b> </b>(4)
(2)
where X<sub>ij</sub> is the normalized value of a Tier II indicator
number <i>j</i> and N is the number of the Tier II indicator <i>i</i> that
belongs to the Tier I indicator.
As each Tier II indicator is calculated in different units,
it is necessary to calibrate each of these indicators to the
same standard system [13].
(+) If the value of a Tier II indicator is proportional to
vulnerability, then Eq. (3) will be applied to normalize its
value:
10
Step 3: collecting data
After setting up the indicators, the data is collected. This data is very
important and helpful for the calculation.
Step 4: calculating the sustainable index
The sustainability index (SI) of the CbWRM is calculated directly through
the values of the four Tier I indicators: economic, social, environmental, and
technical by Eq. (1):
Sustainable Index ( S. I) = ∑ Mi Wi<b> </b> <b> </b>(1)
where Mi is the normalized value of a Tier I indicator number <i>i</i>; Wi is the weight
of Tier I indicator number <i>i</i>; and m is number of Tier I indicators.
The value Mi of a Tier I indicator number <i>i</i> is calculated based on the Tier II
indicators by Eq. (2):
Mi = <b> </b> <b> </b>(2)
where Xij is the normalized value of a Tier II indicator number <i>j</i> and N is the
number of the Tier II indicator <i>i</i> that belongs to the Tier I indicator.
As each Tier II indicator is calculated in different units, it is necessary to
calibrate each of these indicators to the same standard system [13].
(+) If the value of a Tier II indicator is proportional to vulnerability, then Eq.
(3) will be applied to normalize its value:
Xij = <b> </b> <b> </b> <b> </b>(3)
where <i>s </i>is a Tier II indicator; <i>smin</i> is the minimum value of a Tier II indicator, and
<i>smax</i> is the maximum value of a Tier II indicator.
(+) On the other hand, if the value of a Tier II indicator is inversely
proportional to vulnerability, then the value will be normalized by Eq. (4):
Xij = <b> </b><sub>10 </sub> (4)
Step 3: collecting data
After setting up the indicators, the data is collected. This data is very
important and helpful for the calculation.
Step 4: calculating the sustainable index
The sustainability index (SI) of the CbWRM is calculated directly through
the values of the four Tier I indicators: economic, social, environmental, and
technical by Eq. (1):
Sustainable Index ( S. I) = ∑ Mi Wi<b> </b> <b> </b>(1)
where Mi is the normalized value of a Tier I indicator number <i>i</i>; Wi is the weight
of Tier I indicator number <i>i</i>; and m is number of Tier I indicators.
The value Mi of a Tier I indicator number <i>i</i> is calculated based on the Tier II
indicators by Eq. (2):
Mi = <b> </b> <b> </b>(2)
where Xij is the normalized value of a Tier II indicator number <i>j</i> and N is the
number of the Tier II indicator <i>i</i> that belongs to the Tier I indicator.
As each Tier II indicator is calculated in different units, it is necessary to
calibrate each of these indicators to the same standard system [13].
(+) If the value of a Tier II indicator is proportional to vulnerability, then Eq.
(3) will be applied to normalize its value:
Xij = <b> </b> <b> </b> <b> </b>(3)
where <i>s </i>isa Tier II indicator; <i>smin</i> is the minimum value of a Tier II indicator, and
<i>smax</i> is the maximum value of a Tier II indicator.
(+) On the other hand, if the value of a Tier II indicator is inversely
proportional to vulnerability, then the value will be normalized by Eq. (4):
Xij = <b> </b>(4)
10
Step 3: collecting data
After setting up the indicators, the data is collected. This data is very
important and helpful for the calculation.
Step 4: calculating the sustainable index
The sustainability index (SI) of the CbWRM is calculated directly through
the values of the four Tier I indicators: economic, social, environmental, and
technical by Eq. (1):
Sustainable Index ( S. I) = ∑ Mi Wi<b> </b> <b> </b>(1)
where Mi is the normalized value of a Tier I indicator number <i>i</i>; Wi is the weight
of Tier I indicator number <i>i</i>; and m is number of Tier I indicators.
The value Mi of a Tier I indicator number <i>i</i> is calculated based on the Tier II
indicators by Eq. (2):
Mi = <b> </b> <b> </b>(2)
where Xij is the normalized value of a Tier II indicator number <i>j</i> and N is the
number of the Tier II indicator <i>i</i> that belongs to the Tier I indicator.
As each Tier II indicator is calculated in different units, it is necessary to
calibrate each of these indicators to the same standard system [13].
(+) If the value of a Tier II indicator is proportional to vulnerability, then Eq.
(3) will be applied to normalize its value:
Xij = <b> </b> <b> </b> <b> </b>(3)
where <i>s </i>isa Tier II indicator; <i>smin</i> is the minimum value of a Tier II indicator, and
<i>smax</i> is the maximum value of a Tier II indicator.
(+) On the other hand, if the value of a Tier II indicator is inversely
proportional to vulnerability, then the value will be normalized by Eq. (4):
Xij = <b> </b>(4)
(3)
where <i>s </i>isa Tier II indicator; <i>s<sub>min</sub></i> is the minimum value of a
Tier II indicator, and <i>s<sub>max</sub></i> is the maximum value of a Tier II
indicator.
(+) On the other hand, if the value of a Tier II indicator
is inversely proportional to vulnerability, then the value will
be normalized by Eq. (4):
10
Step 3: collecting data
After setting up the indicators, the data is collected. This data is very
important and helpful for the calculation.
Step 4: calculating the sustainable index
The sustainability index (SI) of the CbWRM is calculated directly through
the values of the four Tier I indicators: economic, social, environmental, and
technical by Eq. (1):
Sustainable Index ( S. I) = ∑ Mi Wi<b> </b> <b> </b>(1)
where Mi is the normalized value of a Tier I indicator number <i>i</i>; Wi is the weight
of Tier I indicator number <i>i</i>; and m is number of Tier I indicators.
The value Mi of a Tier I indicator number <i>i</i> is calculated based on the Tier II
indicators by Eq. (2):
Mi = <b> </b> <b> </b>(2)
where Xij is the normalized value of a Tier II indicator number <i>j</i> and N is the
number of the Tier II indicator <i>i</i> that belongs to the Tier I indicator.
As each Tier II indicator is calculated in different units, it is necessary to
calibrate each of these indicators to the same standard system [13].
(+) If the value of a Tier II indicator is proportional to vulnerability, then Eq.
(3) will be applied to normalize its value:
Xij = <b> </b> <b> </b> <b> </b>(3)
where <i>s </i>is a Tier II indicator; <i>smin</i> is the minimum value of a Tier II indicator, and
<i>smax</i> is the maximum value of a Tier II indicator.
(+) On the other hand, if the value of a Tier II indicator is inversely
proportional to vulnerability, then the value will be normalized by Eq. (4):
Xij = <b><sub> </sub> </b><sub>(4)</sub> (4)
where <i>s</i> is a Tier II indicator; <i>s<sub>min</sub></i> is the minimum value of
a Tier II indicator; and <i>s<sub>max</sub></i> is the maximum value of a Tier
II indicator.
- Step 5: sustainability assessment
</div>
<span class='text_page_counter'>(5)</span><div class='page_container' data-page=5>
<i><b>EnvironmEntal SciEncES </b></i>|<i> Climatology</i>
SI: ≥0.7-1 : sustainable
SI: ≥0.5-0.7 : relatively sustainable
SI: <0.5 : not sustainable
<i>Delphi method:</i>
The Delphi method was conducted in the study to select
indicators and the weights of the indicators. In the practical
application of the Delphi method, the authors followed the
following steps:
1. Define the purpose of selecting indicators and
evaluating weights of indicators to assess the sustainability
of the CbWRM in Hau Giang.
2. Select a team of 10 experts with solid knowledge
and interest in the field of water resources in particular and
natural resources and environment in genera.
3. Establish level I and level II indicators, assign initial
values of weights to level I indicators and send to each
member of the expert group.
4. The feedback results from each expert are collected,
tabulated, and summarized.
5. Summary of the results sent back to experts for
comments to emphasize opposing, extreme, or special
opinions different from the majority.
6. Experts have the option to revise their previous
estimates after reviewing information received from other
(unnamed) members.
7. Repeat steps 3 through 5 until there are no longer any
significant changes (i.e. the experts reach an agreement).
The results of the Tier I indicator weights identified
based on the Delphi method are summarized in Table 2.
<b>Table 2. Tier I indicator weights.</b>
<i><b>No</b></i> <b>Weight before Delphi</b> <b>Weight after Delphi</b>
<i><b>Tier I indicators</b></i> <i><b>Weight</b></i> <i><b>Tier I indicators</b></i> <i><b>Weight</b></i>
1 Social 0.25 Social 0.28
2 Economic 0.25 Economic 0.24
3 Environmental 0.25 Environmental 0.24
4 Technical 0.25 Technical 0.24
<i><b>Data</b></i>
To collect the data, the authors conducted a survey in the
study area and had meetings with representatives from the
Department of Agriculture and Rural Development as well
as the Department of Natural Resources and Environment,
Centre for Rural Water Supply and Sanitation in Hau Giang
and interviewed people from the Hoa Luu commune, Vi
Thanh city, Hau Giang province.
Information collected during the survey in Hau Giang
to serve for the development and calculation of indicators
includes:
- The model of CbWRM in Hau Giang in the field of
irrigation in agriculture.
- Local policies and mechanisms related to the model
of CbWRM in Hau Giang in the field of irrigation in
agriculture.
- The technical parameters of the model of CbWRM in
Hau Giang in the field of irrigation in agriculture.
- Construction investment capital and recurring expenses
for the model of CbWRM in Hau Giang in the field of
irrigation in agriculture.
- People’s participation in the operation of the model
of CbWRM in Hau Giang in the field of irrigation in
agriculture.
- The operation of the model of CbWRM in the field of
irrigation in Hau Giang agriculture.
- The limitations of the model of CbWRM in the field of
irrigation in Hau Giang agriculture.
- Benefits that the model of CbWRM in the field of
irrigation in Hau Giang agriculture.
- Assessing the effectiveness of each model of CbWRM
of irrigation in Hau Giang agriculture.
- Proposing how to sustainably develop the model of
CbWRM of irrigation in agriculture in Hau Giang.
The required data are described in the questionnaire
of both levels (managers and communities). These data
include: the specifications of the model; information related
to investment capital and periodic model costs; how the
model works; people’s participation in the operation of the
model; benefits and limitations that the model brings along
with its socio-economic-environmental impacts; and the
effectiveness of each model and information on the proposal
to replicate an effective model. Data on policy mechanisms
are directly consulted with local leaders. The survey sites
were carefully considered by the method of overview
and direct consultation with local leaders, from which the
locations for each agriculture field in Hau Giang province
was identified.
</div>
<span class='text_page_counter'>(6)</span><div class='page_container' data-page=6>
Agriculture and Rural Development of Hau Giang province;
the Center for Rural Water Supply and Sanitation in Hau
Giang province; and interviewed people from the Hoa Luu
commune, Vi Thanh city, Hau Giang province.
The total number of questionnaires was 200, of which 100
were for managers and 100 were for people in Hau Giang. The
questionnaire was built based on the purpose of the survey,
the subject matter investigated, and the scope of the survey.
The questionnaire forms for managers and communities
are shown in Annex 1 and Annex 2. Data collected during
the survey was analysed and synthesized by simple
statistical methods (e.g. aggregating data, averaging, etc.).
<b>Results and discussion</b>
This study developed 4 Tier I indicators (social, economic,
environmental, and technical) and 22 Tier II indicators.
They were applied to assess the sustainability of CbWRM
for agriculture in Hau Giang. The results are summarized in
Table 3.
<b>Table 3. The value of Tier II indicators.</b>
<b>Tier I indicators</b> <b>Tier II indicators</b> <b>Value</b>
<i><b>Social indicator</b></i>
Conflict possibility in using water resources 0.33
The level of community participation in developing model 0.00
The level of community involvement in operating the model 0.50
The level of community participation in maintenance /
repairing model 0.89
The level of community participation compared to the model
design 1.00
The level of community participation in the financial decisions
of the model 0.50
Service complaints regarding the model 0.50
Qualifications of managers and operators of model 1.00
Percentage of model managers and operators who participate
in technical training and operational management 1.00
The percentage of people participating in technical training on
how to operate and use the model 1.00
Executive board of the model 0.10
<i><b>Technical </b></i>
<i><b>indicator</b></i>
Degree of meeting the demand of using water in agricultural
production 1.00
Access ability to water resources 1.00
Water quality 0.00
Frequency of malfunctioning of models 1.00
The level of periodic maintenance of the model 0.50
The rate of water loss 0.10
<i><b>Environment </b></i>
<i><b>indicator</b></i>
Possibility of the influence of the natural environment on the
model 0.50
Risk of natural environmental pollution from the model 0.50
<i><b>Economic </b></i>
<i><b>indicator</b></i>
Capital for developing models 0.00
Capital for operating the model 1.00
Capital for model maintenance/repair. 1.00
The final result of sustainability assessment for CbWRM
model of irrigation for agriculture in Hau Giang province
are shown in Table 4.
<b>Table 4. The results of sustainability assessment.</b>
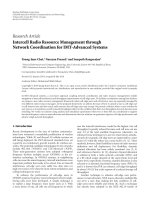
<b>Tier I indicators</b> <b>Value of Tier I <sub>indicators</sub></b> <b>Weight of Tier I <sub>indicators</sub></b> <b>Final value</b> <b>Sustainable <sub>Index</sub></b>
Social (A) 0.58 0.28 0.16
0.54
Technical (B) 0.75 0.24 0.18
Environment (C) 0.50 0.24 0.12
Economy (D) 0.33 0.24 0.08
This result shows the superiority of the closed model
design, which has been implemented in many provinces and
cities nationwide. The design and financial participation in
the construction investment, as well as major repairs of the
irrigation system, were carried out by state agencies without
the participation of the community.
The overall sustainability assessment result of 0.54 is
considered “relatively sustainable”. This shows that the model
is in the early stages of formation and many factors, especially
issues related to community, need to be improved (Fig. 1).
<b>Fig. 1. Sustainability assessment. </b>
</div>
<span class='text_page_counter'>(7)</span><div class='page_container' data-page=7>
<i><b>EnvironmEntal SciEncES </b></i>|<i> Climatology</i>
efficiency of the irrigation system, and increased agricultural
output. Such a model should be comprehensively studied in
order to apply to the entire Mekong delta and other regions
across the country. However, it is necessary to solve the
shortcomings arising from what is currently happening in
Hau Giang. The problems identified in the sustainability
assessment need to be addressed before replicating the
model. There is a particular need for a gradual enhancement
of community participation, not only in management, but
also in investment and system design. One of the factors
essential to the development and replication of the model is
the issue of capital investment in infrastructure and policy
institutions.
<b>Conclusions</b>
CbWRM of irrigation for agriculture is a typical
system found in Vietnam. While it is a relatively new
type of system, CbWRM has shown its role to the local
community. The entire community should engage in the
system by participating in the following activities: selection
of management boards, community meetings to collect
ideas for developing the system, paying water use fees, and
participating in relevant meetings for developing an annual
operation plan.
This study introduced a set of indicators to evaluate the
sustainability of the CbWRM. The set of indicator includes
four Tier I indicators: social, technical, environment, and
economy. Each indicator had Tier II indicators to assess the
sustainability of CbWRM for agriculture practice.
On the basis of the evaluation results, it was possible to
identify factors affecting the sustainability of the model to
support managers in making appropriate adjustments. The
results of this study can be extended to other regions in the
Mekong delta, and the whole country, to evaluate existing
models and propose appropriate adjustments.
<b>COMPETING INTERESTS </b>
The authors declare that there is no conflict of interest
regarding the publication of this article.
<b>REFERENCES</b>
[1] Anna V.M. Machado, João A.N. dos Santos, Lucas M.C. Alves,
Norbertho da S. Quindeler (2019), “Contributions of organizational
levels in community management models of water supply in rural
communities: cases from Brazil and Ecuador”, <i>Water</i>, <b>11(3)</b>, DOI:
10.3390/w11030537.
[2] F. Molle (2005), “Irrigation and water policies in the Mekong
region: current discourses and practices Colombo, Sri Lanka”, <i>IWMI </i>
(Research report 95), 43pp.
[3] Cap-Net (2014), <i>IWRM as a Tool for Adaptation to Climate </i>
<i>Change</i>,128pp<i>.</i>
[4] W.S. Madeleen (1998), <i>Community Management Models </i>
<i>for Small Scale Water Supply Systems</i>, IRC International Water and
Sanitation Center.
[5] Viet Dung Nguyen, Danh Tinh Nguyen (2006), <i></i>
<i>Community-based Water Resources Management in Vietnam - Experience and </i>
<i>Success Models</i>.
[6] I. Juwana, B. Perera, N. Muttil (2010), “A water sustainability
index for West Java. Part 1: developing the conceptual framework”,
<i>Water Sci. Technol.</i>, <b>62(7)</b>, pp.1629-1640.
[7] I. Juwana, N. Muttil, B.J.C. Perera (2012), <i>Indicator - Based </i>
<i>Water Sustainability Assessment - A review.</i>
[8] P. Kamalesh and B. Shashi (2008), <i>A Framework to Assess </i>
<i>Sustainability of Community-based Water Projects Using </i>
<i>Multi-criteria Analysis.</i>
[9] Brian D. Richter, et al. (2018), “Assessing the sustainability
of urban water supply systems, February 2018”, <i>Journal - American </i>
<i>Water Works Association</i>, <b>110(2)</b>, pp.40-47.
[10] Reena Popawala and N.C. Shah (2011), <i>Evaluation of </i>
<i>Sustainability Index for Urban Water Management System, </i>2nd
International conference on environmental science and development
IPCBEE, Press, Singapore.
[11] Thai Dat Hoang, et al. (2007), “Assessing the sustainability
of clean water supply systems in Bac Giang province”, <i>Technical </i>
<i>Journal of Irrigation and Environment</i>, ISSN: 1859-3941.
[12] Thi Lan Huong Nguyen (2010), <i>Doctoral Dissertation Study </i>
<i>on Community-based Management Forms of Centralized Water </i>
<i>Supply Works in Rural Vietnam</i>, Code No: 62.31.10.01, National
Economics University, Ha Noi.
[13] Thi Lan Huong Huynh, Anh Tien Do, Trang Minh Dao
(2020), “Climate change vulnerability assessment for Can Tho city
by a set of indicators”, <i>International Journal of Climate Change </i>
<i>Strategies and Management</i>, <b>12(1), pp.147-158, DOI: 10.1108/</b>
</div>
<!--links-->