Bài tập tổng hợp - C23
Bạn đang xem bản rút gọn của tài liệu. Xem và tải ngay bản đầy đủ của tài liệu tại đây (1.01 MB, 7 trang )
<span class='text_page_counter'>(1)</span><div class='page_container' data-page=1>
<i>Research Article</i>
<b>Simultaneous Detection and Differentiation of</b>
<b>Highly Virulent and Classical Chinese-Type Isolation of</b>
<b>PRRSV by Real-Time RT-PCR</b>
<b>Shuqi Xiao, Yaosheng Chen, Liangliang Wang, Jintao Gao,</b>
<b>Delin Mo, Zuyong He, and Xiaohong Liu</b>
<i>State Key Laboratory of Biocontrol, School of Life Sciences, Sun Yat-sen University, Guangzhou 510006, China</i>
Correspondence should be addressed to Xiaohong Liu;
Received 24 November 2013; Accepted 15 May 2014; Published 12 June 2014
Academic Editor: Yong-Suk Jang
Copyright © 2014 Shuqi Xiao et al. This is an open access article distributed under the Creative Commons Attribution License,
which permits unrestricted use, distribution, and reproduction in any medium, provided the original work is properly cited.
Porcine reproductive and respiratory syndrome (PRRS) is a leading disease in pig industry worldwide and can result in serious
economic losses each year. The PRRS epidemic situation in China has been very complicated since the unprecedented
large-scale highly pathogenic PRRS (HP-PRRS) outbreaks in 2006. And now the HP-PRRS virus (HP-PRRSV) and classical North
American type PRRSV strains have coexisted in China. Rapid differential detection of the two strains of PRRSV is very important
for effective PRRS control. The real-time RT-PCR for simultaneous detection and differentiation of HP-PRRSV and PRRSV by
using both SYBR Green and TaqMan probes was developed and validated. Both assays can be used for rapid detection and
strain-specific identification of HP-PRRSV and PRRSV. However, the TaqMan probe method had the highest detection rate whereas the
conventional RT-PCR was the lowest. The real-time RT-PCR developed based on SYBR Green and TaqMan probe could be used
for simultaneous detection and differentiation of HP-PRRSV and PRRSV in China, which will benefit much the PRRS control and
research.
<b>1. Introduction</b>
Porcine reproductive and respiratory syndrome (PRRS) is
widely accepted as being one of the most economically
important diseases affecting swine industry [1]. In 2006 there
was an unparalleled large-scale outbreak of the so-called high
fever disease in most provinces of China that affected more
than 2,000,000 pigs, leading to concerns within the global
swine industry and in relation to public health [2–4]. In
March 2007 the disease was identified in the Hai Duong
province of Vietnam and it spread countrywide affecting
more than 65,000 pigs [5,6]. The outbreaks caused extensive
concern worldwide [7]. Studies demonstrated that highly
virulent porcine reproductive and respiratory syndrome virus
(HP-PRRSV) was the major causative pathogen of the
so-called high fever disease [2]. Genetic analysis indicated that
the HP-PRRSVs isolated from China and Vietnam shared a
discontinuous deletion of 30 aa in nonstructural protein 2
(NSP2), as compared with the North American type PRRSV
strains (NA PRRSV) [2, 5, 8]. Since 2006, the HP-PRRSV
and classical North American type PRRSV strains coexist in
China. Now PRRS epidemic situation is very complicated in
China, of which the predominant form is the HP-PRRSV.
Rapid differential detection of the two strains of PRRSV is
very important for effective PRRS control. Therefore, it is
imperative to develop an assay for simultaneous detection
and strain identification of HP-PRRSV and PRRSV.
The current immunoassay, such as
immunohistochem-istry and serological methods, cannot differentiate between
the two strains of PRRSV. Conventional RT-PCR is
time-consuming, lowly sensitive, and also prone to contamination.
The development of real-time RT-PCR technology offers the
opportunity for more rapid, sensitive, and specific detection
of virus. The current two major genotypes, the European
(EU) and the North American (US) strains, have been rapidly
identified by SYBR Green-based or TaqMan probe-based
real-time RT-PCR assay [9–11]. A specific TaqMan probe
real-time RT-PCR has been developed for assaying the HP-PRRSV
</div>
<span class='text_page_counter'>(2)</span><div class='page_container' data-page=2>
Table 1: Primers and probes used in the real-time RT-PCR and conventional RT-PCR assays.
Primers and probes Sequences (5-3) Products (bp)
HP-PRRSV PRRSV
Conventional RT-PCR NSP2-F AACACCCAGGCGACTTCA 787 874
NSP2-R GCATGTCAACCCTATCCCAC
Real-time RT-PCR NSP2-qF GTGGGTCGGCACCAGTT 85 172
NSP2-qR GACGCAGACAAATCCAGAGG
Probes
Pb-H FAM-CGCGTAGAACTGTGACAACAACGCTGA-TAMRA [12]
Pb-N HEX-AAAATTGGCTCACTCAAGGGCGTCA-TAMRA
Pb-all FAM-CACAGTTCTACGCGGTGCAGG-TAMRA
[12], but it is not able to differentially detect the HP-PRRSV
and PRRSV.
In this research, the real-time RT-PCR for simultaneous
detection and differentiation of HP-PRRSV and PRRSV by
using both SYBR Green and TaqMan probe was developed
and validated. These two methods provided alternative
diag-nostic assays in diverse PRRSV epidemiological
circum-stances.
<b>2. Materials and Methods</b>
<i>2.1. Virus Strains and Clinical Samples.</i> HP-PRRSV (GD and
XH) and PRRSV (CH-1a) virus strains were kindly supplied
by Dr. Guihong Zhang (South China Agricultural University,
China). PRRSV (CC), PRV, FPV, and FCV were kindly
provided by Laboratory Animal Center in Jilin University,
China. 39 and 477 serum samples were obtained from 6
pig farms in South China in 2008 and 2011, respectively. 15
sera as described previously were from pigs experimentally
infected with HP-PRRSV and PRRSV [13]. The viral RNA
of the virus-infected cell culture and serum was extracted
by using QIAamp Viral RNA Mini Kit according to the
manufacturer’s instruction (Qiagen). First-strand cDNA was
synthesized using the extracted total RNA and AMV Reverse
Transcriptase from Reverse Transcription System of Promega
according to the manufacturer’s instruction (Promega).
<i>2.2. PCR Primers and Probes.</i> The difference of genome
sequence between the HP-PRRSV and PRRSV was the
87-base deletion in the fixed site in NSP2 gene [2, 12]. After
aligning 20 HP-PRRSV and PRRSV strains isolated from
China and the US strain (VR-2332) sequences obtained from
the NCBI database, the NSP2 region was selected to design
an assay for discriminating between HP-PRRSV and PRRSV
strains. The differential detection based on real-time RT-PCR
using SYBR Green I and TaqMan probes was performed
employing the same primer pair (Table 1). Real-time RT-PCR
for PRRSV detection based on dual-colour TaqMan probes
was performed using strain-specific probes including a Pb-H
(only detecting HP-PRRSV strain) [12], Pb-N (only detecting
PRRSV strain), and Pb-all (simultaneously detecting both
HP-PRRSV and PRRSV strains) (Table 1).
SYBR Green I real-time PCR was carried out using SYBR
Premix Ex Taq (TaKaRa) and the LightCycler 480
Real-Time PCR System (Roche Applied Science). Amplification
was performed in a 10𝜇L reaction mixture containing 5.0𝜇L
SYBR Premix Ex Taq (2×), 0.2𝜇L of each forward
(NSP2-qF) and reverse (NSP2-qR) primer (10𝜇M), 1.5𝜇L cDNA or
plasmid DNA, and 3.1𝜇L H2O. The amplification conditions
were 95∘C for 10 s, followed by 40 cycles of 95∘C for 5 s
and 60∘C for 40 s. Fluorescent signal was detected for each
cycle at the end of the 60∘C extension step. For each assay,
a standard curve was generated with 10-fold serially diluted
plasmid standards of 102–106copies/𝜇L. Meanwhile positive
and negative reference samples were detected along with
unknown samples. After 40 amplification cycles, melting
curve analysis was carried out with the conditions of 95∘C
for 1s and 60∘C for 15 s and then increased to 95∘C while
continuously collecting the fluorescent signal. The melting
temperature (Tm) of each strain was analyzed to verify the
PRRSV type.
The 10𝜇L duplex TaqMan probe real-time PCR reaction
mixtures contained 5.0𝜇L Premix Ex Taq (2×) (TaKaRa),
0.2𝜇L of each forward (NSP2-qF) and reverse (NSP2-qR)
primer (10𝜇M), 0.2𝜇L of each probe (Pb-H and Pb-N or
Pb-all and Pb-N, 10𝜇M), 1.5𝜇L cDNA or plasmid DNA,
and 2.7𝜇L H<sub>2</sub>O. The amplification conditions were 95∘C for
10 s, followed by 45 cycles of 95∘C for 5 s and 60∘C for 40 s.
For each assay, a standard curve was generated with
10-fold serially diluted plasmid standards of 101–106copies/𝜇L.
The FAM (6-carboxyfluorescein) and HEX
(hexachloro-6-carboxyfluorescein) signals were detected for each cycle at the
end of the 60∘C extension step.
</div>
<span class='text_page_counter'>(3)</span><div class='page_container' data-page=3>
Table 2: Intra- and interassay reproducibility of real-time PCR.
Concentration of standard
plasmid (copies/𝜇L) 𝑛
Intra-assay (Cp) Interassay (Cp)
Mean SD CV (%) Mean SD CV (%)
HP-PRRSV (SYBR)
106 <sub>3</sub> <sub>14.96</sub> <sub>0.02</sub> <sub>0.13</sub> <sub>14.82</sub> <sub>0.29</sub> <sub>1.96</sub>
104 <sub>3</sub> <sub>21.78</sub> <sub>0.04</sub> <sub>0.18</sub> <sub>21.49</sub> <sub>0.57</sub> <sub>2.65</sub>
102 <sub>3</sub> <sub>28.5</sub> <sub>0.16</sub> <sub>0.56</sub> <sub>28.48</sub> <sub>0.27</sub> <sub>0.95</sub>
PRRSV (SYBR)
106 <sub>3</sub> <sub>15.47</sub> <sub>0.02</sub> <sub>0.13</sub> <sub>15.75</sub> <sub>0.31</sub> <sub>1.97</sub>
104 <sub>3</sub> <sub>22.55</sub> <sub>0.05</sub> <sub>0.22</sub> <sub>22.71</sub> <sub>0.19</sub> <sub>0.84</sub>
102 <sub>3</sub> <sub>29.6</sub> <sub>0.01</sub> <sub>0.03</sub> <sub>29.96</sub> <sub>0.34</sub> <sub>1.13</sub>
HP-PRRSV (FAM)
106 <sub>3</sub> <sub>15.9</sub> <sub>0.02</sub> <sub>0.13</sub> <sub>15.98</sub> <sub>0.06</sub> <sub>0.38</sub>
104 <sub>3</sub> <sub>22.51</sub> <sub>0.01</sub> <sub>0.04</sub> <sub>22.63</sub> <sub>0.15</sub> <sub>0.66</sub>
102 <sub>3</sub> <sub>29.71</sub> <sub>0.02</sub> <sub>0.07</sub> <sub>29.59</sub> <sub>0.17</sub> <sub>0.57</sub>
PRRSV (HEX)
106 <sub>3</sub> <sub>16.59</sub> <sub>0.15</sub> <sub>0.90</sub> <sub>16.47</sub> <sub>0.04</sub> <sub>0.24</sub>
104 <sub>3</sub> <sub>23.41</sub> <sub>0.09</sub> <sub>0.38</sub> <sub>23.44</sub> <sub>0.37</sub> <sub>1.58</sub>
102 <sub>3</sub> <sub>29.75</sub> <sub>0.04</sub> <sub>0.13</sub> <sub>29.56</sub> <sub>0.28</sub> <sub>0.95</sub>
Kit I (Omega) and quantified by measuring OD<sub>260</sub> using
spectrophotometer ND-1000 (Wilmington, USA).
<b>3. Results and Discussion</b>
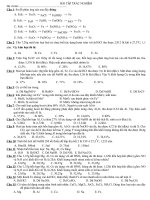
<i>3.1. SYBR Green I Real-Time PCR.</i> 10-fold serial plasmid
dilutions were tested and used to construct the standard
curve. The generated standard curve covered a linear range
of3.93 × 102 to 3.93 × 10⁶ copies/𝜇L for HP-PRRSV and
8.56 × 10²<sub>to</sub><sub>8.56 × 10</sub>6<sub>copies/𝜇L for PRRSV. Both standard</sub>
curves had a slope of−3.410 to−3.443 and an efficiency of
1.964 to 1.952, which indicate a high PCR efficiency of the
experiment (Figures2(a)and 2(b)). The amplification with
primers NSP2-qF and NSP2-qR yielded 85 bp and 172 bp
amplified product within NSP2 of both HP-PRRSV (GD) and
PRRSV (CH-1a), respectively (Figure 1), which was sufficient
to discriminate between melting peaks of the two PRRSV
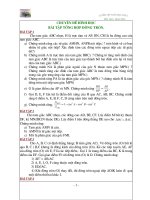
strains. The mean and standard deviation of Tm of
HP-PRRSV and HP-PRRSV were85.17 ± 0.12∘C and87.27 ± 0.07∘C,
respectively (Figure 3(b)).
<i>3.2. TaqMan Probe Real-Time PCR.</i> The generated standard
curve covered a linear range of 3.93 × 101 to 3.93 × 10⁶
copies/𝜇L for HP-PRRSV and 8.56 × 101 <sub>to</sub> <sub>8.56 × 10</sub>6
copies/𝜇L for PRRSV. Both standard curves had a slope of
−3.256 to−3.400 and an efficiency of 2.028 to 1.968, which
indicate a high PCR efficiency of the experiment (Figures2(c)
and2(d)). Two TaqMan probes specific to HP-PRRSV and
PRRSV strains combined in duplex real-time PCR system
can specifically detect the two PRRSV strains. When the
two TaqMan probes of Pb-H (FAM) and Pb-N (HEX) were
combined in a duplex real-time PCR system, only the FAM
fluorescent signal could be observed in the template of
M 1 2 3 M 4 5 6
(bp)
1500
1000
500
200
100
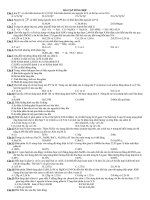
Figure 1: Conventional PCR results of PRRSV NSP2 gene. M: 100 bp
marker; 1 and 4: HP-PRRSV (GD) strain; 2 and 5: PRRSV (CH-1a)
strain; 3 and 6: negative.
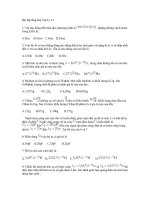
GD HP-PRRSV strain, and only the HEX fluorescent signal
could be observed in the template of CH-1a PRRSV strain
(Figure 4). However, when Pb-N (HEX) and Pb-all (FAM)
were combined in a duplex real-time PCR system, only HEX
fluorescent signal could be observed when the template was
CH-1a PRRSV strain, and FAM fluorescent signal could be
observed when the templates were GD and CH-1a strains
(Figure 4).
</div>
<span class='text_page_counter'>(4)</span><div class='page_container' data-page=4>
Table 3: Detection results of samples by conventional and real-time PCR.
Samples Number
Methods
Conventional PCR SYBR Green I TaqMan probe
HP-PRRSV PRRSV HP-PRRSV PRRSV HP-PRRSV PRRSV
Reference strains 4 2 2 2 2 2 2
Serum 1 15 6 4 6 5 6 6
Serum 2 39 0 5 0 6 0 8
Serum 3 477 2 0 19 0 34 7
Cr
ossin
g
p
oin
t
16
20
24
2 3 4 5 6
28 Error:0.00915
Efficiency:1.964
Slope:−3.410
Ylntercept:35.25
Link:107.0
Log concentration
(a)
2 3 4 5 6
Log concentration
Cr
ossin
g
p
oin
t Error:Efficiency:0.01771.952
Slope:−3.443
Ylntercept:37.40
Link: 1,027
16
20
24
28
(b)
1 2 3 4 5 6
Log concentration
Cr
ossin
g
p
oin
t
20
30
25
Error:0.0146
Efficiency:2.028
Slope:−3.2 56
Ylntercept:36.36
Link: 8,979
(c)
1 2 3 4 5 6
Log concentration
Cr
ossin
g
p
oin
t Error:Efficiency:0.01391.968
Slope:−3.400
Ylntercept:36.39
Link: 81,820
20
30
25
(d)
Figure 2: Standard curves were generated based on Cp values of 10-fold dilutions of plasmid DNA. Regression lines between the Cp (𝐶<sub>𝑇</sub>)
values and the input concentrations of HP-PRRSV (a) and PRRSV (b) plasmid DNA in real-time RT-PCR detected using SYBR Green I and
HP-PRRSV (c) and PRRSV (d) using TaqMan probe, respectively.
10-fold serially diluted plasmid standards of HP-PRRSV
(pMD20-GD) and PRRSV (pMD20-CH1a) were used as
templates for sensitivity tests in both conventional PCR and
real-time PCR using SYBR Green I and TaqMan probe.
The results showed that real-time PCR using both SYBR
Green I (Figure 6) and TaqMan probe (Figure 5) can be used
to detect concentrations at least 100copies/𝜇L of plasmid
standards whereas the sensitivity of conventional PCR was
only 103copies/𝜇L.
The intra- and interassay reproducibility were evaluated
using three replicates of 106, 104, and 102copies/𝜇L plasmid
standards of both pMD20-GD and pMD20-CH1a. Mean and
coefficient of variation (CV) for the𝐶<sub>𝑇</sub>value were calculated.
The results showed that neither the CVs of intra-assay nor the
CVs of interassay were more than 5% (Table 2), indicating the
reproducibility of the two assays.
Our results showed that real-time PCR using both SYBR
Green I and TaqMan probe could be used to simultaneously
detect and differentiate HP-PRRSV and PRRSV in China. But
the TaqMan probe method had the highest detection rate,
whereas the conventional RT-PCR was the lowest. The SYBR
Green I real-time PCR assay is timesaving, easy to handle, and
highly sensitive. Yang et al. detected the PRRSV and CSFV
RNA by SYBR Green I-based quantitative PCR and found
that both sensitivity and specificity were equal or superior to
conventional RT-PCR [14]. Although Tian et al. developed
a rapid SYBR one step real-time RT-PCR for detection of
PRRSV [15], it could not be used for simultaneous detection
and differentiation of HP-PRRSV and classical North
Amer-ican type PRRSV (PRRSV). Kleiboeker et al. developed dual
labeled probes quantitative PCR, which could simultaneously
detect NA- and EU-PRRSV [16]. However, this assay could
not simultaneously detect and differentiate between both
HP-PRRSV and classical North American type HP-PRRSV (HP-PRRSV)
strains in China. The TaqMan probe method provided more
accurate results than SYBR Green I with melting curve
anal-ysis. SYBR Green I real-time PCR assay was simpler, rapider,
and lower in cost than TaqMan probe method. In addition to
the high specificity, sensitivity, and reproducibility, the
real-time PCR assay based on both SYBR Green I and TaqMan
probe established by us could recognize coinfection of
HP-PRRSV and HP-PRRSV. Because the two types of HP-PRRSV isolates
coexist in Chinese swine herds, recombination could occur.
Therefore, the results provided alternative diagnostic assays
in diverse PRRSV epidemiological circumstances.
</div>
<span class='text_page_counter'>(5)</span><div class='page_container' data-page=5>
8.486
10.486
12.486
14.486
0.486
2.486
6.486
4.486
Cycles
Amplification curves
2 6 10 14 18 22 26 30 34 38
Fl
uo
re
scence
(
483
–
533
)
HP-PRRSV
PRRSV
(a)
60 64 68 72 76 80 84 88 92
0.101
0.701
1.301
1.901
2.501
3.101
HP-PRRSV PRRSV
Melting peaks
Tm
−(
d/
dT
)
flu
or
es
cence
(
48
3
–
533
)
(b)
Figure 3: Specific amplification curves and melting curve analysis by SYBR Green I real-time PCR. (a) Specific amplification curves.
Fluorescent curves were observed when HP-PRRSV (GD) and PRRSV (CH-1a) were used as templates; no fluorescent signals were observed
when the templates were other viruses and host cells. (b) Melting curves. Tm of HP-PRRSV = 85.17±0.12∘C; Tm of PRRSV= 87.27±0.07∘C.
Pb-H (FAM signal)
−0.600
Cycles
Amplification curves
2 6 10 14 18 22 26 30 34 38 42
8.400
11.900
14.900
Fl
uo
re
scence
(
483
–
533
)
2.400
5.400
(a)
Pb-N (HEX signal)
−0.223
Cycles
Amplification curves
2 6 10 14 18 22 26 30 34 38 42
1.853
2.853
3.853
4.853
Fl
uo
re
scence
(
523
–
568
)
0.853
(b)
Pb-N (HEX signal)
−0.147
Cycles
Amplification curves
2 6 10 14 18 22 26 30 34 38 42
0.853
1.853
2.853
3.853
4.853
Fl
uo
re
scence
(
523
–
568
)
(c)
Pb-all (FAM signal)
Pb-all (FAM signal)
−0.475
Cycles
Amplification curves
2 6 10 14 18 22 26 30 34 38 42
1.525
3.525
5.525
7.525
9.525
10.525
12.525
14.525
Fl
uo
re
scence
(
483
–
533
)
(d)
Figure 4: Specific amplification curves by duplex TaqMan probe real-time PCR. When Pb-H (FAM) and Pb-N (HEX) probes were combined
in a duplex real-time PCR system, only the FAM fluorescent signal could be observed when the template was GD HP-PRRSV strain, no FAM
signal was detected when the templates were CH-1a PRRSV strain and other viruses (a), and vice versa, only the HEX signal could be collected
when the template was CH-1a PRRSV strain (b). When Pb-N (HEX) and Pb-all (FAM) were combined in a duplex real-time PCR system, the
Pb-N (HEX signal) probe could only detect PRRSV strain (c), whereas Pb-all (FAM signal) probe could detect both HP-PRRSV and PRRSV
strains (d).
531 serum samples showed that the TaqMan probe real-time
PCR had the highest detection rate, whereas the
conven-tional RT-PCR had the lowest detection rate. To evaluate
comprehensively the practicality of this assay, clinical samples
that span a broader geographical origin should be tested in
the future.
<b>4. Conclusions</b>
The real-time RT-PCR for simultaneous detection and
dif-ferentiation of HP-PRRSV and PRRSV by using both SYBR
Green and TaqMan probes was developed and validated.
Both assays can be used for rapid detection and
strain-specific identification of HP-PRRSV and PRRSV. A total of
535 samples were tested by real-time PCR and conventional
RT-PCR. The results of 4 reference strains for real-time PCR
assays were consistent with that of conventional PCR method.
The results of 531 serum samples showed that the TaqMan
probe method had the highest detection rate whereas the
conventional RT-PCR was the lowest. The real-time PCR
developed based on SYBR Green and TaqMan probe could
be used for simultaneous detection and differentiation of
HP-PRRSV and HP-PRRSV in China, which provided two alternative
diagnostic assays in diverse PRRSV epidemiological
circum-stances.
<b>Conflict of Interests</b>
</div>
<span class='text_page_counter'>(6)</span><div class='page_container' data-page=6>
M <sub>10</sub>10<sub>10</sub>9 <sub>10</sub>8 <sub>10</sub>7 <sub>10</sub>6 <sub>10</sub>5 <sub>10</sub>4 <sub>10</sub>3 <sub>10</sub>2 <sub>10</sub>1 <sub>10</sub>0<sub>Neg</sub>
(a)
0.528
6.028
3.028
12.028
15.028
9.528
Cycles
Amplification curves
2 6 10 14 18 22 26 30 34 38
Fl
uo
re
scence
(
483
–
533
)
106
107 105 104 103 102101 100
Neg
(b)
0.699
4.699
8.699
20.699
12.699
16.699
Cycles
Amplification curves
5 10 15 20 25 30 35 40 45
Fl
uo
re
scence
(
483
–
533
)
106 105104103102 101100
Neg
(c)
Figure 5: Comparison of sensitivity for HP-PRRSV detection by conventional RT-PCR and real-time PCR. Samples were 10-fold serially
diluted plasmid standards of HP-PRRSV. M: 100 bp marker; Neg: negative control.
M 1010109 108 107 106 105 104 103 102 101 100 Neg
(a)
107
0.900
3.900
6.900
9.900
12.900
15.900
Cycles
Amplification curves
2 6 10 14 18 22 26 30 34 38
Fl
uo
re
scence
(
483
–
533
)
Neg
106 105 104 103 102 101100
(b)
Cycles
Amplification curves
5 10 15 20 25 30 35 40 45
Fl
uo
re
scence
(
523
–
568
)
-0.225
1.775
3.775
7.775
9.775
11.775
5.775 106105 104103 102101 100
Neg
(c)
Figure 6: Comparison of sensitivity for PRRSV detection by conventional RT-PCR and real-time PCR. Samples were 10-fold serially diluted
plasmid standards of PRRSV. M: 100 bp marker; Neg: negative control.
<b>Acknowledgments</b>
This work was supported by National Natural Science
Foun-dation Grant no. 31101690 from China, Agriculture Research
System Grant no. CARS-36 from China, and Open Project
Grant no. SKLBC12 K13 from the State Key Laboratory of
Biocontrol.
<b>References</b>
[1] S. Xiao, J. Jia, D. Mo et al., “Understanding PRRSV infection
in porcine lung based on genome-wide transcriptome response
identified by deep sequencing,”<i>PLoS ONE, vol. 5, no. 6, Article</i>
ID e11377, 2010.
</div>
<span class='text_page_counter'>(7)</span><div class='page_container' data-page=7>
molecular dissection of the unique hallmark,”<i>PLoS ONE, vol. 2,</i>
no. 6, article e526, 2007.
[3] Y. Li, X. Wang, K. Bo et al., “Emergence of a highly pathogenic
porcine reproductive and respiratory syndrome virus in the
Mid-Eastern region of China,”<i>Veterinary Journal, vol. 174, no.</i>
3, pp. 577–584, 2007.
[4] G.-Z. Tong, Y.-J. Zhou, X.-F. Hao, Z.-J. Tian, T.-Q. An, and H.-J.
Qiu, “Highly pathogenic porcine reproductive and respiratory
syndrome, China,”<i>Emerging Infectious Diseases, vol. 13, no. 9,</i>
pp. 1434–1436, 2007.
[5] Y. Feng, T. Zhao, T. Nguyen et al., “Porcine respiratory and
reproductive syndrome virus variants, Vietnam and China,
2007,”<i>Emerging Infectious Diseases, vol. 14, no. 11, pp. 1774–1776,</i>
2008.
[6] M. Ying, Y. Feng, D. Liu, and G. F. Gao, “Avian influenza
virus, streptococcus suis serotype 2, severe acute respiratory
syndrome-coronavirus and beyond: molecular epidemiology,
ecology and the situation in China,”<i>Philosophical Transactions</i>
<i>of the Royal Society B: Biological Sciences, vol. 364, no. 1530, pp.</i>
2725–2737, 2009.
[7] D. Normile, “China, Vietnam grapple with âĂIJrapidly
evolvingâĂİ pig virus,”<i>Science, vol. 317, no. 5841, p. 1017, 2007.</i>
[8] Y.-J. Zhou, X.-F. Hao, Z.-J. Tian et al., “Highly virulent
porcine reproductive and respiratory syndrome virus emerged
in China,”<i>Transboundary and Emerging Diseases, vol. 55, no. </i>
3-4, pp. 152–163-4, 2008.
[9] W. Lurchachaiwong, S. Payungporn, U. Srisatidnarakul, C.
Mungkundar, A. Theamboonlers, and Y. Poovorawan, “Rapid
detection and strain identification of porcine reproductive and
respiratory syndrome virus (PRRSV) by real-time RT-PCR,”
<i>Letters in Applied Microbiology, vol. 46, no. 1, pp. 55–60, 2008.</i>
[10] E. MartÃŋnez, P. Riera, M. SitjÃă, Y. Fang, S. Oliveira, and
J. Maldonado, “Simultaneous detection and genotyping of
porcine reproductive and respiratory syndrome virus (PRRSV)
by real-time RT-PCR and amplicon melting curve analysis
using SYBR Green,”<i>Research in Veterinary Science, vol. 85, no.</i>
1, pp. 184–193, 2008.
[11] A. Wasilk, J. D. Callahan, J. Christopher-Hennings et al.,
“Detec-tion of U.S., lelystad, and european-like porcine reproductive
and respiratory syndrome viruses and relative quantitation in
boar semen and serum samples by real-time PCR,”<i>Journal of</i>
<i>Clinical Microbiology, vol. 42, no. 10, pp. 4453–4461, 2004.</i>
[12] X.-L. Xiao, H. Wu, Y.-G. Yu et al., “Rapid detection of a highly
virulent Chinese-type isolate of Porcine Reproductive and
Respiratory Syndrome virus by real-time reverse transcriptase
PCR,”<i>Journal of Virological Methods, vol. 149, no. 1, pp. 49–55,</i>
2008.
[13] S. Xiao, Q. Wang, J. Jia et al., “Proteome changes of lungs
artificially infected with H-PRRSV and N-PRRSV by
two-dimensional fluorescence difference gel electrophoresis,”<i></i>
<i>Virol-ogy Journal, vol. 7, article 107, 2010.</i>
[14] Z.-Z. Yang, W.-H. Fang, and M. Habib, “First results of detection
of PRRSV and CSFV RNA by SYBR green I-based quantitative
PCR,”<i>Journal of Veterinary Medicine B: Infectious Diseases and</i>
<i>Veterinary Public Health, vol. 53, no. 10, pp. 461–467, 2006.</i>
[15] H. Tian, J. Wu, Y. Shang, Y. Chen, and X. Liu, “The development
of a rapid SYBR one step real-time RT-PCR for detection of
porcine reproductive and respiratory syndrome virus,”<i>Virology</i>
<i>Journal, vol. 7, article 90, 2010.</i>
[16] S. B. Kleiboeker, S. K. Schommer, S.-M. Lee, S. Watkins, W.
Chittick, and D. Polson, “Simultaneous detection of North
</div>
<!--links-->
bai tap tong hop
- 4
- 664
- 0


.push({});</script> </div> </div> </div> <div class="vf_link_relate px-2 my-2"> <h2 class="vf_doc_relate text-2xl font-bold my-4">Tài liệu liên quan</h2> <ul class="grid grid-cols-12 gap-2"> <li class="col-span-6 md:col-span-2"> <div class="card-doc " onclick="actionDocRelated(this)"> <a class="card-doc-img" href="https://text.123docz.com/document/414619-bai-tap-tong-hop.htm" title="bai tap tong hop"> <i class="icon i_type_doc i_type_doc1"></i> <img class="lazy" src="data:image/gif;base64,R0lGODlhAQABAIAAAP///wAAACH5BAEAAAAALAAAAAABAAEAAAICRAEAOw==" data-src="https://media.store123doc.com/images/document/13/ne/hm/medium_hms1367558021.jpg" width="124" height="179" alt="bai tap tong hop" onerror="this.src=)